Estimated zip code population in 2022: 42,113 Zip code population in 2010: 39,150 Zip code population in 2000: 39,491
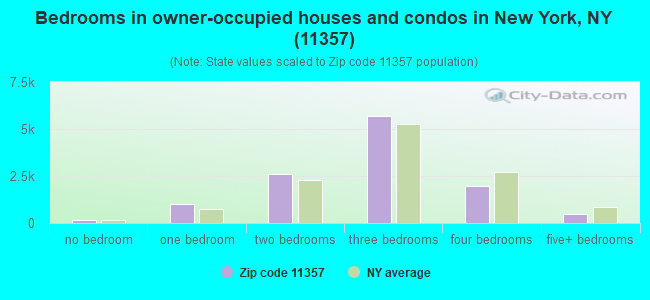
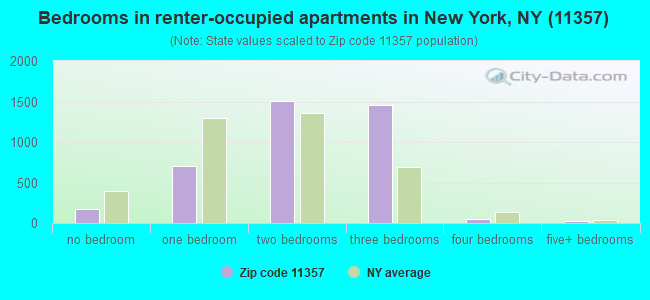
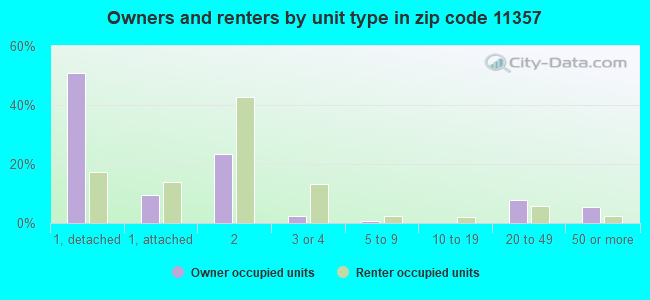
Houses and condos: 16,521 Renter-occupied apartments: 3,925
% of renters here:
25%
State:
46%
March 2022 cost of living index in zip code 11357: 154.1 (very high, U.S. average is 100)
Land area: 2.8 sq. mi. Water area: 0.0 sq. mi.
Population density: 15,033 people per square mile
(very high).
OSM Map
General Map
Google Map
MSN Map
OSM Map
General Map
Google Map
MSN Map
OSM Map
General Map
Google Map
MSN Map
OSM Map
General Map
Google Map
MSN Map
Please wait while loading the map...
Real estate property taxes paid for housing units in 2022:
This zip code:
0.9% ($8,832)
New York:
1.5% ($6,180)
Median real estate property taxes paid for housing units with mortgages in 2022: $9,332 (0.9%) Median real estate property taxes paid for housing units with no mortgage in 2022: $8,385 (0.9%)
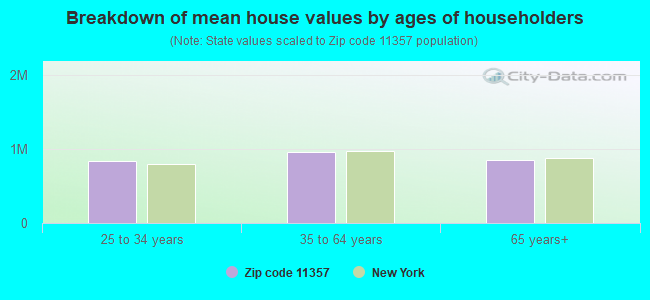
Estimated median house/condo value in 2022: $945,282
11357:
$945,282
New York:
$400,400
According to our research of New York and other state lists, there were 10 registered sex offenders living in 11357 zip code as of April 27, 2024. The ratio of all residents to sex offenders in zip code 11357 is 3,982 to 1. The ratio of registered sex offenders to all residents in this zip code is much lower than the state average.
Median resident age:
This zip code:
48.1 years
New York median age:
40.0 years
Average household size:
This zip code:
2.6 people
New York:
2.5 people
Averages for the 2020 tax year for zip code 11357, filed in 2021:
Average Adjusted Gross Income (AGI) in 2020: $87,549 (Individual Income Tax Returns)
Here:
$87,549
State:
$90,930
Salary/wage: $70,243 (reported on 74.1% of returns)
Here:
$70,243
State:
$72,104
(% of AGI for various income ranges: 1060.6% for AGIs below $25k, 3288.2% for AGIs $25k-50k, 6685.2% for AGIs $50k-75k, 10065.4% for AGIs $75k-100k, 18978.1% for AGIs $100k-200k, 85756.5% for AGIs over 200k)
Taxable interest for individuals: $2,640 (reported on 45.1% of returns)
This zip code:
$2,640
New York:
$3,075
(% of AGI for various income ranges: 50.9% for AGIs below $25k, 66.4% for AGIs $25k-50k, 114.7% for AGIs $50k-75k, 179.3% for AGIs $75k-100k, 267.7% for AGIs $100k-200k, 2942.2% for AGIs over 200k)
Ordinary dividends: $5,633 (reported on 28.7% of returns)
Here:
$5,633
State:
$11,095
(% of AGI for various income ranges: 49.2% for AGIs below $25k, 76.2% for AGIs $25k-50k, 166.3% for AGIs $50k-75k, 236.8% for AGIs $75k-100k, 484.6% for AGIs $100k-200k, 3625.8% for AGIs over 200k)
Net capital gain/loss in AGI: +$17,898 (reported on 27.1% of returns)
Here:
+$17,898
State:
+$44,925
(% of AGI for various income ranges: 22.1% for AGIs below $25k, 80.0% for AGIs $25k-50k, 165.4% for AGIs $50k-75k, 226.6% for AGIs $75k-100k, 837.2% for AGIs $100k-200k, 19310.2% for AGIs over 200k)
Profit/loss from business: +$12,514 (reported on 16.9% of returns)
Here:
+$12,514
State:
+$14,940
(% of AGI for various income ranges: 228.1% for AGIs below $25k, 244.3% for AGIs $25k-50k, 178.6% for AGIs $50k-75k, 342.7% for AGIs $75k-100k, 421.3% for AGIs $100k-200k, 3382.8% for AGIs over 200k)
Taxable individual retirement arrangement distribution: $16,318 (reported on 10.0% of returns)
11357:
$16,318
New York:
$19,609
(% of AGI for various income ranges: 67.9% for AGIs below $25k, 131.2% for AGIs $25k-50k, 230.6% for AGIs $50k-75k, 327.8% for AGIs $75k-100k, 596.6% for AGIs $100k-200k, 1989.2% for AGIs over 200k)
Self-employed (Keogh) retirement plans: $24,780 (reported on 0.5% of returns)
11357:
$24,780
New York:
$32,497
(% of AGI for various income ranges: 10.1% for AGIs $25k-50k, 22.1% for AGIs $100k-200k, 439.5% for AGIs over 200k)
Total itemized deductions: $30,320 (reported on 14.9% of returns)
Here:
$30,320
State:
$39,326
(% of AGI for various income ranges: 124.5% for AGIs below $25k, 275.3% for AGIs $25k-50k, 579.3% for AGIs $50k-75k, 910.3% for AGIs $75k-100k, 1642.2% for AGIs $100k-200k, 7158.0% for AGIs over 200k)
Charity contributions: $5,544 (reported on 12.1% of returns)
Here:
$5,544
State:
$15,420
(% of AGI for various income ranges: 5.2% for AGIs below $25k, 12.5% for AGIs $25k-50k, 44.6% for AGIs $50k-75k, 105.2% for AGIs $75k-100k, 210.0% for AGIs $100k-200k, 1832.0% for AGIs over 200k)
Taxes paid: $9,277 (reported on 14.8% of returns)
11357:
$9,277
State:
$9,183
(% of AGI for various income ranges: 36.0% for AGIs below $25k, 84.2% for AGIs $25k-50k, 190.8% for AGIs $50k-75k, 331.7% for AGIs $75k-100k, 559.0% for AGIs $100k-200k, 1656.2% for AGIs over 200k)
Earned income credit: $1,811 (reported on 12.8% of returns)
Here:
$1,811
State:
$2,138
(% of AGI for various income ranges: 76.4% for AGIs below $25k, 72.4% for AGIs $25k-50k, 0.8% for AGIs $50k-75k)
Percentage of individuals using paid preparers for their 2020 taxes: 95.4%
Here:
95%
State:
95%
(% for various income ranges: 94.0% for AGIs below $25k, 96.5% for AGIs $25k-50k, 96.2% for AGIs $50k-75k, 95.1% for AGIs $75k-100k, 96.1% for AGIs $100k-200k, 95.3% for AGIs over 200k)
Averages for the 2012 tax year for zip code 11357, filed in 2013:
Average Adjusted Gross Income (AGI) in 2012: $72,979 (Individual Income Tax Returns)
Here:
$72,979
State:
$77,088
Salary/wage: $65,091 (reported on 75.7% of returns)
Here:
$65,091
State:
$60,593
(% of AGI for various income ranges: 57.3% for AGIs below $25k, 70.4% for AGIs $25k-50k, 73.0% for AGIs $50k-75k, 71.9% for AGIs $75k-100k, 75.0% for AGIs $100k-200k, 54.2% for AGIs over 200k)
Taxable interest for individuals: $1,801 (reported on 56.1% of returns)
This zip code:
$1,801
New York:
$3,125
(% of AGI for various income ranges: 3.1% for AGIs below $25k, 1.8% for AGIs $25k-50k, 1.4% for AGIs $50k-75k, 1.1% for AGIs $75k-100k, 1.1% for AGIs $100k-200k, 1.5% for AGIs over 200k)
Ordinary dividends: $5,218 (reported on 30.9% of returns)
Here:
$5,218
State:
$10,299
(% of AGI for various income ranges: 3.0% for AGIs below $25k, 1.8% for AGIs $25k-50k, 1.7% for AGIs $50k-75k, 1.8% for AGIs $75k-100k, 1.5% for AGIs $100k-200k, 3.5% for AGIs over 200k)
Net capital gain/loss in AGI: +$8,767 (reported on 24.6% of returns)
Here:
+$8,767
State:
+$42,474
(% of AGI for various income ranges: 0.2% for AGIs $50k-75k, 0.5% for AGIs $75k-100k, 1.5% for AGIs $100k-200k, 9.2% for AGIs over 200k)
Profit/loss from business: +$16,364 (reported on 15.5% of returns)
Here:
+$16,364
State:
+$16,168
(% of AGI for various income ranges: 14.9% for AGIs below $25k, 5.1% for AGIs $25k-50k, 2.6% for AGIs $50k-75k, 2.3% for AGIs $75k-100k, 2.2% for AGIs $100k-200k, 3.4% for AGIs over 200k)
Taxable individual retirement arrangement distribution: $13,656 (reported on 13.3% of returns)
11357:
$13,656
New York:
$17,621
(% of AGI for various income ranges: 4.9% for AGIs below $25k, 3.5% for AGIs $25k-50k, 2.6% for AGIs $50k-75k, 2.6% for AGIs $75k-100k, 2.4% for AGIs $100k-200k, 1.7% for AGIs over 200k)
Self-employment retirement plans: $20,529 (reported on 0.7% of returns)
11357:
$20,529
New York:
$27,330
(% of AGI for various income ranges: 0.3% for AGIs $50k-75k, 0.2% for AGIs $100k-200k, 0.4% for AGIs over 200k)
Total itemized deductions: $28,471 (24% of AGI, reported on 49.5% of returns)
Here:
$28,471
State:
$34,985
Here:
24.4% of AGI
State:
21.3% of AGI
(% of AGI for various income ranges: 15.2% for AGIs below $25k, 16.2% for AGIs $25k-50k, 19.3% for AGIs $50k-75k, 19.4% for AGIs $75k-100k, 20.6% for AGIs $100k-200k, 19.6% for AGIs over 200k)
Charity contributions: $2,520 (reported on 43.0% of returns)
Here:
$2,520
State:
$5,572
(% of AGI for various income ranges: 0.8% for AGIs below $25k, 1.3% for AGIs $25k-50k, 1.6% for AGIs $50k-75k, 1.6% for AGIs $75k-100k, 1.7% for AGIs $100k-200k, 1.3% for AGIs over 200k)
Taxes paid: $15,149 (reported on 49.5% of returns)
11357:
$15,149
State:
$18,656
(% of AGI for various income ranges: 4.6% for AGIs below $25k, 5.7% for AGIs $25k-50k, 8.2% for AGIs $50k-75k, 9.3% for AGIs $75k-100k, 10.9% for AGIs $100k-200k, 13.7% for AGIs over 200k)
Earned income credit: $1,870 (reported on 11.4% of returns)
Here:
$1,870
State:
$2,230
(% of AGI for various income ranges: 4.4% for AGIs below $25k, 0.7% for AGIs $25k-50k)
Percentage of individuals using paid preparers for their 2012 taxes: 77.4%
Here:
77%
State:
66%
(% for various income ranges: 75.1% for AGIs below $25k, 75.7% for AGIs $25k-50k, 78.1% for AGIs $50k-75k, 78.7% for AGIs $75k-100k, 79.8% for AGIs $100k-200k, 84.0% for AGIs over 200k)
Averages for the 2004 tax year for zip code 11357, filed in 2005:
Average Adjusted Gross Income (AGI) in 2004: $57,342 (Individual Income Tax Returns)
Here:
$57,342
State:
$59,519
Salary/wage: $53,326 (reported on 74.9% of returns)
Here:
$53,326
State:
$50,673
(% of AGI for various income ranges: 132.2% for AGIs below $10k, 56.4% for AGIs $10k-25k, 74.4% for AGIs $25k-50k, 75.7% for AGIs $50k-75k, 75.3% for AGIs $75k-100k, 64.3% for AGIs over 100k)
Taxable interest for individuals: $2,173 (reported on 70.9% of returns)
This zip code:
$2,173
New York:
$2,377
(% of AGI for various income ranges: 22.2% for AGIs below $10k, 5.9% for AGIs $10k-25k, 2.9% for AGIs $25k-50k, 2.6% for AGIs $50k-75k, 2.1% for AGIs $75k-100k, 2.2% for AGIs over 100k)
Taxable dividends: $3,179 (reported on 38.0% of returns)
Here:
$3,179
State:
$5,394
(% of AGI for various income ranges: 13.4% for AGIs below $10k, 3.2% for AGIs $10k-25k, 1.9% for AGIs $25k-50k, 1.7% for AGIs $50k-75k, 1.8% for AGIs $75k-100k, 2.2% for AGIs over 100k)
Net capital gain/loss: +$7,963 (reported on 31.6% of returns)
Here:
+$7,963
State:
+$23,581
(% of AGI for various income ranges: -2.8% for AGIs below $10k, -0.4% for AGIs $10k-25k, 0.1% for AGIs $25k-50k, 0.2% for AGIs $50k-75k, 0.7% for AGIs $75k-100k, 9.5% for AGIs over 100k)
Profit/loss from business: +$13,777 (reported on 15.6% of returns)
Here:
+$13,777
State:
+$13,809
(% of AGI for various income ranges: 19.1% for AGIs below $10k, 10.4% for AGIs $10k-25k, 4.8% for AGIs $25k-50k, 2.7% for AGIs $50k-75k, 3.3% for AGIs $75k-100k, 2.9% for AGIs over 100k)
IRA payment deduction: $3,704 (reported on 5.7% of returns)
11357:
$3,704
New York:
$3,115
(% of AGI for various income ranges: 0.9% for AGIs below $10k, 0.6% for AGIs $10k-25k, 0.6% for AGIs $25k-50k, 0.5% for AGIs $50k-75k, 0.4% for AGIs $75k-100k, 0.2% for AGIs over 100k)
Self-employed pension: $14,959 (reported on 1.1% of returns)
Here:
$14,959
New York:
$19,016
(% of AGI for various income ranges: 0.1% for AGIs $25k-50k, 0.2% for AGIs $50k-75k, 0.2% for AGIs $75k-100k, 0.4% for AGIs over 100k)
Total itemized deductions: $22,113 (25% of AGI, reported on 50.9% of returns)
Here:
$22,113
State:
$25,864
Here:
24.9% of AGI
State:
21.9% of AGI
(% of AGI for various income ranges: 36.9% for AGIs below $10k, 15.7% for AGIs $10k-25k, 18.7% for AGIs $25k-50k, 21.2% for AGIs $50k-75k, 20.9% for AGIs $75k-100k, 19.1% for AGIs over 100k)
Charity contributions deductions: $2,619 (3% of AGI, reported on 47.6% of returns)
Here:
$2,619
State:
$4,439
Here:
2.9% of AGI
State:
3.6% of AGI
(% of AGI for various income ranges: 1.9% for AGIs below $10k, 1.5% for AGIs $10k-25k, 2.2% for AGIs $25k-50k, 2.5% for AGIs $50k-75k, 2.4% for AGIs $75k-100k, 2.1% for AGIs over 100k)
Total tax: $8,961 (reported on 81.0% of returns)
11357:
$8,961
State:
$11,730
(% of AGI for various income ranges: 7.3% for AGIs below $10k, 4.5% for AGIs $10k-25k, 7.6% for AGIs $25k-50k, 9.7% for AGIs $50k-75k, 11.0% for AGIs $75k-100k, 17.2% for AGIs over 100k)
Earned income credit: $1,412 (reported on 8.0% of returns)
Here:
$1,412
State:
$1,757
Percentage of individuals using paid preparers for their 2004 taxes: 75.6%
Here:
76%
State:
67%
(% for various income ranges: 71.1% for AGIs below $10k, 74.0% for AGIs $10k-25k, 74.8% for AGIs $25k-50k, 77.5% for AGIs $50k-75k, 78.6% for AGIs $75k-100k, 79.6% for AGIs over 100k)
Likely homosexual households (counted as self-reported same-sex unmarried-partner households)
Lesbian couples: 0.0% of all households
Gay men: 0.2% of all households
Household received Food Stamps/SNAP in the past 12 months: 1,078 Household did not receive Food Stamps/SNAP in the past 12 months: 14,600
Women who had a birth in the past 12 months: 398 (336 now married, 59 unmarried) Women who did not have a birth in the past 12 months: 7,892 (3,426 now married, 4,438 unmarried)
Housing units in zip code 11357 with a mortgage: 5,849 (590 second mortgage, 8 home equity loan, 521 both second mortgage and home equity loan) Houses without a mortgage: 296
Median monthly owner costs for units with a mortgage: $3,345 Median monthly owner costs for units without a mortgage: $1,276
Residents with income below the poverty level in 2022:
This zip code:
7.6%
Whole state:
14.3%
Residents with income below 50% of the poverty level in 2022:
This zip code:
3.7%
Whole state:
6.8%
Median number of rooms in houses and condos:
Here:
5.7
State:
6.3
Median number of rooms in apartments:
Here:
4.2
State:
3.8
Notable locations in this zip code not listed on our city pages
Notable locations in zip code 11357: Whitestone Branch Queens Borough Public Library (A), Fire Department New York Engine 295 Ladder 144 (B), New York Ladder Company 144 (C), Nadia's Performing Arts Center (D). Display/hide their locations on the map
Churches in zip code 11357 include: Covenant Church (A), Christian Testimony Church (B), Blessed Presbyterian Church (C), Saint Nicholas Orthodox Church (D), Saint Lukes Roman Catholic Church (E), Immanuel Lutheran Church (F), Grace Episcopal Church (G), First Presbyterian Church (H), New Creation Presbyterian Church (I). Display/hide their locations on the map
Parks in zip code 11357 include: G U Harvey Playground (1), Francis Lewis Park (2), Whitestone Playground (3), Alexander Grey Triangle (4), Private McKee Triangle (5), Clintonville Playground (6), Willets Point Playground (7), Playground Twenty-One (8). Display/hide their locations on the map
6,059 married couples with children.
1,155 single-parent households (363 men, 792 women).
51.2% of residents of 11357 zip code speak English at home.
11.5% of residents speak Spanish at home (62% very well, 24% well, 12% not well, 2% not at all).
15.9% of residents speak other Indo-European language at home (68% very well, 23% well, 7% not well, 1% not at all).
20.7% of residents speak Asian or Pacific Island language at home (35% very well, 25% well, 32% not well, 8% not at all).
1.2% of residents speak other language at home (90% very well, 6% well, 4% not well).
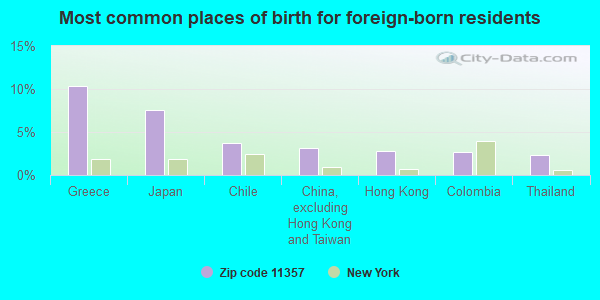
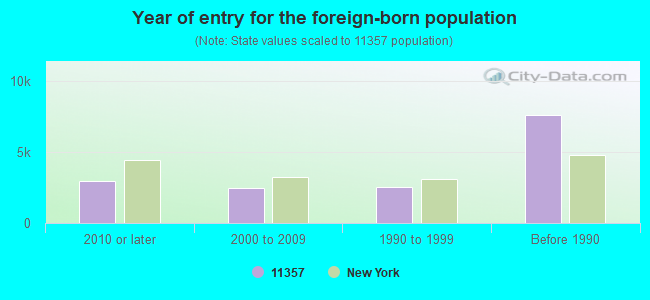
Foreign born population: 14,837 (35.2%) (74.4% of them are naturalized citizens)
This zip code:
35.2%
Whole state:
22.7%
10%Greece
8%Japan
4%Chile
3%China, excluding Hong Kong and Taiwan
3%Hong Kong
3%Colombia
2%Thailand
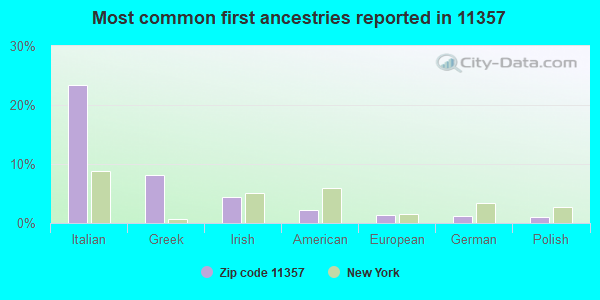
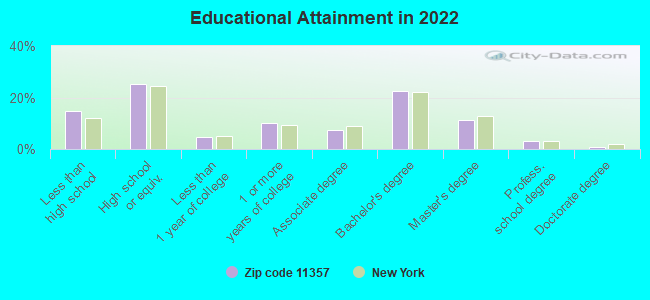
23%Italian
8%Greek
4%Irish
2%American
1%European
1%German
1%Polish
Year of entry for the foreign-born population
2,9672010 or later
2,4782000 to 2009
2,5541990 to 1999
7,612Before 1990
Facilities with environmental interests located in this zip code:
ANGEL S CLEANERS (17-06 UTOPIA PKWY in WHITESTONE, NY)
AIR MINOR (AIRS/AFS) STATE MASTER (New York facility tracking) - AIR PROGRAM Small Quantity Generators, between 100 kg and 1000 kg of hazardous waste/month (Resource Conservation and Recovery Act (tracking hazardous waste)) Business SIC classification: DRYCLEANING PLANTS, EXCEPT RUG CLEANING Organizations: NEW ANGELS CLEANERS INC, DANNY LEI (CONTACT/OPERATOR)
, WASSCO ASSOC (CONTACT/OWNER)
, Y & Y DRY CLEANERS (LEGALLY RESPONSIBLE PARTY)
, MACBELL CLEANERS INC (LEGALLY RESPONSIBLE PARTY)
Alternative names: ANGEL'S CLEANERS, RED RIBBON CLEANERS
GRACE ASSOCIATES INC (151-17 SIXTH RD in QUEENS, NY)
AIR SYNTHETIC MINOR (AIRS/AFS) STATE MASTER (New York facility tracking) - National Pollutant Discharge Elimination System Permit, AIR PROGRAM Business SIC classification: NONMETALLIC MINERAL PRODUCTS; BRICK, STONE, AND RELATED CONSTRUCTION MATERIALS Organizations: GRACE INDUSTRIES INC (LEGALLY RESPONSIBLE PARTY)
Alternative names: GRACE ASSOCIATES - 151-45 6TH RD
BIG APPLE WRECKING & CONST CORP (17-22 WHITESTONE EXPY in WHITESTONE, NY)
(Integrated Compliance Information System) - ICIS-02-2000-1010, FORMAL ENFORCEMENT ACTION Business SIC classification: WRECKING AND DEMOLITION WORK
ANTHONY GRACE AND SONS (151-45 6TH ROAD in WHITESTONE, NY)
AIR SYNTHETIC MINOR (AIRS/AFS) Large Quantity Generators, more that 1000 kg of hazardous waste/month (Resource Conservation and Recovery Act (tracking hazardous waste)) - notification Business SIC classification: GYPSUM PRODUCTS Organizations: KINGS POINT TAVESTORS LLC (CONTACT/OWNER)
Alternative names: ENDENWALD CONTRACT, KINGS POINT DEPOT, METROPOLITAN ASPHALT
ARRAY CLEANERS (20-07 UTOPIA PARKWAY in WHITESTONE, NY)
AIR MINOR (AIRS/AFS) Conditionally Exempt Small Quantity Generators, less than 100 kg/month of hazardous waste (Resource Conservation and Recovery Act (tracking hazardous waste)) - notification Business SIC classification: DRYCLEANING PLANTS, EXCEPT RUG CLEANING Organizations: ALEXA JORDYN CORP (CONTACT/OWNER)
CON ED (143-01 21 ROAD in WHITESTOWN, NY)
HAZARDOUS WASTE BIENNIAL REPORTER (Resource Conservation and Recovery Act (tracking hazardous waste)) (Resource Conservation and Recovery Act (tracking hazardous waste))
ACTION DIAGNOSTIC CENTER (11-12 CLINTONVILLE ST in WHITESTONE, NY)
(Resource Conservation and Recovery Act (tracking hazardous waste))
GULF OIL (32-27 FRANCIS LEWIS BLVD in BAYSIDE, NY)
AIR MINOR (AIRS/AFS) Business SIC classification: GASOLINE SERVICE STATIONS
HAR-BEE OIL SERVICE INC (10-11 147TH ST in WHITESTONE, NY)
Small Quantity Generators, between 100 kg and 1000 kg of hazardous waste/month (Resource Conservation and Recovery Act (tracking hazardous waste)) - notification USED OIL PROGRAM (Resource Conservation and Recovery Act (tracking hazardous waste)) Organizations: RICHARD BRENNAN (CONTACT/OWNER)
J & C DRY CLEANERS INC (24-07 150TH ST in WHITESTONE, NY)
Conditionally Exempt Small Quantity Generators, less than 100 kg/month of hazardous waste (Resource Conservation and Recovery Act (tracking hazardous waste)) - notification
Housing units lacking complete plumbing facilities: 0.2% Housing units lacking complete kitchen facilities: 0.6%
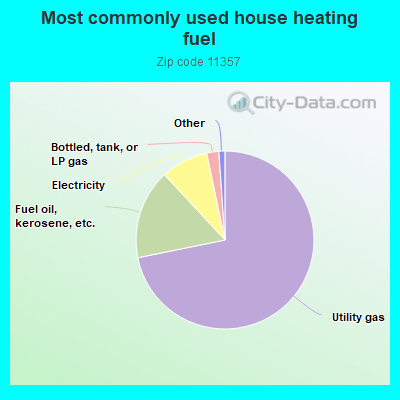
71.8%Utility gas
16.3%Fuel oil, kerosene, etc.
8.6%Electricity
2.2%Bottled, tank, or LP gas
Population in 1990: 39,093. Population change in the 1990s: +398 (+1.0%).
Place of birth for U.S.-born residents:
This state: 24,894
Northeast: 367
Midwest: 161
South: 576
West: 210
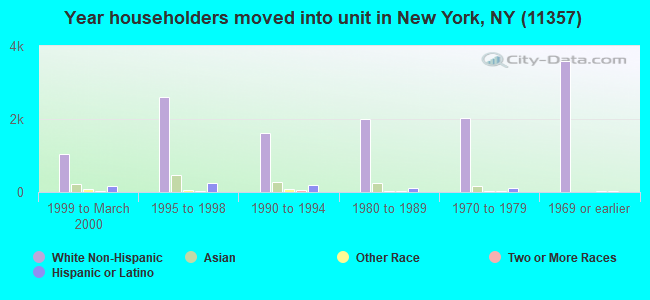
71% of the 11357 zip code residents lived in the same house 5 years ago. Out of people who lived in different houses, 77% lived in this county. Out of people who lived in different counties, 50% lived in New York.
93% of the 11357 zip code residents lived in the same house 1 year ago. Out of people who lived in different houses, 69% moved from this county. Out of people who lived in different houses, 14% moved from different county within same state. Out of people who lived in different houses, 13% moved from different state. Out of people who lived in different houses, 2% moved from abroad.
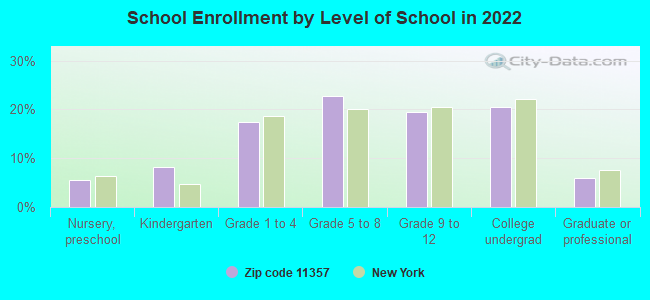
Private vs. public school enrollment:
Students in private schools in grades 1 to 8 (elementary and middle school): 671
Here:
17.9%
New York:
15.6%
Students in private schools in grades 9 to 12 (high school): 901
Here:
49.8%
New York:
15.0%
Students in private undergraduate colleges: 570
Here:
30.1%
New York:
39.2%
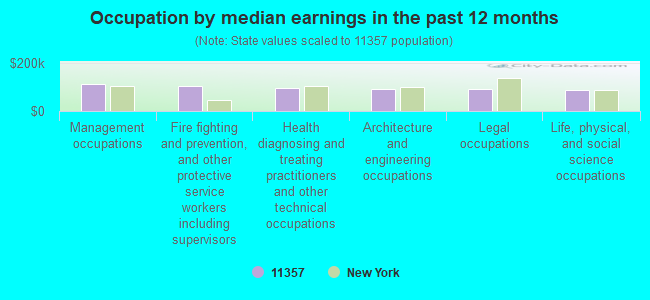
Occupation by median earnings in the past 12 months ($)
112,653Management occupations
105,666Fire fighting and prevention, and other protective service workers including supervisors
97,764Health diagnosing and treating practitioners and other technical occupations
93,753Architecture and engineering occupations
92,998Legal occupations
86,968Life, physical, and social science occupations
Companies with federal contracts located in this zip code:
TULGER CONTRACTING CORP (15045 CROSS ISLAND PKWY in WHITESTONE, NY; small business)
$2,329,700 with Army for Construction of Structures and Facilities -- Other Administrative Facilities and Service Buildings. Signed on 1999-11-15. Completion date: 2000-12-31.
MULTI ELECTRODE SYSTEMS, INC (164-07 NORTHERN BLVD 2ND in FLUSHING, NY; small business)
$39,800 with Air Force for Maintenance, Repair and Rebuilding of Equipment -- Instruments and Laboratory Equipment. Taking place in OH. Signed on 2003-09-03. Completion date: 2003-09-30.
THERMAX/CDT, INC (19-02 WHITESTONE EXPRSSWY in WHITESTONE, NY; small business) : $18,590 in 3 contractsin 2005
$12,500 with U.S. Coast Guard for Cable, Cord, and Wire Assemblies: Communications Equipment. Signed on 2005-05-10. Completion date: 2005-05-27.
$6,090 with Navy for Wire, Nonelectrical. Signed on 2005-09-07. Completion date: 2005-11-04.
$0 with U.S. Coast Guard for Cable, Cord, and Wire Assemblies: Communications Equipment. Signed on 2005-05-10. Completion date: 2005-05-27.
Top industries in this zip code by the number of employees in 2005:
2004 - 2018 National Fire Incident Reporting System (NFIRS) incidents
According to the data from the years 2004 - 2018 the average number of fires per year is 89. The highest number of reported fires - 131 took place in 2016, and the least - 2 in 2006. The data has an increasing trend.
When looking into fire subcategories, the most reports belonged to: Structure Fires (68.9%), and Outside Fires (18.8%).
Fire incident types reported to NFIRS in Zip Code 11357


 Nearest zip codes: 11351, 11354, 11358, 11360, 11356, 11359.


 According to the data from the years 2004 - 2018 the average number of fires per year is 89. The highest number of reported fires - 131 took place in 2016, and the least - 2 in 2006. The data has an increasing trend.
 When looking into fire subcategories, the most reports belonged to: Structure Fires (68.9%), and Outside Fires (18.8%).