Estimated zip code population in 2022: 45,687 Zip code population in 2010: 42,252 Zip code population in 2000: 41,566
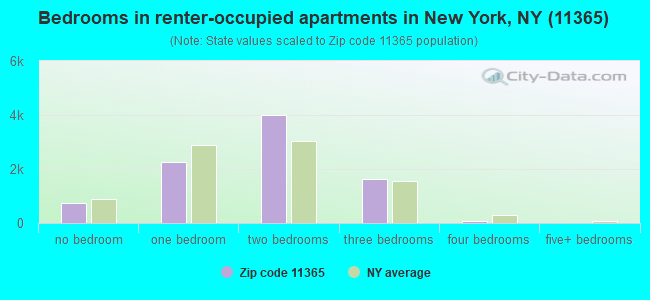
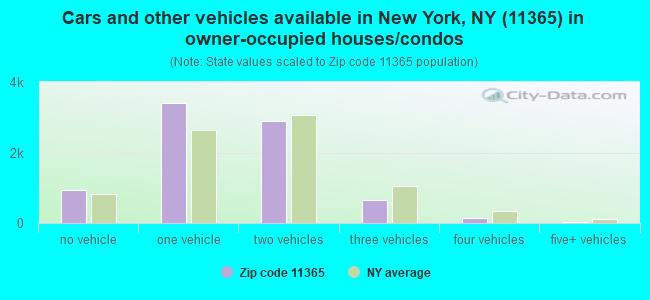
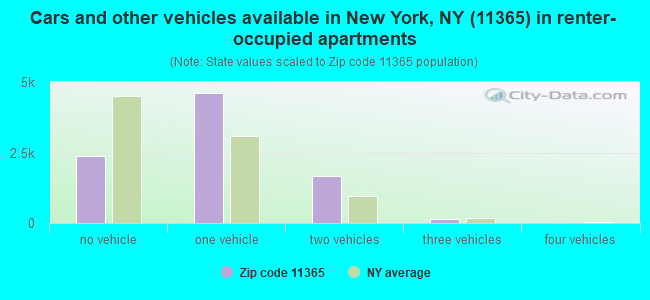
Houses and condos: 16,993 Renter-occupied apartments: 8,752
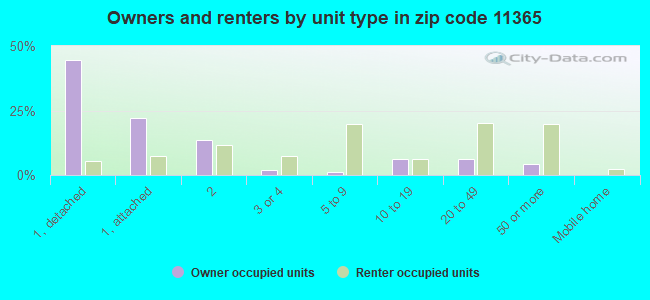
% of renters here:
52%
State:
46%
March 2022 cost of living index in zip code 11365: 154.4 (very high, U.S. average is 100)
Land area: 2.5 sq. mi. Water area: 0.0 sq. mi.
Population density: 18,299 people per square mile
(very high).
OSM Map
General Map
Google Map
MSN Map
OSM Map
General Map
Google Map
MSN Map
OSM Map
General Map
Google Map
MSN Map
OSM Map
General Map
Google Map
MSN Map
Please wait while loading the map...
Real estate property taxes paid for housing units in 2022:
This zip code:
0.9% ($8,149)
New York:
1.5% ($6,180)
Median real estate property taxes paid for housing units with mortgages in 2022: $8,840 (0.9%) Median real estate property taxes paid for housing units with no mortgage in 2022: $7,477 (0.9%)
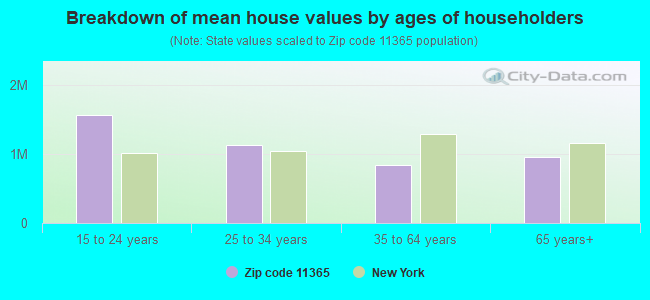
Estimated median house/condo value in 2022: $923,391
11365:
$923,391
New York:
$400,400
According to our research of New York and other state lists, there were 11 registered sex offenders living in 11365 zip code as of April 27, 2024. The ratio of all residents to sex offenders in zip code 11365 is 4,114 to 1. The ratio of registered sex offenders to all residents in this zip code is much lower than the state average.
Median resident age:
This zip code:
43.2 years
New York median age:
40.0 years
Average household size:
This zip code:
2.7 people
New York:
2.5 people
Averages for the 2020 tax year for zip code 11365, filed in 2021:
Average Adjusted Gross Income (AGI) in 2020: $56,606 (Individual Income Tax Returns)
Here:
$56,606
State:
$90,930
Salary/wage: $50,816 (reported on 76.2% of returns)
Here:
$50,816
State:
$72,104
(% of AGI for various income ranges: 940.2% for AGIs below $25k, 3231.4% for AGIs $25k-50k, 6646.4% for AGIs $50k-75k, 10517.5% for AGIs $75k-100k, 18946.4% for AGIs $100k-200k, 65823.5% for AGIs over 200k)
Taxable interest for individuals: $1,672 (reported on 30.6% of returns)
This zip code:
$1,672
New York:
$3,075
(% of AGI for various income ranges: 21.8% for AGIs below $25k, 32.2% for AGIs $25k-50k, 55.1% for AGIs $50k-75k, 108.8% for AGIs $75k-100k, 227.8% for AGIs $100k-200k, 1449.1% for AGIs over 200k)
Ordinary dividends: $4,561 (reported on 19.0% of returns)
Here:
$4,561
State:
$11,095
(% of AGI for various income ranges: 18.4% for AGIs below $25k, 32.2% for AGIs $25k-50k, 65.6% for AGIs $50k-75k, 179.7% for AGIs $75k-100k, 414.4% for AGIs $100k-200k, 3413.0% for AGIs over 200k)
Net capital gain/loss in AGI: +$13,077 (reported on 19.5% of returns)
Here:
+$13,077
State:
+$44,925
(% of AGI for various income ranges: 14.3% for AGIs below $25k, 47.7% for AGIs $25k-50k, 105.7% for AGIs $50k-75k, 256.9% for AGIs $75k-100k, 718.6% for AGIs $100k-200k, 17413.9% for AGIs over 200k)
Profit/loss from business: +$8,332 (reported on 21.1% of returns)
Here:
+$8,332
State:
+$14,940
(% of AGI for various income ranges: 230.5% for AGIs below $25k, 231.4% for AGIs $25k-50k, 163.2% for AGIs $50k-75k, 191.1% for AGIs $75k-100k, 389.1% for AGIs $100k-200k, 2644.8% for AGIs over 200k)
Taxable individual retirement arrangement distribution: $16,359 (reported on 5.3% of returns)
11365:
$16,359
New York:
$19,609
(% of AGI for various income ranges: 29.7% for AGIs below $25k, 54.0% for AGIs $25k-50k, 94.9% for AGIs $50k-75k, 248.9% for AGIs $75k-100k, 402.8% for AGIs $100k-200k, 2215.2% for AGIs over 200k)
Self-employed (Keogh) retirement plans: $19,129 (reported on 0.3% of returns)
11365:
$19,129
New York:
$32,497
(% of AGI for various income ranges: 30.9% for AGIs $100k-200k, 381.7% for AGIs over 200k)
Total itemized deductions: $28,701 (reported on 7.9% of returns)
Here:
$28,701
State:
$39,326
(% of AGI for various income ranges: 56.2% for AGIs below $25k, 148.0% for AGIs $25k-50k, 292.4% for AGIs $50k-75k, 604.0% for AGIs $75k-100k, 1151.3% for AGIs $100k-200k, 5360.4% for AGIs over 200k)
Charity contributions: $7,253 (reported on 5.8% of returns)
Here:
$7,253
State:
$15,420
(% of AGI for various income ranges: 1.8% for AGIs below $25k, 9.5% for AGIs $25k-50k, 36.0% for AGIs $50k-75k, 78.2% for AGIs $75k-100k, 215.2% for AGIs $100k-200k, 1830.0% for AGIs over 200k)
Taxes paid: $8,815 (reported on 7.8% of returns)
11365:
$8,815
State:
$9,183
(% of AGI for various income ranges: 15.3% for AGIs below $25k, 40.9% for AGIs $25k-50k, 99.4% for AGIs $50k-75k, 212.0% for AGIs $75k-100k, 386.4% for AGIs $100k-200k, 1218.7% for AGIs over 200k)
Earned income credit: $2,030 (reported on 20.8% of returns)
Here:
$2,030
State:
$2,138
(% of AGI for various income ranges: 101.3% for AGIs below $25k, 94.6% for AGIs $25k-50k, 1.4% for AGIs $50k-75k)
Percentage of individuals using paid preparers for their 2020 taxes: 94.1%
Here:
94%
State:
95%
(% for various income ranges: 91.9% for AGIs below $25k, 95.9% for AGIs $25k-50k, 95.7% for AGIs $50k-75k, 94.9% for AGIs $75k-100k, 94.7% for AGIs $100k-200k, 94.8% for AGIs over 200k)
Averages for the 2012 tax year for zip code 11365, filed in 2013:
Average Adjusted Gross Income (AGI) in 2012: $53,403 (Individual Income Tax Returns)
Here:
$53,403
State:
$77,088
Salary/wage: $49,660 (reported on 79.2% of returns)
Here:
$49,660
State:
$60,593
(% of AGI for various income ranges: 65.0% for AGIs below $25k, 79.5% for AGIs $25k-50k, 80.7% for AGIs $50k-75k, 78.4% for AGIs $75k-100k, 77.5% for AGIs $100k-200k, 52.7% for AGIs over 200k)
Taxable interest for individuals: $1,425 (reported on 40.4% of returns)
This zip code:
$1,425
New York:
$3,125
(% of AGI for various income ranges: 1.5% for AGIs below $25k, 0.9% for AGIs $25k-50k, 0.9% for AGIs $50k-75k, 0.9% for AGIs $75k-100k, 1.0% for AGIs $100k-200k, 1.5% for AGIs over 200k)
Ordinary dividends: $3,993 (reported on 20.5% of returns)
Here:
$3,993
State:
$10,299
(% of AGI for various income ranges: 1.6% for AGIs below $25k, 1.0% for AGIs $25k-50k, 1.3% for AGIs $50k-75k, 1.2% for AGIs $75k-100k, 1.6% for AGIs $100k-200k, 2.4% for AGIs over 200k)
Net capital gain/loss in AGI: +$4,222 (reported on 17.0% of returns)
Here:
+$4,222
State:
+$42,474
(% of AGI for various income ranges: 0.3% for AGIs $75k-100k, 0.7% for AGIs $100k-200k, 7.8% for AGIs over 200k)
Profit/loss from business: +$13,033 (reported on 19.4% of returns)
Here:
+$13,033
State:
+$16,168
(% of AGI for various income ranges: 20.3% for AGIs below $25k, 6.1% for AGIs $25k-50k, 2.4% for AGIs $50k-75k, 2.2% for AGIs $75k-100k, 1.9% for AGIs $100k-200k, 4.9% for AGIs over 200k)
Taxable individual retirement arrangement distribution: $15,371 (reported on 8.0% of returns)
11365:
$15,371
New York:
$17,621
(% of AGI for various income ranges: 2.5% for AGIs below $25k, 2.0% for AGIs $25k-50k, 1.9% for AGIs $50k-75k, 1.6% for AGIs $75k-100k, 2.3% for AGIs $100k-200k, 3.6% for AGIs over 200k)
Self-employment retirement plans: $18,133 (reported on 0.5% of returns)
11365:
$18,133
New York:
$27,330
(% of AGI for various income ranges: 0.2% for AGIs $50k-75k, 0.2% for AGIs $100k-200k, 0.5% for AGIs over 200k)
Total itemized deductions: $23,158 (23% of AGI, reported on 34.7% of returns)
Here:
$23,158
State:
$34,985
Here:
23.1% of AGI
State:
21.3% of AGI
(% of AGI for various income ranges: 8.1% for AGIs below $25k, 11.3% for AGIs $25k-50k, 14.8% for AGIs $50k-75k, 16.1% for AGIs $75k-100k, 17.9% for AGIs $100k-200k, 16.1% for AGIs over 200k)
Charity contributions: $3,228 (reported on 28.3% of returns)
Here:
$3,228
State:
$5,572
(% of AGI for various income ranges: 0.4% for AGIs below $25k, 1.1% for AGIs $25k-50k, 1.7% for AGIs $50k-75k, 1.9% for AGIs $75k-100k, 2.0% for AGIs $100k-200k, 2.4% for AGIs over 200k)
Taxes paid: $11,320 (reported on 34.6% of returns)
11365:
$11,320
State:
$18,656
(% of AGI for various income ranges: 2.3% for AGIs below $25k, 3.5% for AGIs $25k-50k, 6.0% for AGIs $50k-75k, 7.5% for AGIs $75k-100k, 9.6% for AGIs $100k-200k, 10.8% for AGIs over 200k)
Earned income credit: $2,176 (reported on 22.3% of returns)
Here:
$2,176
State:
$2,230
(% of AGI for various income ranges: 7.7% for AGIs below $25k, 1.5% for AGIs $25k-50k)
Percentage of individuals using paid preparers for their 2012 taxes: 72.8%
Here:
73%
State:
66%
(% for various income ranges: 72.2% for AGIs below $25k, 73.3% for AGIs $25k-50k, 71.4% for AGIs $50k-75k, 73.2% for AGIs $75k-100k, 74.8% for AGIs $100k-200k, 74.4% for AGIs over 200k)
Averages for the 2004 tax year for zip code 11365, filed in 2005:
Average Adjusted Gross Income (AGI) in 2004: $47,586 (Individual Income Tax Returns)
Here:
$47,586
State:
$59,519
Salary/wage: $45,999 (reported on 78.2% of returns)
Here:
$45,999
State:
$50,673
(% of AGI for various income ranges: 103.4% for AGIs below $10k, 62.9% for AGIs $10k-25k, 82.3% for AGIs $25k-50k, 79.8% for AGIs $50k-75k, 81.7% for AGIs $75k-100k, 68.4% for AGIs over 100k)
Taxable interest for individuals: $1,877 (reported on 60.1% of returns)
This zip code:
$1,877
New York:
$2,377
(% of AGI for various income ranges: 11.5% for AGIs below $10k, 3.9% for AGIs $10k-25k, 2.0% for AGIs $25k-50k, 2.0% for AGIs $50k-75k, 1.8% for AGIs $75k-100k, 2.4% for AGIs over 100k)
Taxable dividends: $3,121 (reported on 29.2% of returns)
Here:
$3,121
State:
$5,394
(% of AGI for various income ranges: 6.9% for AGIs below $10k, 2.0% for AGIs $10k-25k, 1.3% for AGIs $25k-50k, 1.6% for AGIs $50k-75k, 1.5% for AGIs $75k-100k, 2.4% for AGIs over 100k)
Net capital gain/loss: +$6,135 (reported on 22.4% of returns)
Here:
+$6,135
State:
+$23,581
(% of AGI for various income ranges: -6.2% for AGIs below $10k, -0.3% for AGIs $10k-25k, 0.8% for AGIs $25k-50k, 0.3% for AGIs $50k-75k, 0.8% for AGIs $75k-100k, 7.4% for AGIs over 100k)
Profit/loss from business: +$10,800 (reported on 18.6% of returns)
Here:
+$10,800
State:
+$13,809
(% of AGI for various income ranges: 36.0% for AGIs below $10k, 16.6% for AGIs $10k-25k, 4.4% for AGIs $25k-50k, 2.5% for AGIs $50k-75k, 1.7% for AGIs $75k-100k, 2.6% for AGIs over 100k)
IRA payment deduction: $3,520 (reported on 4.7% of returns)
11365:
$3,520
New York:
$3,115
(% of AGI for various income ranges: 0.5% for AGIs below $10k, 0.5% for AGIs $10k-25k, 0.6% for AGIs $25k-50k, 0.4% for AGIs $50k-75k, 0.3% for AGIs $75k-100k, 0.2% for AGIs over 100k)
Self-employed pension: $12,224 (reported on 0.7% of returns)
Here:
$12,224
New York:
$19,016
(% of AGI for various income ranges: 0.1% for AGIs $25k-50k, 0.1% for AGIs $50k-75k, 0.2% for AGIs $75k-100k, 0.3% for AGIs over 100k)
Total itemized deductions: $19,582 (24% of AGI, reported on 41.9% of returns)
Here:
$19,582
State:
$25,864
Here:
24.4% of AGI
State:
21.9% of AGI
(% of AGI for various income ranges: 12.8% for AGIs below $10k, 10.6% for AGIs $10k-25k, 15.8% for AGIs $25k-50k, 18.2% for AGIs $50k-75k, 19.0% for AGIs $75k-100k, 18.1% for AGIs over 100k)
Charity contributions deductions: $3,349 (4% of AGI, reported on 38.2% of returns)
Here:
$3,349
State:
$4,439
Here:
4.0% of AGI
State:
3.6% of AGI
(% of AGI for various income ranges: 0.6% for AGIs below $10k, 1.1% for AGIs $10k-25k, 2.2% for AGIs $25k-50k, 2.7% for AGIs $50k-75k, 2.7% for AGIs $75k-100k, 3.3% for AGIs over 100k)
Total tax: $6,890 (reported on 77.9% of returns)
11365:
$6,890
State:
$11,730
(% of AGI for various income ranges: 7.5% for AGIs below $10k, 5.0% for AGIs $10k-25k, 6.8% for AGIs $25k-50k, 9.7% for AGIs $50k-75k, 10.8% for AGIs $75k-100k, 16.1% for AGIs over 100k)
Earned income credit: $1,640 (reported on 15.4% of returns)
Here:
$1,640
State:
$1,757
Percentage of individuals using paid preparers for their 2004 taxes: 70.4%
Here:
70%
State:
67%
(% for various income ranges: 64.8% for AGIs below $10k, 73.2% for AGIs $10k-25k, 70.5% for AGIs $25k-50k, 71.0% for AGIs $50k-75k, 72.2% for AGIs $75k-100k, 72.3% for AGIs over 100k)
Household received Food Stamps/SNAP in the past 12 months: 2,281 Household did not receive Food Stamps/SNAP in the past 12 months: 14,393
Women who had a birth in the past 12 months: 349 (344 now married, 0 unmarried) Women who did not have a birth in the past 12 months: 9,456 (4,209 now married, 5,209 unmarried)
Housing units in zip code 11365 with a mortgage: 3,544 (228 second mortgage, 9 home equity loan, 208 both second mortgage and home equity loan) Houses without a mortgage: 112
Median monthly owner costs for units with a mortgage: $3,295 Median monthly owner costs for units without a mortgage: $1,119
Residents with income below the poverty level in 2022:
This zip code:
11.5%
Whole state:
14.3%
Residents with income below 50% of the poverty level in 2022:
This zip code:
5.3%
Whole state:
6.8%
Median number of rooms in houses and condos:
Here:
5.5
State:
6.3
Median number of rooms in apartments:
Here:
3.9
State:
3.8
Notable locations in this zip code not listed on our city pages
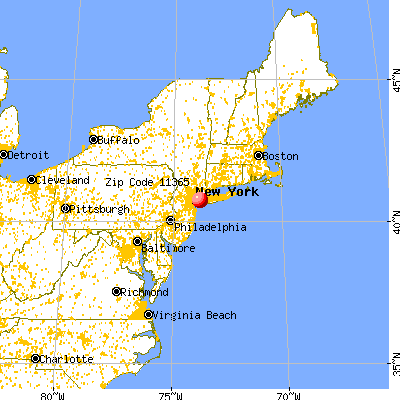
Notable locations in zip code 11365: Siegfried Stern Kissena Park Bicycle Track (A), Kissena Park Golf Course (B), Onehundredseventh Precinct Police Station (C), Pomonok Branch Queens Borough Public Library (D), Fire Department New York Engine 299 Ladder 152 (E), New York Ladder Company 152 (F), Bombay Theatre (G). Display/hide their locations on the map
Churches in zip code 11365 include: Annunciation of the Blessed Virgin Mary Church (A), Utopia Jewish Center (B), Israel Center of Hillcrest Manor (C), Heavenly Voice Presbyterian Church (D), Fresh Meadows Jewish Center (E), Joyful Church of New York (F), Immanuel Chinese Lutheran Church (G), Grace Community Church (H). Display/hide their locations on the map
Parks in zip code 11365 include: Kissena Park (1), Underhill Playground (2), Fresh Meadows Park (3), Utopia Playground (4), Fresh Meadows Playground (5), Electric Playground (6), Emerald Playground (7), Holy Cow Playground (8). Display/hide their locations on the map
Tourist attraction (not listed on the city page) : Jenna Psychic Spiritual (Botanical Gardens; 18316 Horace Harding Expressway).
6,543 married couples with children.
2,021 single-parent households (241 men, 1,780 women).
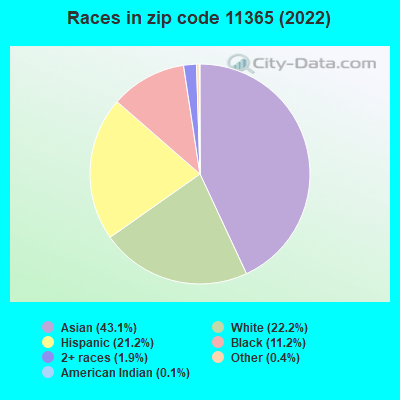
40.2% of residents of 11365 zip code speak English at home.
14.1% of residents speak Spanish at home (67% very well, 15% well, 13% not well, 5% not at all).
8.5% of residents speak other Indo-European language at home (60% very well, 31% well, 8% not well, 1% not at all).
35.8% of residents speak Asian or Pacific Island language at home (39% very well, 21% well, 32% not well, 8% not at all).
2.1% of residents speak other language at home (70% very well, 27% well, 3% not well).
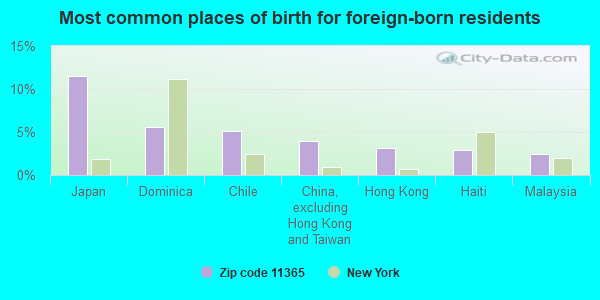
Foreign born population: 20,781 (45.5%) (69.5% of them are naturalized citizens)
This zip code:
45.5%
Whole state:
22.7%
11%Japan
6%Dominica
5%Chile
4%China, excluding Hong Kong and Taiwan
3%Hong Kong
3%Haiti
2%Malaysia
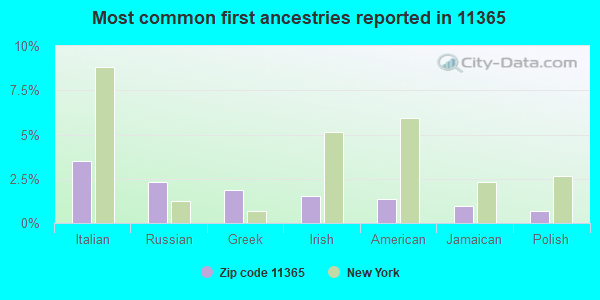
3%Italian
2%Russian
2%Greek
2%Irish
1%American
1%Jamaican
1%Polish
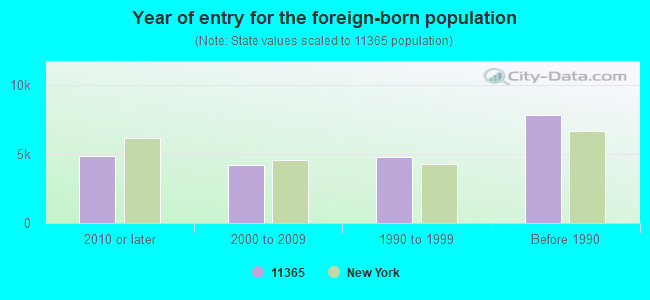
Year of entry for the foreign-born population
4,9012010 or later
4,2162000 to 2009
4,7761990 to 1999
7,845Before 1990
Public high school in in zip code 11365 not listed on the city page:
Major facilities with environmental interests located in this zip code:
CLOOS AUTO COLLISION LTD (59-33 FRESH MEADOW LANE in FLUSHING, NY)
STATE MASTER (New York facility tracking) - AIR PROGRAM Small Quantity Generators, between 100 kg and 1000 kg of hazardous waste/month (Resource Conservation and Recovery Act (tracking hazardous waste)) - notification Organizations: FRANK SCACCIA (CONTACT/OWNER)
, RON CLOOS - FRANK SCACCIA (LEGALLY RESPONSIBLE PARTY)
195-02 69TH AVENUE SCHOOL - P-26 (195-02 69TH AVENUE in FLUSHING, NY)
AIR SYNTHETIC MINOR (AIRS/AFS) STATE MASTER (New York facility tracking) - AIR PROGRAM Business SIC and NAICS classification: ELEMENTARY AND SECONDARY SCHOOLS Organizations: NYC DEPT OF EDUCATION (LEGALLY RESPONSIBLE PARTY)
Alternative names: PUBLIC SCHOOL 26
CON ED - DOWNING ST & 32ND AVE (DOWNING ST & 32ND AVE in FLUSHING, NY)
HAZARDOUS WASTE BIENNIAL REPORTER (Resource Conservation and Recovery Act (tracking hazardous waste)) (Resource Conservation and Recovery Act (tracking hazardous waste)) Alternative names: V0947
CON EDISON - VS 5831 (W/S 168TH ST 25N/O CROCHEERON in FRESH MEADOWS, NY)
Large Quantity Generators, more that 1000 kg of hazardous waste/month (Resource Conservation and Recovery Act (tracking hazardous waste)) Organizations: CONSOLIDATED EDISON COMPANY OF NY, INC. (CONTACT/OPERATOR)
CON ED - MH 5511 (N/E/C 65 AVE KISSENA BLVD in FLUSHING, NY)
HAZARDOUS WASTE BIENNIAL REPORTER (Resource Conservation and Recovery Act (tracking hazardous waste)) (Resource Conservation and Recovery Act (tracking hazardous waste))
CON ED - V 572 (F/O 158-11 JEWEL AVE in FLUSHING, NY)
HAZARDOUS WASTE BIENNIAL REPORTER (Resource Conservation and Recovery Act (tracking hazardous waste)) (Resource Conservation and Recovery Act (tracking hazardous waste))
65-76 160TH ST BUILDING (65-76 160TH ST in QUEENS, NY)
AIR MINOR (AIRS/AFS) Business SIC classification: OPERATORS OF APARTMENT BUILDINGS
A C A - AMOCO #583 (166-15 HORACE HARDING BLVD in FRESH MEADOWS, NY)
(Resource Conservation and Recovery Act (tracking hazardous waste))
GOODYEAR TIRE (61-44 FRESH MEADOW LANE in FLUSHING, NY)
(Resource Conservation and Recovery Act (tracking hazardous waste))
ISLAND TRANSPORTATION CORP (184-17 HORACE HARDING BLVD in FRESH MEADOWS, NY)
(Resource Conservation and Recovery Act (tracking hazardous waste))
CORDAY CLEANERS (184-20 HORACE HARDING EXPWY in FRESH MEADOWS, NY)
(Resource Conservation and Recovery Act (tracking hazardous waste))
BEST AUTO RENTAL INC (69-15 164TH ST in FLUSHING, NY)
(Resource Conservation and Recovery Act (tracking hazardous waste))
CHRIS PAPAS PRECISION (59-43 FRESH MEADOW LANE in FLUSHING, NY)
(Resource Conservation and Recovery Act (tracking hazardous waste))
Housing units lacking complete plumbing facilities: 0.4% Housing units lacking complete kitchen facilities: 0.9%
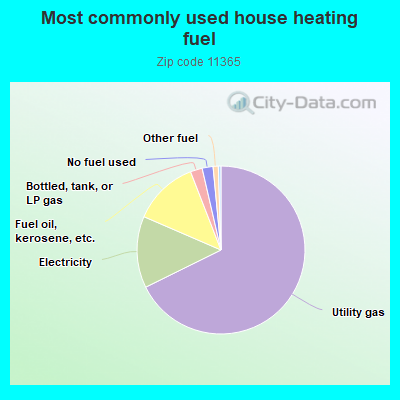
67.7%Utility gas
13.8%Electricity
12.6%Fuel oil, kerosene, etc.
2.3%Bottled, tank, or LP gas
2.1%No fuel used
1.0%Other fuel
Population in 1990: 34,087. Population change in the 1990s: +7,479 (+21.9%).
Place of birth for U.S.-born residents:
This state: 21,976
Northeast: 465
Midwest: 179
South: 600
West: 535
67% of the 11365 zip code residents lived in the same house 5 years ago. Out of people who lived in different houses, 68% lived in this county. Out of people who lived in different counties, 50% lived in New York.
92% of the 11365 zip code residents lived in the same house 1 year ago. Out of people who lived in different houses, 52% moved from this county. Out of people who lived in different houses, 21% moved from different county within same state. Out of people who lived in different houses, 19% moved from different state. Out of people who lived in different houses, 9% moved from abroad.
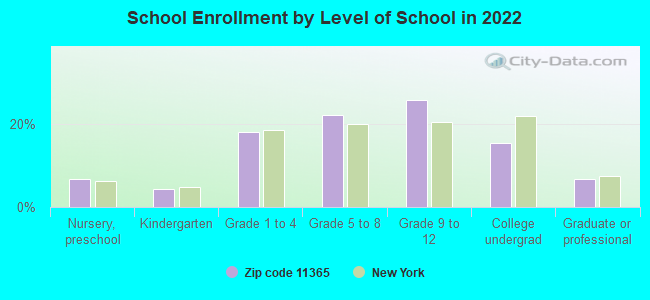
Private vs. public school enrollment:
Students in private schools in grades 1 to 8 (elementary and middle school): 640
Here:
15.5%
New York:
15.6%
Students in private schools in grades 9 to 12 (high school): 287
Here:
10.8%
New York:
15.0%
Students in private undergraduate colleges: 456
Here:
28.7%
New York:
39.2%
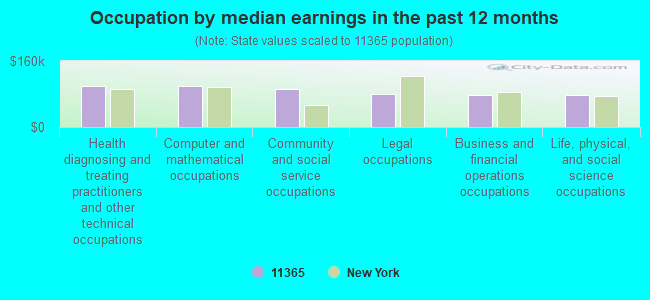
Occupation by median earnings in the past 12 months ($)
98,705Health diagnosing and treating practitioners and other technical occupations
98,522Computer and mathematical occupations
92,244Community and social service occupations
81,050Legal occupations
78,458Business and financial operations occupations
78,110Life, physical, and social science occupations
Companies with federal contracts located in this zip code:
JEFFREY WEISSMAN, INC (19662 67TH AVE in FRESH MEADOWS, NY; small business)
$8,325 with Army for Musical Instruments. Signed on 2004-02-04. Completion date: 2004-02-27.
Top industries in this zip code by the number of employees in 2005:
Health Care and Social Assistance: Services for the Elderly and Persons with Disabilities (over 1000 employees: 1 establishment, 50-99 employees: 2 establishments, 1-4 employees: 1 establishment)
2007 - 2018 National Fire Incident Reporting System (NFIRS) incidents
According to the data from the years 2007 - 2018 the average number of fire incidents per year is 124. The highest number of reported fires - 146 took place in 2013, and the least - 80 in 2007. The data has an increasing trend.
When looking into fire subcategories, the most reports belonged to: Structure Fires (66.2%), and Outside Fires (21.5%).
Fire incident types reported to NFIRS in Zip Code 11365


 Nearest zip codes: 11366, 11358, 11432, 11355, 11361, 11367.


 (Students: 4,462, Location: 58-20 UTOPIA PKY, Grades: 9-12)

 According to the data from the years 2007 - 2018 the average number of fire incidents per year is 124. The highest number of reported fires - 146 took place in 2013, and the least - 80 in 2007. The data has an increasing trend.
 When looking into fire subcategories, the most reports belonged to: Structure Fires (66.2%), and Outside Fires (21.5%).