Estimated zip code population in 2022: 39,691 Zip code population in 2010: 39,706 Zip code population in 2000: 38,805
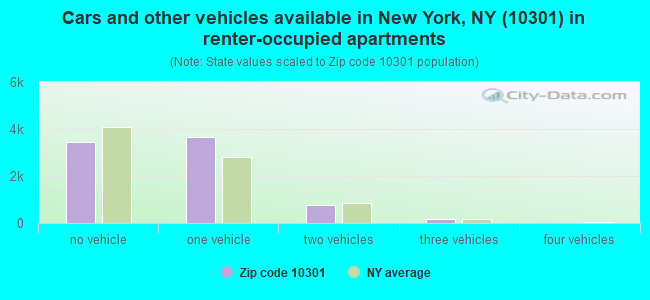
Houses and condos: 16,789 Renter-occupied apartments: 7,973
% of renters here:
54%
State:
46%
March 2022 cost of living index in zip code 10301: 149.1 (very high, U.S. average is 100)
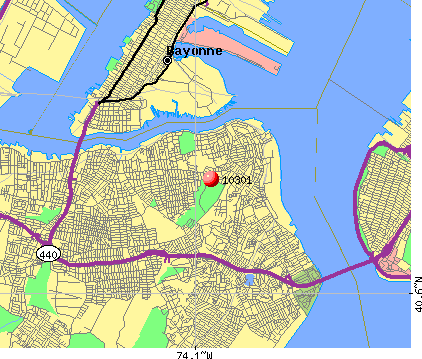
Land area: 3.7 sq. mi. Water area: 0.0 sq. mi.
Population density: 10,817 people per square mile
(high).
OSM Map
General Map
Google Map
MSN Map
OSM Map
General Map
Google Map
MSN Map
OSM Map
General Map
Google Map
MSN Map
OSM Map
General Map
Google Map
MSN Map
Please wait while loading the map...
Real estate property taxes paid for housing units in 2022:
This zip code:
0.8% ($5,514)
New York:
1.5% ($6,180)
Median real estate property taxes paid for housing units with mortgages in 2022: $5,469 (0.8%) Median real estate property taxes paid for housing units with no mortgage in 2022: $5,642 (0.9%)
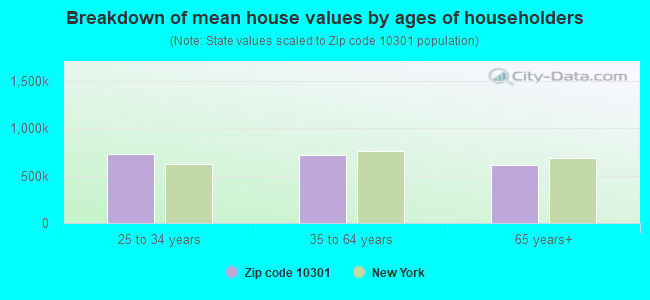
Estimated median house/condo value in 2022: $669,557
10301:
$669,557
New York:
$400,400
According to our research of New York and other state lists, there were 35 registered sex offenders living in 10301 zip code as of April 27, 2024. The ratio of all residents to sex offenders in zip code 10301 is 1,145 to 1. The ratio of registered sex offenders to all residents in this zip code is near the state average.
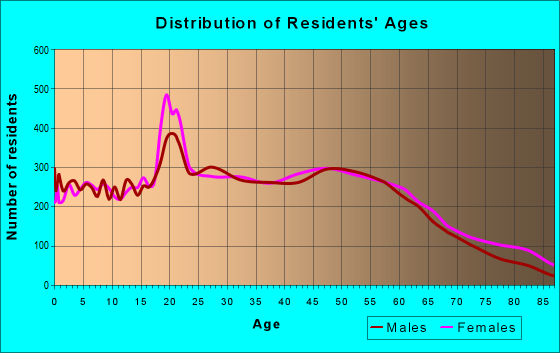
Median resident age:
This zip code:
37.5 years
New York median age:
40.0 years
Average household size:
This zip code:
2.6 people
New York:
2.5 people
Averages for the 2020 tax year for zip code 10301, filed in 2021:
Average Adjusted Gross Income (AGI) in 2020: $74,006 (Individual Income Tax Returns)
Here:
$74,006
State:
$90,930
Salary/wage: $64,341 (reported on 79.9% of returns)
Here:
$64,341
State:
$72,104
(% of AGI for various income ranges: 968.5% for AGIs below $25k, 3480.2% for AGIs $25k-50k, 6728.2% for AGIs $50k-75k, 10022.8% for AGIs $75k-100k, 18523.0% for AGIs $100k-200k, 89131.9% for AGIs over 200k)
Taxable interest for individuals: $1,609 (reported on 28.9% of returns)
This zip code:
$1,609
New York:
$3,075
(% of AGI for various income ranges: 17.3% for AGIs below $25k, 14.1% for AGIs $25k-50k, 30.7% for AGIs $50k-75k, 42.7% for AGIs $75k-100k, 130.9% for AGIs $100k-200k, 1458.7% for AGIs over 200k)
Ordinary dividends: $6,350 (reported on 17.4% of returns)
Here:
$6,350
State:
$11,095
(% of AGI for various income ranges: 21.5% for AGIs below $25k, 27.9% for AGIs $25k-50k, 51.1% for AGIs $50k-75k, 108.8% for AGIs $75k-100k, 305.5% for AGIs $100k-200k, 3932.3% for AGIs over 200k)
Net capital gain/loss in AGI: +$25,866 (reported on 16.2% of returns)
Here:
+$25,866
State:
+$44,925
(% of AGI for various income ranges: 5.7% for AGIs below $25k, 25.8% for AGIs $25k-50k, 69.7% for AGIs $50k-75k, 139.7% for AGIs $75k-100k, 550.6% for AGIs $100k-200k, 21611.0% for AGIs over 200k)
Profit/loss from business: +$14,673 (reported on 16.8% of returns)
Here:
+$14,673
State:
+$14,940
(% of AGI for various income ranges: 215.3% for AGIs below $25k, 103.9% for AGIs $25k-50k, 71.7% for AGIs $50k-75k, 154.3% for AGIs $75k-100k, 427.7% for AGIs $100k-200k, 7874.5% for AGIs over 200k)
Taxable individual retirement arrangement distribution: $19,850 (reported on 5.6% of returns)
10301:
$19,850
New York:
$19,609
(% of AGI for various income ranges: 26.3% for AGIs below $25k, 50.6% for AGIs $25k-50k, 124.4% for AGIs $50k-75k, 168.7% for AGIs $75k-100k, 409.1% for AGIs $100k-200k, 2422.3% for AGIs over 200k)
Self-employed (Keogh) retirement plans: $33,850 (reported on 0.5% of returns)
10301:
$33,850
New York:
$32,497
(% of AGI for various income ranges: 28.9% for AGIs $100k-200k, 953.9% for AGIs over 200k)
Total itemized deductions: $28,100 (reported on 13.0% of returns)
Here:
$28,100
State:
$39,326
(% of AGI for various income ranges: 44.7% for AGIs below $25k, 131.6% for AGIs $25k-50k, 372.1% for AGIs $50k-75k, 814.0% for AGIs $75k-100k, 1587.7% for AGIs $100k-200k, 6979.7% for AGIs over 200k)
Charity contributions: $5,981 (reported on 11.1% of returns)
Here:
$5,981
State:
$15,420
(% of AGI for various income ranges: 4.5% for AGIs below $25k, 12.8% for AGIs $25k-50k, 50.9% for AGIs $50k-75k, 115.2% for AGIs $75k-100k, 262.4% for AGIs $100k-200k, 1826.8% for AGIs over 200k)
Taxes paid: $8,888 (reported on 12.9% of returns)
10301:
$8,888
State:
$9,183
(% of AGI for various income ranges: 11.2% for AGIs below $25k, 32.8% for AGIs $25k-50k, 131.9% for AGIs $50k-75k, 307.1% for AGIs $75k-100k, 572.6% for AGIs $100k-200k, 1696.5% for AGIs over 200k)
Earned income credit: $2,275 (reported on 16.5% of returns)
Here:
$2,275
State:
$2,138
(% of AGI for various income ranges: 113.8% for AGIs below $25k, 67.3% for AGIs $25k-50k)
Percentage of individuals using paid preparers for their 2020 taxes: 94.0%
Here:
94%
State:
95%
(% for various income ranges: 91.5% for AGIs below $25k, 95.5% for AGIs $25k-50k, 96.1% for AGIs $50k-75k, 93.9% for AGIs $75k-100k, 94.1% for AGIs $100k-200k, 96.1% for AGIs over 200k)
Averages for the 2012 tax year for zip code 10301, filed in 2013:
Average Adjusted Gross Income (AGI) in 2012: $63,214 (Individual Income Tax Returns)
Here:
$63,214
State:
$77,088
Salary/wage: $56,554 (reported on 81.8% of returns)
Here:
$56,554
State:
$60,593
(% of AGI for various income ranges: 66.5% for AGIs below $25k, 84.3% for AGIs $25k-50k, 81.4% for AGIs $50k-75k, 78.9% for AGIs $75k-100k, 76.5% for AGIs $100k-200k, 59.8% for AGIs over 200k)
Taxable interest for individuals: $1,753 (reported on 33.8% of returns)
This zip code:
$1,753
New York:
$3,125
(% of AGI for various income ranges: 1.0% for AGIs below $25k, 0.5% for AGIs $25k-50k, 0.6% for AGIs $50k-75k, 0.6% for AGIs $75k-100k, 0.7% for AGIs $100k-200k, 1.7% for AGIs over 200k)
Ordinary dividends: $5,536 (reported on 18.7% of returns)
Here:
$5,536
State:
$10,299
(% of AGI for various income ranges: 1.5% for AGIs below $25k, 0.7% for AGIs $25k-50k, 0.8% for AGIs $50k-75k, 1.1% for AGIs $75k-100k, 1.4% for AGIs $100k-200k, 3.0% for AGIs over 200k)
Net capital gain/loss in AGI: +$8,904 (reported on 12.7% of returns)
Here:
+$8,904
State:
+$42,474
(% of AGI for various income ranges: 0.2% for AGIs $50k-75k, 0.1% for AGIs $75k-100k, 0.4% for AGIs $100k-200k, 6.0% for AGIs over 200k)
Profit/loss from business: +$14,347 (reported on 17.0% of returns)
Here:
+$14,347
State:
+$16,168
(% of AGI for various income ranges: 16.7% for AGIs below $25k, 2.5% for AGIs $25k-50k, 1.4% for AGIs $50k-75k, 1.8% for AGIs $75k-100k, 2.2% for AGIs $100k-200k, 5.0% for AGIs over 200k)
Taxable individual retirement arrangement distribution: $19,690 (reported on 6.7% of returns)
10301:
$19,690
New York:
$17,621
(% of AGI for various income ranges: 1.6% for AGIs below $25k, 1.1% for AGIs $25k-50k, 1.9% for AGIs $50k-75k, 1.7% for AGIs $75k-100k, 2.2% for AGIs $100k-200k, 2.9% for AGIs over 200k)
Self-employment retirement plans: $23,477 (reported on 0.8% of returns)
10301:
$23,477
New York:
$27,330
(% of AGI for various income ranges: 0.2% for AGIs $25k-50k, 0.2% for AGIs $100k-200k, 0.8% for AGIs over 200k)
Total itemized deductions: $28,207 (24% of AGI, reported on 39.4% of returns)
Here:
$28,207
State:
$34,985
Here:
23.9% of AGI
State:
21.3% of AGI
(% of AGI for various income ranges: 8.5% for AGIs below $25k, 12.3% for AGIs $25k-50k, 17.5% for AGIs $50k-75k, 19.7% for AGIs $75k-100k, 20.5% for AGIs $100k-200k, 18.8% for AGIs over 200k)
Charity contributions: $3,258 (reported on 35.0% of returns)
Here:
$3,258
State:
$5,572
(% of AGI for various income ranges: 0.7% for AGIs below $25k, 1.4% for AGIs $25k-50k, 1.9% for AGIs $50k-75k, 2.3% for AGIs $75k-100k, 2.0% for AGIs $100k-200k, 1.7% for AGIs over 200k)
Taxes paid: $13,566 (reported on 39.2% of returns)
10301:
$13,566
State:
$18,656
(% of AGI for various income ranges: 2.0% for AGIs below $25k, 3.3% for AGIs $25k-50k, 6.3% for AGIs $50k-75k, 8.5% for AGIs $75k-100k, 10.0% for AGIs $100k-200k, 12.1% for AGIs over 200k)
Earned income credit: $2,322 (reported on 19.6% of returns)
Here:
$2,322
State:
$2,230
(% of AGI for various income ranges: 8.7% for AGIs below $25k, 0.9% for AGIs $25k-50k)
Percentage of individuals using paid preparers for their 2012 taxes: 71.0%
Here:
71%
State:
66%
(% for various income ranges: 66.5% for AGIs below $25k, 68.6% for AGIs $25k-50k, 72.2% for AGIs $50k-75k, 76.4% for AGIs $75k-100k, 79.5% for AGIs $100k-200k, 85.3% for AGIs over 200k)
Averages for the 2004 tax year for zip code 10301, filed in 2005:
Average Adjusted Gross Income (AGI) in 2004: $55,557 (Individual Income Tax Returns)
Here:
$55,557
State:
$59,519
Salary/wage: $49,096 (reported on 83.6% of returns)
Here:
$49,096
State:
$50,673
(% of AGI for various income ranges: 146.8% for AGIs below $10k, 75.6% for AGIs $10k-25k, 86.8% for AGIs $25k-50k, 84.5% for AGIs $50k-75k, 80.2% for AGIs $75k-100k, 61.8% for AGIs over 100k)
Taxable interest for individuals: $1,747 (reported on 46.9% of returns)
This zip code:
$1,747
New York:
$2,377
(% of AGI for various income ranges: 9.0% for AGIs below $10k, 1.7% for AGIs $10k-25k, 1.1% for AGIs $25k-50k, 1.0% for AGIs $50k-75k, 1.0% for AGIs $75k-100k, 1.8% for AGIs over 100k)
Taxable dividends: $3,483 (reported on 25.4% of returns)
Here:
$3,483
State:
$5,394
(% of AGI for various income ranges: 6.8% for AGIs below $10k, 1.4% for AGIs $10k-25k, 1.0% for AGIs $25k-50k, 1.0% for AGIs $50k-75k, 1.1% for AGIs $75k-100k, 2.1% for AGIs over 100k)
Net capital gain/loss: +$11,042 (reported on 20.0% of returns)
Here:
+$11,042
State:
+$23,581
(% of AGI for various income ranges: -1.3% for AGIs below $10k, 0.3% for AGIs $10k-25k, 0.1% for AGIs $25k-50k, 0.5% for AGIs $50k-75k, 1.1% for AGIs $75k-100k, 8.1% for AGIs over 100k)
Profit/loss from business: +$15,343 (reported on 14.7% of returns)
Here:
+$15,343
State:
+$13,809
(% of AGI for various income ranges: 33.3% for AGIs below $10k, 6.6% for AGIs $10k-25k, 1.7% for AGIs $25k-50k, 1.1% for AGIs $50k-75k, 2.1% for AGIs $75k-100k, 5.7% for AGIs over 100k)
IRA payment deduction: $3,219 (reported on 2.4% of returns)
10301:
$3,219
New York:
$3,115
(% of AGI for various income ranges: 0.6% for AGIs below $10k, 0.2% for AGIs $10k-25k, 0.2% for AGIs $25k-50k, 0.2% for AGIs $50k-75k, 0.2% for AGIs $75k-100k, 0.1% for AGIs over 100k)
Self-employed pension: $20,062 (reported on 1.1% of returns)
Here:
$20,062
New York:
$19,016
Total itemized deductions: $23,322 (24% of AGI, reported on 44.1% of returns)
Here:
$23,322
State:
$25,864
Here:
24.1% of AGI
State:
21.9% of AGI
(% of AGI for various income ranges: 17.6% for AGIs below $10k, 10.3% for AGIs $10k-25k, 16.4% for AGIs $25k-50k, 20.7% for AGIs $50k-75k, 21.6% for AGIs $75k-100k, 18.8% for AGIs over 100k)
Charity contributions deductions: $3,329 (3% of AGI, reported on 41.1% of returns)
Here:
$3,329
State:
$4,439
Here:
3.3% of AGI
State:
3.6% of AGI
(% of AGI for various income ranges: 1.2% for AGIs below $10k, 1.3% for AGIs $10k-25k, 2.6% for AGIs $25k-50k, 3.0% for AGIs $50k-75k, 2.8% for AGIs $75k-100k, 2.3% for AGIs over 100k)
Total tax: $9,860 (reported on 76.8% of returns)
10301:
$9,860
State:
$11,730
(% of AGI for various income ranges: 6.8% for AGIs below $10k, 4.0% for AGIs $10k-25k, 7.0% for AGIs $25k-50k, 9.8% for AGIs $50k-75k, 11.1% for AGIs $75k-100k, 19.7% for AGIs over 100k)
Earned income credit: $1,716 (reported on 16.0% of returns)
Here:
$1,716
State:
$1,757
Percentage of individuals using paid preparers for their 2004 taxes: 71.3%
Here:
71%
State:
67%
(% for various income ranges: 66.0% for AGIs below $10k, 71.0% for AGIs $10k-25k, 69.4% for AGIs $25k-50k, 72.6% for AGIs $50k-75k, 76.1% for AGIs $75k-100k, 79.8% for AGIs over 100k)
Likely homosexual households (counted as self-reported same-sex unmarried-partner households)
Lesbian couples: 0.7% of all households
Gay men: 0.2% of all households
Household received Food Stamps/SNAP in the past 12 months: 2,963 Household did not receive Food Stamps/SNAP in the past 12 months: 11,824
Women who had a birth in the past 12 months: 694 (395 now married, 303 unmarried) Women who did not have a birth in the past 12 months: 8,878 (3,080 now married, 5,805 unmarried)
Housing units in zip code 10301 with a mortgage: 4,553 (444 second mortgage, 13 home equity loan, 348 both second mortgage and home equity loan) Houses without a mortgage: 109
Median monthly owner costs for units with a mortgage: $2,923 Median monthly owner costs for units without a mortgage: $1,057
Residents with income below the poverty level in 2022:
This zip code:
13.6%
Whole state:
14.3%
Residents with income below 50% of the poverty level in 2022:
This zip code:
5.1%
Whole state:
6.8%
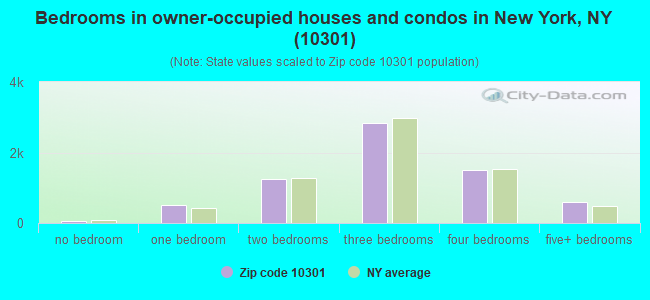
Median number of rooms in houses and condos:
Here:
6.2
State:
6.3
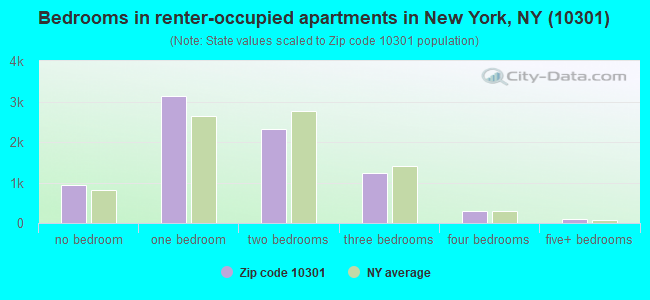
Median number of rooms in apartments:
Here:
3.6
State:
3.8
Notable locations in this zip code not listed on our city pages
Notable locations in zip code 10301: Pershing Circle (A), North Wharf (B), South Wharf (C), Staten Island Hospitality Center (D), Pier 1 (E), Pier 2 (F), Pier 3 (G), Pier 4 (H), Pier 5 (I), Staten Island Ferry Plaza (J), Silver Lake Golf Course (K), Staten Island Borough Hall (L), Richmond County Court House (M), Onehundredtwentieth Precinct Police Station (N), Richmond County Family Courthouse (O), Staten Island Museum (P), Saint George Branch New York Public Library (Q), Snug Harbor Cultural Center (R), Flynn Hall (S), Kelleher Center (T). Display/hide their locations on the map
Churches in zip code 10301 include: Christ Episcopal Church (A), Saint Nicholas Church (B), Knubel Chapel (C), Saint Stanislaus Kostka Roman Catholic Church (D), Saint Peter's Roman Catholic Church (E), Brighton Heights Reformed Church (F), Temple Israel (G), Unitarian Church of Staten Island (H), Bethel Community Church (I). Display/hide their locations on the map
Cemeteries: Saint Peters Cemetery (1), Silver Lake Cemetery (2), Silver Mount Cemetery (3), Woodland Cemetery (4), Sailors Snug Harbor Cemetery (5). Display/hide their locations on the map
Parks in zip code 10301 include: Saint George - New Brighton Historic District (1), Hero Park (2), Nicholas Lia Memorial Park (3), Tompkinsville Square (4), Haven Esplanade (5), Deere Park (6), Terrace Playground (7), Richmond County Bank Ballpark at Saint George (8), Liotti-Ikefugi Playground (9). Display/hide their locations on the map
4,605 married couples with children.
2,261 single-parent households (636 men, 1,625 women).
66.4% of residents of 10301 zip code speak English at home.
15.6% of residents speak Spanish at home (66% very well, 16% well, 17% not well, 2% not at all).
9.4% of residents speak other Indo-European language at home (63% very well, 18% well, 12% not well, 6% not at all).
4.5% of residents speak Asian or Pacific Island language at home (43% very well, 23% well, 23% not well, 11% not at all).
3.8% of residents speak other language at home (83% very well, 7% well, 6% not well, 5% not at all).
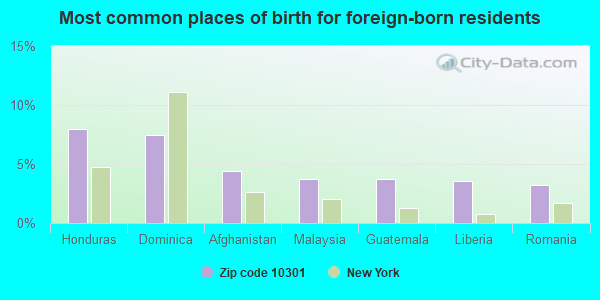
Foreign born population: 8,817 (22.2%) (61.1% of them are naturalized citizens)
This zip code:
22.2%
Whole state:
22.7%
8%Honduras
7%Dominica
4%Afghanistan
4%Malaysia
4%Guatemala
4%Liberia
3%Romania
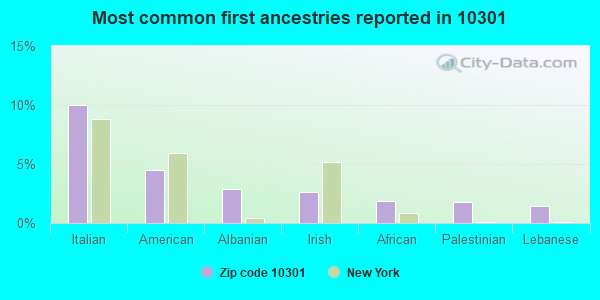
10%Italian
5%American
3%Albanian
3%Irish
2%African
2%Palestinian
1%Lebanese
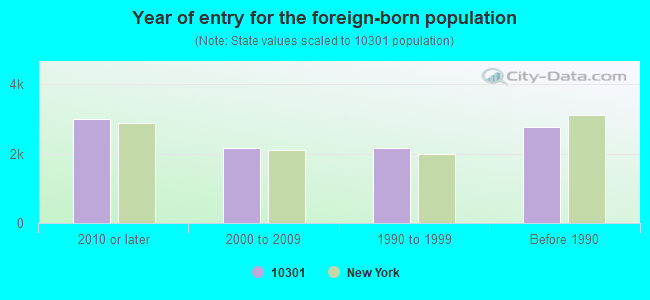
Year of entry for the foreign-born population
3,0082010 or later
2,1742000 to 2009
2,1591990 to 1999
2,770Before 1990
Major facilities with environmental interests located in this zip code:
GETTY-1201 VICTORY BLVD (1201 VICTORY BOULEVARD in STATEN ISLAND, NY)
AIR MINOR (AIRS/AFS) STATE MASTER (New York facility tracking) - AIR PROGRAM (Resource Conservation and Recovery Act (tracking hazardous waste)) Business SIC classification: GASOLINE SERVICE STATIONS Organizations: LEEMILTS PETROLEUM INC (LEGALLY RESPONSIBLE PARTY)
Alternative names: GETTY PETROLEUM CORP
A & B AUTO BODY (65-67 HANNAH ST in STATEN ISLAND, NY)
STATE MASTER (New York facility tracking) - AIR PROGRAM, Small Quantity Generators, between 100 kg and 1000 kg of hazardous waste/month (Resource Conservation and Recovery Act (tracking hazardous waste)) - notification Business SIC classification: TOP, BODY, AND UPHOLSTERY REPAIR SHOPS AND PAINT SHOPS Business NAICS classification: AUTOMOTIVE BODY, PAINT, AND INTERIOR REPAIR AND MAINTENANCE. Organizations: FRANK MAGGIO (CONTACT/OWNER)
80 MONROE AVENUE SCHOOL - P.S. 16 (80 MONROE AVENUE in STATEN ISLAND, NY)
STATE MASTER (New York facility tracking) - AIR PROGRAM Conditionally Exempt Small Quantity Generators, less than 100 kg/month of hazardous waste (Resource Conservation and Recovery Act (tracking hazardous waste)) - notification Business SIC and NAICS classification: ELEMENTARY AND SECONDARY SCHOOLS Organizations: NYC BOARD OF EDUCATION (CONTACT/OWNER)
, NYC DEPT OF EDUCATION (LEGALLY RESPONSIBLE PARTY)
Alternative names: NYC BD OF ED - PUBLIC SCHOOL 16 RICHMOND
IS 61 WILLIAM MORRIS SCHOOL ( in STATEN ISLAND, NY)
(National Center for Education Statistics) - STATE ID-353100010061 Organizations: NEW YORK CITY PUBLIC SCHOOLS (SCHOOL DISTRICT)
101 CASTLETON AVE. - SPECIALIZED INDUSTRIAL SERVICES (101 CASTLETON AVENUE in STATEN ISLAND, NY)
ARTHUR KILL LAND CORP (ARTHUR KILL RD & 1030 ARMSTRONG in STATEN ISLAND, NY)
(Integrated Compliance Information System) - ICIS-02-1988-0195, FORMAL ENFORCEMENT ACTION Business SIC classification: CORRECTIONAL INSTITUTIONS
GETTY PETROLEUM CORP (1212 VICTORY BLVD in STATEN ISLAND, NY)
HAZARDOUS WASTE BIENNIAL REPORTER (Resource Conservation and Recovery Act (tracking hazardous waste)) (Resource Conservation and Recovery Act (tracking hazardous waste)) Alternative names: GETTY PETROLEUM CORPORATION NUMBER 00362
CON EDISION MH 732 (FOREST AVENUE S/O LAKE AVENUE FOREST in STATEN ISLAND, NY)
HAZARDOUS WASTE BIENNIAL REPORTER (Resource Conservation and Recovery Act (tracking hazardous waste)) Large Quantity Generators, more that 1000 kg of hazardous waste/month (Resource Conservation and Recovery Act (tracking hazardous waste)) Business NAICS classification: ELECTRIC POWER DISTRIBUTION.
CON ED - MH 7293 (60 BAY ST in STATEN ISLAND, NY)
HAZARDOUS WASTE BIENNIAL REPORTER (Resource Conservation and Recovery Act (tracking hazardous waste)) (Resource Conservation and Recovery Act (tracking hazardous waste))
CON ED - SILVERLAKE #2 S/S (9 AUSTIN PLACE in STATEN ISLAND, NY)
HAZARDOUS WASTE BIENNIAL REPORTER (Resource Conservation and Recovery Act (tracking hazardous waste)) (Resource Conservation and Recovery Act (tracking hazardous waste))
100 BELMONT PLACE BUILDING (100 BELMONT PLACE in STATEN ISLAND, NY)
AIR MINOR (AIRS/AFS) Business SIC classification: OPERATORS OF APARTMENT BUILDINGS Alternative names: MICHAEL J LAZAROFF
100 STUYVESANT PLACE BUILDING (100 STUYVESANT PL in STATEN ISLAND, NY)
AIR MINOR (AIRS/AFS) Business SIC classification: COIN-OPERATED LAUNDRIES AND DRYCLEANING Alternative names: PAUL MILLER INCORPORATED
730 RICHMOND TERRACE CORP (730 RICHMOND TER in STATEN ISLAND, NY)
(Resource Conservation and Recovery Act (tracking hazardous waste))
Housing units lacking complete plumbing facilities: 2.0% Housing units lacking complete kitchen facilities: 3.5%
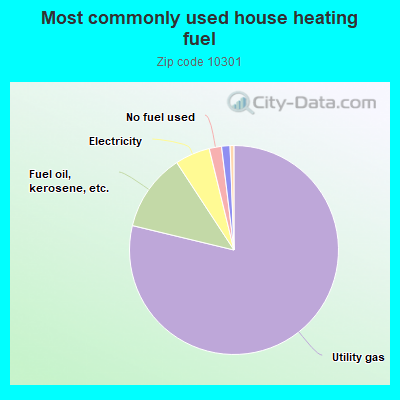
78.6%Utility gas
12.0%Fuel oil, kerosene, etc.
5.4%Electricity
1.9%No fuel used
1.3%Bottled, tank, or LP gas
0.6%Other fuel
Population in 1990: 35,314. Population change in the 1990s: +3,491 (+9.9%).
Place of birth for U.S.-born residents:
This state: 26,147
Northeast: 1,126
Midwest: 497
South: 1,364
West: 420
55% of the 10301 zip code residents lived in the same house 5 years ago. Out of people who lived in different houses, 57% lived in this county. Out of people who lived in different counties, 50% lived in New York.
92% of the 10301 zip code residents lived in the same house 1 year ago. Out of people who lived in different houses, 49% moved from this county. Out of people who lived in different houses, 34% moved from different county within same state. Out of people who lived in different houses, 11% moved from different state. Out of people who lived in different houses, 6% moved from abroad.
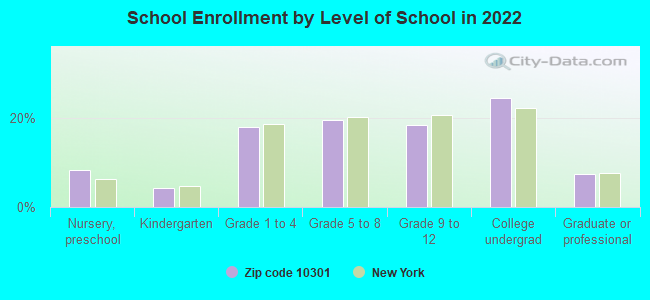
Private vs. public school enrollment:
Students in private schools in grades 1 to 8 (elementary and middle school): 474
Here:
13.4%
New York:
15.6%
Students in private schools in grades 9 to 12 (high school): 459
Here:
26.2%
New York:
15.0%
Students in private undergraduate colleges: 765
Here:
33.1%
New York:
39.2%
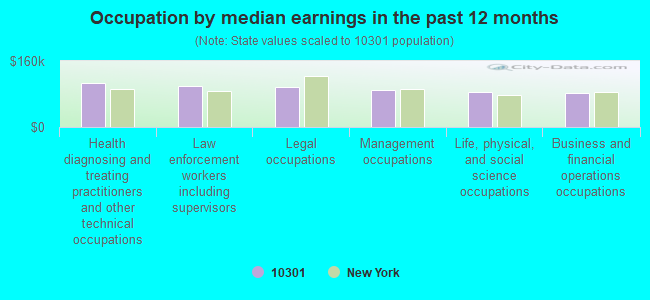
Occupation by median earnings in the past 12 months ($)
105,486Health diagnosing and treating practitioners and other technical occupations
99,695Law enforcement workers including supervisors
95,786Legal occupations
89,980Management occupations
85,400Life, physical, and social science occupations
82,370Business and financial operations occupations
Companies with federal contracts located in this zip code:
DATAWARE SYSTEMS LEASE INC (30 BAY ST STE 3 in STATEN ISLAND, NY; small business) : $683,753 in 59 contractsfrom 2002 to 2006
Contracts for Cable, Cord, and Wire Assemblies: Communications Equipment, Electrical and Electronic assemblies, Boards, Cards, and Associated Hardware, Electrical and Electronic Properties Measuring and Testing Instruments, Refrigeration and Air Conditioning Components, and moreby Defense Logistics Agency Signed by year:2000: $0; 2001: $0; 2002: $66,364; 2003: $93,930; 2004: $134,244; 2005: $359,398; 2006: $29,817.
Biggest contracts:
$65,880 with Defense Logistics Agency for Cable, Cord, and Wire Assemblies: Communications Equipment. Signed on 2003-12-06. Completion date: 2004-02-04.
$50,988 with Defense Logistics Agency for Electrical and Electronic assemblies, Boards, Cards, and Associated Hardware. Signed on 2005-07-28. Completion date: 2005-10-03.
$39,216 with Defense Logistics Agency for Electrical and Electronic Properties Measuring and Testing Instruments. Signed on 2004-05-12. Completion date: 2004-07-02.
$36,000, same as above.Signed on 2005-11-04. Completion date: 2005-12-19.
ZAWADA, ADALBERT (92 DELAFIELD AVE in STATEN ISLAND, NY; small business) : $2,090 in 2 contractsin 2005
$5,928 with Army for Other Education and Training Services. Signed on 2005-05-27. Completion date: 2005-08-01.
-$3,838, same as above.Signed on 2005-09-16. Completion date: 2005-08-01.
WAGNER COLLEGE (ONE CAMPUS ROAD in STATEN ISLAND, NY) : $1,080 in 2 contractsin 2002
$10,800 with Army for Lodging - Hotel/Motel. Taking place in VA. Signed on 2002-04-29. Completion date: 2002-06-08.
-$9,720, same as above.Signed on 2002-06-18. Completion date: 2002-06-08.
Top industries in this zip code by the number of employees in 2005:
Educational Services: Colleges, Universities, and Professional Schools (over 1000 employees: 1 establishment, 250-499 employees: 1 establishment)
Health Care and Social Assistance: Nursing Care Facilities (250-499: 2, 100-249: 1)
Health Care and Social Assistance: Offices of Physicians (except Mental Health Specialists) (250-499: 1, 20-49: 3, 10-19: 11, 5-9: 10, 1-4: 19)
Professional, Scientific, and Technical Services: Research and Development in the Physical, Engineering, and Life Sciences (250-499: 1)
Health Care and Social Assistance: Other Residential Care Facilities (100-249: 2)
Health Care and Social Assistance: Other Individual and Family Services (50-99: 1, 20-49: 4, 10-19: 2, 5-9: 1, 1-4: 3)
Professional, Scientific, and Technical Services: Offices of Lawyers (20-49: 3, 10-19: 1, 5-9: 4, 1-4: 47)
Health Care and Social Assistance: Child Day Care Services (50-99: 1, 20-49: 3, 10-19: 3, 5-9: 1, 1-4: 5)
Accommodation and Food Services: Food Service Contractors (100-249: 1, 20-49: 1, 10-19: 2, 1-4: 2)
Health Care and Social Assistance: Residential Mental Health and Substance Abuse Facilities (50-99: 1, 20-49: 1, 10-19: 4, 1-4: 1)
People in group quarters in 2010:
1,457 people in college/university student housing
658 people in nursing facilities/skilled-nursing facilities
224 people in residential treatment centers for adults
206 people in emergency and transitional shelters (with sleeping facilities) for people experiencing homelessness
108 people in other noninstitutional facilities
61 people in group homes intended for adults
People in group quarters in 2000:
1,048 people in college dormitories (includes college quarters off campus)
992 people in nursing homes
507 people in other noninstitutional group quarters
182 people in other nonhousehold living situations
144 people in homes for the mentally retarded
39 people in homes for the mentally ill
35 people in mental (psychiatric) hospitals or wards
32 people in religious group quarters
18 people in crews of maritime vessels
Fatal accident statistics in 2014:
Fatal accident count: 1
Vehicles involved in fatal accidents: 3
Fatal accidents caused by drunken drivers: 0
Fatalities: 1
Persons involved in fatal accidents: 2
Pedestrians involved in fatal accidents: 0
Fatal accident statistics in 2012:
Fatal accident count: 2
Vehicles involved in fatal accidents: 2
Fatal accidents caused by drunken drivers: 0
Fatalities: 2
Persons involved in fatal accidents: 2
Pedestrians involved in fatal accidents: 1
Home Mortgage Disclosure Act Aggregated Statistics For Year 2009 (Based on 10 full and 22 partial tracts)
A) FHA, FSA/RHS & VA Home Purchase Loans
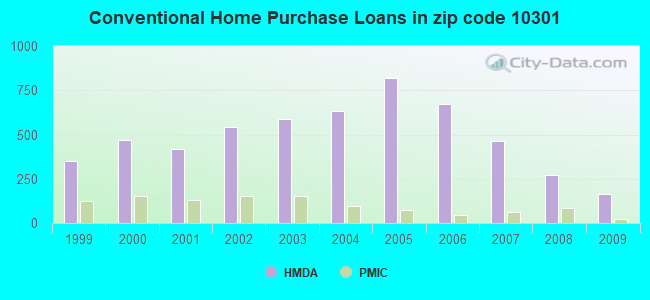
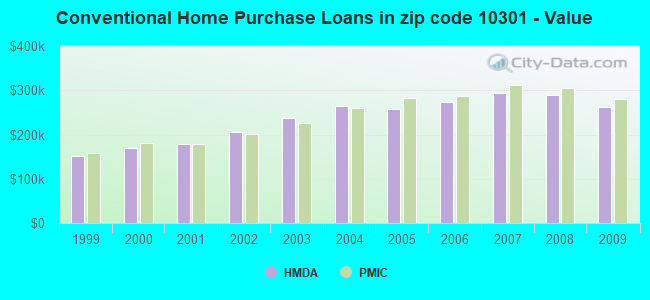
B) Conventional Home Purchase Loans
C) Refinancings
D) Home Improvement Loans
E) Loans on Dwellings For 5+ Families
F) Non-occupant Loans on < 5 Family Dwellings (A B C & D)
G) Loans On Manufactured Home Dwelling (A B C & D)
Number
Average Value
Number
Average Value
Number
Average Value
Number
Average Value
Number
Average Value
Number
Average Value
Number
Average Value
LOANS ORIGINATED
71
$348,100
164
$261,603
323
$286,779
14
$207,504
7
$587,001
23
$231,614
3
$479,343
APPLICATIONS APPROVED, NOT ACCEPTED
5
$321,686
28
$265,329
66
$328,999
3
$371,497
1
$438,000
5
$249,842
0
$0
APPLICATIONS DENIED
23
$334,604
55
$256,559
289
$320,394
26
$167,244
2
$263,190
30
$283,820
0
$0
APPLICATIONS WITHDRAWN
18
$320,783
25
$277,556
128
$308,143
4
$294,528
0
$0
12
$244,332
0
$0
FILES CLOSED FOR INCOMPLETENESS
5
$455,900
9
$256,666
65
$344,948
3
$104,830
0
$0
2
$234,475
0
$0
Aggregated Statistics For Year 2008 (Based on 10 full and 22 partial tracts)
A) FHA, FSA/RHS & VA Home Purchase Loans
B) Conventional Home Purchase Loans
C) Refinancings
D) Home Improvement Loans
E) Loans on Dwellings For 5+ Families
F) Non-occupant Loans on < 5 Family Dwellings (A B C & D)
Number
Average Value
Number
Average Value
Number
Average Value
Number
Average Value
Number
Average Value
Number
Average Value
LOANS ORIGINATED
34
$408,721
270
$289,843
213
$288,207
57
$93,187
4
$4,357,020
41
$299,733
APPLICATIONS APPROVED, NOT ACCEPTED
5
$413,730
61
$315,578
82
$297,458
22
$159,390
1
$270,000
13
$313,596
APPLICATIONS DENIED
14
$356,155
122
$302,704
227
$326,983
70
$118,878
2
$477,820
32
$249,997
APPLICATIONS WITHDRAWN
17
$426,540
50
$260,218
99
$319,682
11
$149,169
1
$325,000
20
$293,974
FILES CLOSED FOR INCOMPLETENESS
1
$514,480
20
$343,290
43
$354,320
3
$312,873
0
$0
5
$357,204
Aggregated Statistics For Year 2007 (Based on 10 full and 22 partial tracts)
A) FHA, FSA/RHS & VA Home Purchase Loans
B) Conventional Home Purchase Loans
C) Refinancings
D) Home Improvement Loans
E) Loans on Dwellings For 5+ Families
F) Non-occupant Loans on < 5 Family Dwellings (A B C & D)
G) Loans On Manufactured Home Dwelling (A B C & D)
Number
Average Value
Number
Average Value
Number
Average Value
Number
Average Value
Number
Average Value
Number
Average Value
Number
Average Value
LOANS ORIGINATED
8
$413,750
464
$293,456
421
$288,101
111
$128,204
4
$1,540,408
89
$292,885
0
$0
APPLICATIONS APPROVED, NOT ACCEPTED
0
$0
100
$285,768
136
$305,897
23
$151,090
0
$0
33
$343,225
0
$0
APPLICATIONS DENIED
2
$534,570
220
$345,005
471
$330,742
129
$85,714
2
$825,000
94
$321,839
2
$48,255
APPLICATIONS WITHDRAWN
4
$371,802
74
$269,357
186
$295,501
23
$187,260
2
$905,485
33
$284,449
0
$0
FILES CLOSED FOR INCOMPLETENESS
0
$0
23
$344,875
67
$287,153
8
$76,796
0
$0
11
$283,553
0
$0
Aggregated Statistics For Year 2006 (Based on 10 full and 22 partial tracts)
A) FHA, FSA/RHS & VA Home Purchase Loans
B) Conventional Home Purchase Loans
C) Refinancings
D) Home Improvement Loans
E) Loans on Dwellings For 5+ Families
F) Non-occupant Loans on < 5 Family Dwellings (A B C & D)
G) Loans On Manufactured Home Dwelling (A B C & D)
Number
Average Value
Number
Average Value
Number
Average Value
Number
Average Value
Number
Average Value
Number
Average Value
Number
Average Value
LOANS ORIGINATED
10
$384,684
670
$274,208
648
$280,982
107
$120,814
13
$1,242,412
105
$289,287
2
$288,750
APPLICATIONS APPROVED, NOT ACCEPTED
1
$649,600
143
$267,849
154
$284,337
35
$104,638
0
$0
23
$306,168
3
$55,413
APPLICATIONS DENIED
1
$453,760
314
$273,809
519
$305,298
120
$122,127
0
$0
92
$323,195
2
$58,840
APPLICATIONS WITHDRAWN
6
$411,725
148
$274,564
320
$303,403
29
$175,156
0
$0
34
$331,746
0
$0
FILES CLOSED FOR INCOMPLETENESS
0
$0
50
$284,414
100
$307,077
11
$156,989
1
$500,000
10
$310,620
1
$425,000
Aggregated Statistics For Year 2005 (Based on 10 full and 22 partial tracts)
A) FHA, FSA/RHS & VA Home Purchase Loans
B) Conventional Home Purchase Loans
C) Refinancings
D) Home Improvement Loans
E) Loans on Dwellings For 5+ Families
F) Non-occupant Loans on < 5 Family Dwellings (A B C & D)
G) Loans On Manufactured Home Dwelling (A B C & D)
Number
Average Value
Number
Average Value
Number
Average Value
Number
Average Value
Number
Average Value
Number
Average Value
Number
Average Value
LOANS ORIGINATED
5
$259,312
819
$256,754
705
$263,120
139
$133,822
15
$1,201,140
146
$260,484
1
$378,000
APPLICATIONS APPROVED, NOT ACCEPTED
1
$239,570
118
$265,553
169
$289,290
34
$88,160
0
$0
21
$281,727
1
$357,000
APPLICATIONS DENIED
2
$374,500
277
$255,083
436
$275,102
128
$109,328
0
$0
77
$258,498
3
$162,463
APPLICATIONS WITHDRAWN
1
$252,000
182
$254,642
408
$263,808
56
$184,347
3
$120,273
54
$251,854
1
$597,430
FILES CLOSED FOR INCOMPLETENESS
1
$320,000
50
$257,242
116
$294,286
8
$71,065
0
$0
11
$280,975
0
$0
Aggregated Statistics For Year 2004 (Based on 10 full and 22 partial tracts)
A) FHA, FSA/RHS & VA Home Purchase Loans
B) Conventional Home Purchase Loans
C) Refinancings
D) Home Improvement Loans
E) Loans on Dwellings For 5+ Families
F) Non-occupant Loans on < 5 Family Dwellings (A B C & D)
G) Loans On Manufactured Home Dwelling (A B C & D)
Number
Average Value
Number
Average Value
Number
Average Value
Number
Average Value
Number
Average Value
Number
Average Value
Number
Average Value
LOANS ORIGINATED
12
$264,020
632
$263,308
755
$237,967
105
$98,978
6
$474,087
130
$239,134
1
$240,120
APPLICATIONS APPROVED, NOT ACCEPTED
3
$239,403
119
$261,655
212
$246,797
24
$117,658
0
$0
40
$247,678
0
$0
APPLICATIONS DENIED
5
$304,172
214
$257,022
441
$255,425
123
$92,900
3
$680,643
81
$261,163
4
$49,002
APPLICATIONS WITHDRAWN
4
$228,630
116
$276,552
377
$233,189
35
$108,803
7
$6,447,626
34
$259,506
0
$0
FILES CLOSED FOR INCOMPLETENESS
0
$0
44
$247,499
103
$234,751
12
$72,704
0
$0
9
$214,584
0
$0
Aggregated Statistics For Year 2003 (Based on 10 full and 22 partial tracts)
A) FHA, FSA/RHS & VA Home Purchase Loans
B) Conventional Home Purchase Loans
C) Refinancings
D) Home Improvement Loans
E) Loans on Dwellings For 5+ Families
F) Non-occupant Loans on < 5 Family Dwellings (A B C & D)
Number
Average Value
Number
Average Value
Number
Average Value
Number
Average Value
Number
Average Value
Number
Average Value
LOANS ORIGINATED
28
$244,215
590
$237,074
1,423
$196,414
51
$44,557
11
$1,211,722
123
$199,376
APPLICATIONS APPROVED, NOT ACCEPTED
1
$154,950
82
$228,802
305
$202,271
26
$67,807
1
$255,150
29
$201,350
APPLICATIONS DENIED
4
$189,110
138
$233,182
458
$208,826
80
$64,738
2
$302,500
61
$223,187
APPLICATIONS WITHDRAWN
9
$273,522
82
$246,863
400
$208,315
31
$63,929
0
$0
30
$180,205
FILES CLOSED FOR INCOMPLETENESS
0
$0
30
$229,610
77
$222,429
2
$52,845
0
$0
5
$200,850
Aggregated Statistics For Year 2002 (Based on 10 full and 24 partial tracts)
A) FHA, FSA/RHS & VA Home Purchase Loans
B) Conventional Home Purchase Loans
C) Refinancings
D) Home Improvement Loans
E) Loans on Dwellings For 5+ Families
F) Non-occupant Loans on < 5 Family Dwellings (A B C & D)
Number
Average Value
Number
Average Value
Number
Average Value
Number
Average Value
Number
Average Value
Number
Average Value
LOANS ORIGINATED
38
$213,330
541
$205,060
915
$185,941
85
$60,318
8
$1,332,861
94
$164,328
APPLICATIONS APPROVED, NOT ACCEPTED
6
$244,992
73
$205,098
207
$180,772
46
$62,572
0
$0
22
$170,893
APPLICATIONS DENIED
6
$231,755
96
$186,846
296
$178,682
88
$41,404
1
$125,400
25
$178,192
APPLICATIONS WITHDRAWN
2
$190,740
70
$209,049
353
$186,755
39
$57,628
4
$382,500
30
$206,922
FILES CLOSED FOR INCOMPLETENESS
1
$312,000
15
$234,793
117
$200,623
8
$23,172
0
$0
6
$173,730
Aggregated Statistics For Year 2001 (Based on 10 full and 22 partial tracts)
A) FHA, FSA/RHS & VA Home Purchase Loans
B) Conventional Home Purchase Loans
C) Refinancings
D) Home Improvement Loans
E) Loans on Dwellings For 5+ Families
F) Non-occupant Loans on < 5 Family Dwellings (A B C & D)
Number
Average Value
Number
Average Value
Number
Average Value
Number
Average Value
Number
Average Value
Number
Average Value
LOANS ORIGINATED
59
$196,994
418
$177,985
552
$162,767
82
$43,914
5
$5,224,216
67
$153,044
APPLICATIONS APPROVED, NOT ACCEPTED
11
$199,734
54
$207,969
160
$155,919
40
$42,272
0
$0
14
$142,069
APPLICATIONS DENIED
15
$184,865
97
$180,101
315
$150,591
130
$47,722
2
$350,840
29
$129,624
APPLICATIONS WITHDRAWN
8
$179,398
55
$154,046
365
$156,736
57
$55,839
1
$362,590
21
$150,511
FILES CLOSED FOR INCOMPLETENESS
2
$218,500
15
$165,233
59
$173,591
9
$42,317
0
$0
0
$0
Aggregated Statistics For Year 2000 (Based on 10 full and 22 partial tracts)
A) FHA, FSA/RHS & VA Home Purchase Loans
B) Conventional Home Purchase Loans
C) Refinancings
D) Home Improvement Loans
E) Loans on Dwellings For 5+ Families
F) Non-occupant Loans on < 5 Family Dwellings (A B C & D)
Number
Average Value
Number
Average Value
Number
Average Value
Number
Average Value
Number
Average Value
Number
Average Value
LOANS ORIGINATED
61
$181,831
469
$170,608
204
$123,781
112
$33,690
8
$525,861
37
$144,755
APPLICATIONS APPROVED, NOT ACCEPTED
9
$189,878
56
$210,603
75
$115,590
65
$37,818
0
$0
3
$145,903
APPLICATIONS DENIED
11
$160,123
82
$160,499
216
$116,048
117
$32,451
1
$80,000
22
$128,662
APPLICATIONS WITHDRAWN
22
$173,141
47
$575,867
264
$101,416
19
$62,018
2
$243,500
15
$120,165
FILES CLOSED FOR INCOMPLETENESS
0
$0
16
$157,807
36
$152,216
5
$41,246
0
$0
1
$148,460
Aggregated Statistics For Year 1999 (Based on 9 full and 12 partial tracts)
A) FHA, FSA/RHS & VA Home Purchase Loans
B) Conventional Home Purchase Loans
C) Refinancings
D) Home Improvement Loans
E) Loans on Dwellings For 5+ Families
F) Non-occupant Loans on < 5 Family Dwellings (A B C & D)
2007 - 2018 National Fire Incident Reporting System (NFIRS) incidents
According to the data from the years 2007 - 2018 the average number of fires per year is 194. The highest number of fire incidents - 233 took place in 2008, and the least - 152 in 2011. The data has a growing trend.
When looking into fire subcategories, the most reports belonged to: Structure Fires (64.7%), and Outside Fires (24.0%).
Fire incident types reported to NFIRS in Zip Code 10301
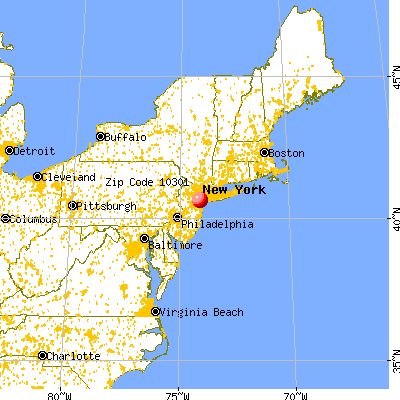


 Nearest zip codes: 10304, 10310, 10305, 07002, 10302, 10306.
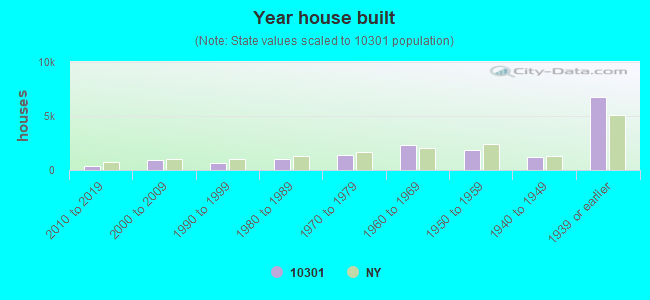


 According to the data from the years 2007 - 2018 the average number of fires per year is 194. The highest number of fire incidents - 233 took place in 2008, and the least - 152 in 2011. The data has a growing trend.
 When looking into fire subcategories, the most reports belonged to: Structure Fires (64.7%), and Outside Fires (24.0%).