Estimated zip code population in 2022: 44,152 Zip code population in 2010: 42,193 Zip code population in 2000: 38,972
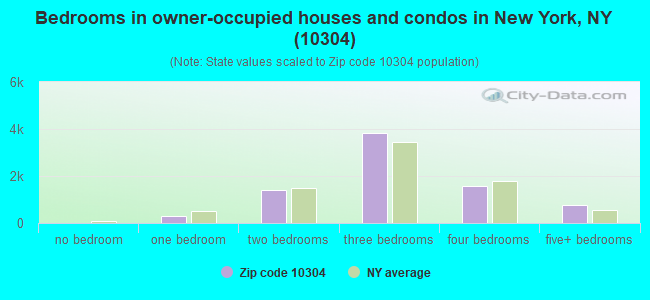
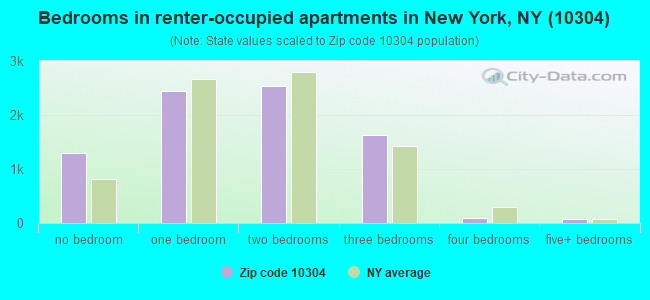
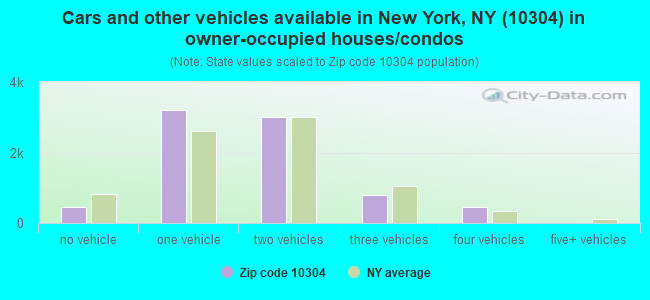
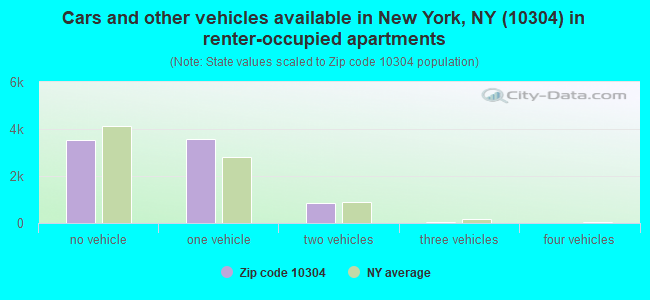
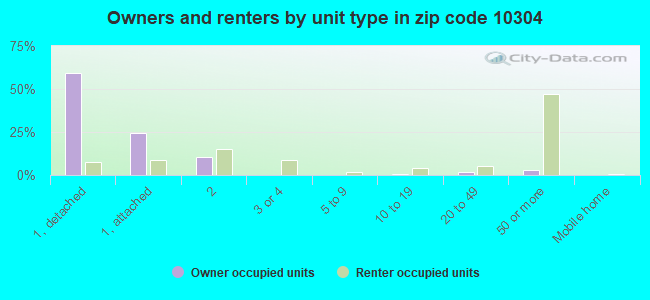
Houses and condos: 17,235 Renter-occupied apartments: 8,006
% of renters here:
50%
State:
46%
March 2022 cost of living index in zip code 10304: 151.0 (very high, U.S. average is 100)
Land area: 3.9 sq. mi. Water area: 0.0 sq. mi.
Population density: 11,395 people per square mile
(high).
OSM Map
General Map
Google Map
MSN Map
OSM Map
General Map
Google Map
MSN Map
OSM Map
General Map
Google Map
MSN Map
OSM Map
General Map
Google Map
MSN Map
Please wait while loading the map...
Real estate property taxes paid for housing units in 2022:
This zip code:
0.8% ($5,683)
New York:
1.5% ($6,180)
Median real estate property taxes paid for housing units with mortgages in 2022: $5,470 (0.8%) Median real estate property taxes paid for housing units with no mortgage in 2022: $6,218 (0.9%)
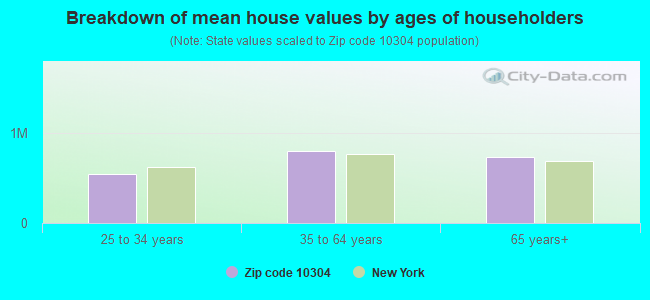
Estimated median house/condo value in 2022: $680,816
10304:
$680,816
New York:
$400,400
According to our research of New York and other state lists, there were 31 registered sex offenders living in 10304 zip code as of April 27, 2024. The ratio of all residents to sex offenders in zip code 10304 is 1,376 to 1. The ratio of registered sex offenders to all residents in this zip code is lower than the state average.
Median resident age:
This zip code:
39.5 years
New York median age:
40.0 years
Average household size:
This zip code:
2.7 people
New York:
2.5 people
Averages for the 2020 tax year for zip code 10304, filed in 2021:
Average Adjusted Gross Income (AGI) in 2020: $70,543 (Individual Income Tax Returns)
Here:
$70,543
State:
$90,930
Salary/wage: $59,558 (reported on 81.0% of returns)
Here:
$59,558
State:
$72,104
(% of AGI for various income ranges: 1019.6% for AGIs below $25k, 3595.3% for AGIs $25k-50k, 6996.6% for AGIs $50k-75k, 10282.0% for AGIs $75k-100k, 18432.9% for AGIs $100k-200k, 111314.1% for AGIs over 200k)
Taxable interest for individuals: $2,248 (reported on 27.1% of returns)
This zip code:
$2,248
New York:
$3,075
(% of AGI for various income ranges: 9.7% for AGIs below $25k, 15.4% for AGIs $25k-50k, 35.3% for AGIs $50k-75k, 88.3% for AGIs $75k-100k, 161.0% for AGIs $100k-200k, 2940.4% for AGIs over 200k)
Ordinary dividends: $6,285 (reported on 15.3% of returns)
Here:
$6,285
State:
$11,095
(% of AGI for various income ranges: 12.7% for AGIs below $25k, 17.3% for AGIs $25k-50k, 44.7% for AGIs $50k-75k, 151.5% for AGIs $75k-100k, 318.7% for AGIs $100k-200k, 4520.0% for AGIs over 200k)
Net capital gain/loss in AGI: +$25,708 (reported on 14.5% of returns)
Here:
+$25,708
State:
+$44,925
(% of AGI for various income ranges: 7.1% for AGIs below $25k, 15.8% for AGIs $25k-50k, 37.8% for AGIs $50k-75k, 140.8% for AGIs $75k-100k, 494.6% for AGIs $100k-200k, 26104.8% for AGIs over 200k)
Profit/loss from business: +$10,423 (reported on 16.6% of returns)
Here:
+$10,423
State:
+$14,940
(% of AGI for various income ranges: 175.0% for AGIs below $25k, 105.2% for AGIs $25k-50k, 114.7% for AGIs $50k-75k, 176.6% for AGIs $75k-100k, 383.8% for AGIs $100k-200k, 4962.2% for AGIs over 200k)
Taxable individual retirement arrangement distribution: $22,063 (reported on 4.5% of returns)
10304:
$22,063
New York:
$19,609
(% of AGI for various income ranges: 19.2% for AGIs below $25k, 33.0% for AGIs $25k-50k, 81.5% for AGIs $50k-75k, 229.7% for AGIs $75k-100k, 471.1% for AGIs $100k-200k, 2969.3% for AGIs over 200k)
Self-employed (Keogh) retirement plans: $28,950 (reported on 0.5% of returns)
10304:
$28,950
New York:
$32,497
(% of AGI for various income ranges: 41.6% for AGIs $100k-200k, 865.9% for AGIs over 200k)
Total itemized deductions: $32,510 (reported on 11.4% of returns)
Here:
$32,510
State:
$39,326
(% of AGI for various income ranges: 50.2% for AGIs below $25k, 129.5% for AGIs $25k-50k, 407.3% for AGIs $50k-75k, 872.9% for AGIs $75k-100k, 1794.7% for AGIs $100k-200k, 10356.7% for AGIs over 200k)
Charity contributions: $8,495 (reported on 9.4% of returns)
Here:
$8,495
State:
$15,420
(% of AGI for various income ranges: 2.2% for AGIs below $25k, 16.0% for AGIs $25k-50k, 58.9% for AGIs $50k-75k, 148.7% for AGIs $75k-100k, 265.9% for AGIs $100k-200k, 3586.7% for AGIs over 200k)
Taxes paid: $8,815 (reported on 11.3% of returns)
10304:
$8,815
State:
$9,183
(% of AGI for various income ranges: 10.3% for AGIs below $25k, 32.8% for AGIs $25k-50k, 128.5% for AGIs $50k-75k, 315.2% for AGIs $75k-100k, 580.5% for AGIs $100k-200k, 1919.6% for AGIs over 200k)
Earned income credit: $2,305 (reported on 21.6% of returns)
Here:
$2,305
State:
$2,138
(% of AGI for various income ranges: 128.6% for AGIs below $25k, 82.7% for AGIs $25k-50k, 1.3% for AGIs $50k-75k)
Percentage of individuals using paid preparers for their 2020 taxes: 95.0%
Here:
95%
State:
95%
(% for various income ranges: 93.8% for AGIs below $25k, 95.9% for AGIs $25k-50k, 95.9% for AGIs $50k-75k, 95.1% for AGIs $75k-100k, 95.9% for AGIs $100k-200k, 95.2% for AGIs over 200k)
Averages for the 2012 tax year for zip code 10304, filed in 2013:
Average Adjusted Gross Income (AGI) in 2012: $62,172 (Individual Income Tax Returns)
Here:
$62,172
State:
$77,088
Salary/wage: $54,058 (reported on 82.1% of returns)
Here:
$54,058
State:
$60,593
(% of AGI for various income ranges: 69.7% for AGIs below $25k, 86.4% for AGIs $25k-50k, 82.5% for AGIs $50k-75k, 78.7% for AGIs $75k-100k, 76.8% for AGIs $100k-200k, 55.9% for AGIs over 200k)
Taxable interest for individuals: $2,042 (reported on 31.6% of returns)
This zip code:
$2,042
New York:
$3,125
(% of AGI for various income ranges: 0.8% for AGIs below $25k, 0.5% for AGIs $25k-50k, 0.5% for AGIs $50k-75k, 0.9% for AGIs $75k-100k, 1.0% for AGIs $100k-200k, 1.6% for AGIs over 200k)
Ordinary dividends: $5,215 (reported on 16.6% of returns)
Here:
$5,215
State:
$10,299
(% of AGI for various income ranges: 1.0% for AGIs below $25k, 0.6% for AGIs $25k-50k, 0.7% for AGIs $50k-75k, 1.0% for AGIs $75k-100k, 1.3% for AGIs $100k-200k, 2.2% for AGIs over 200k)
Net capital gain/loss in AGI: +$17,121 (reported on 12.5% of returns)
Here:
+$17,121
State:
+$42,474
(% of AGI for various income ranges: 0.4% for AGIs $75k-100k, 0.7% for AGIs $100k-200k, 9.7% for AGIs over 200k)
Profit/loss from business: +$17,527 (reported on 17.8% of returns)
Here:
+$17,527
State:
+$16,168
(% of AGI for various income ranges: 17.6% for AGIs below $25k, 2.1% for AGIs $25k-50k, 1.8% for AGIs $50k-75k, 1.9% for AGIs $75k-100k, 2.8% for AGIs $100k-200k, 6.6% for AGIs over 200k)
Taxable individual retirement arrangement distribution: $21,701 (reported on 5.9% of returns)
10304:
$21,701
New York:
$17,621
(% of AGI for various income ranges: 1.4% for AGIs below $25k, 1.1% for AGIs $25k-50k, 1.7% for AGIs $50k-75k, 2.0% for AGIs $75k-100k, 2.3% for AGIs $100k-200k, 2.6% for AGIs over 200k)
Self-employment retirement plans: $26,809 (reported on 0.6% of returns)
10304:
$26,809
New York:
$27,330
(% of AGI for various income ranges: 0.2% for AGIs below $25k, 0.3% for AGIs $100k-200k, 0.5% for AGIs over 200k)
Total itemized deductions: $31,511 (25% of AGI, reported on 36.8% of returns)
Here:
$31,511
State:
$34,985
Here:
24.5% of AGI
State:
21.3% of AGI
(% of AGI for various income ranges: 7.7% for AGIs below $25k, 13.4% for AGIs $25k-50k, 19.8% for AGIs $50k-75k, 22.4% for AGIs $75k-100k, 22.7% for AGIs $100k-200k, 19.1% for AGIs over 200k)
Charity contributions: $3,406 (reported on 31.4% of returns)
Here:
$3,406
State:
$5,572
(% of AGI for various income ranges: 0.5% for AGIs below $25k, 1.5% for AGIs $25k-50k, 2.1% for AGIs $50k-75k, 2.3% for AGIs $75k-100k, 2.1% for AGIs $100k-200k, 1.5% for AGIs over 200k)
Taxes paid: $15,837 (reported on 36.6% of returns)
10304:
$15,837
State:
$18,656
(% of AGI for various income ranges: 2.0% for AGIs below $25k, 3.7% for AGIs $25k-50k, 7.4% for AGIs $50k-75k, 9.0% for AGIs $75k-100k, 10.7% for AGIs $100k-200k, 13.2% for AGIs over 200k)
Earned income credit: $2,469 (reported on 27.4% of returns)
Here:
$2,469
State:
$2,230
(% of AGI for various income ranges: 11.0% for AGIs below $25k, 1.3% for AGIs $25k-50k)
Percentage of individuals using paid preparers for their 2012 taxes: 74.3%
Here:
74%
State:
66%
(% for various income ranges: 71.7% for AGIs below $25k, 73.1% for AGIs $25k-50k, 75.1% for AGIs $50k-75k, 77.6% for AGIs $75k-100k, 79.5% for AGIs $100k-200k, 88.1% for AGIs over 200k)
Averages for the 2004 tax year for zip code 10304, filed in 2005:
Average Adjusted Gross Income (AGI) in 2004: $53,571 (Individual Income Tax Returns)
Here:
$53,571
State:
$59,519
Salary/wage: $46,951 (reported on 84.5% of returns)
Here:
$46,951
State:
$50,673
(% of AGI for various income ranges: 75.4% for AGIs below $10k, 78.5% for AGIs $10k-25k, 89.3% for AGIs $25k-50k, 84.2% for AGIs $50k-75k, 82.3% for AGIs $75k-100k, 62.9% for AGIs over 100k)
Taxable interest for individuals: $2,085 (reported on 43.3% of returns)
This zip code:
$2,085
New York:
$2,377
(% of AGI for various income ranges: 3.6% for AGIs below $10k, 1.8% for AGIs $10k-25k, 0.9% for AGIs $25k-50k, 1.2% for AGIs $50k-75k, 1.1% for AGIs $75k-100k, 2.2% for AGIs over 100k)
Taxable dividends: $4,234 (reported on 22.5% of returns)
Here:
$4,234
State:
$5,394
(% of AGI for various income ranges: 2.9% for AGIs below $10k, 1.0% for AGIs $10k-25k, 0.6% for AGIs $25k-50k, 0.8% for AGIs $50k-75k, 1.2% for AGIs $75k-100k, 2.7% for AGIs over 100k)
Net capital gain/loss: +$16,591 (reported on 17.7% of returns)
Here:
+$16,591
State:
+$23,581
(% of AGI for various income ranges: -2.6% for AGIs below $10k, 0.5% for AGIs $10k-25k, 0.1% for AGIs $25k-50k, 0.3% for AGIs $50k-75k, 0.8% for AGIs $75k-100k, 11.1% for AGIs over 100k)
Profit/loss from business: +$15,344 (reported on 15.2% of returns)
Here:
+$15,344
State:
+$13,809
(% of AGI for various income ranges: 22.7% for AGIs below $10k, 9.0% for AGIs $10k-25k, 1.6% for AGIs $25k-50k, 1.8% for AGIs $50k-75k, 2.2% for AGIs $75k-100k, 5.2% for AGIs over 100k)
IRA payment deduction: $3,366 (reported on 2.4% of returns)
10304:
$3,366
New York:
$3,115
(% of AGI for various income ranges: 0.2% for AGIs below $10k, 0.2% for AGIs $10k-25k, 0.3% for AGIs $25k-50k, 0.1% for AGIs $50k-75k, 0.2% for AGIs $75k-100k, 0.1% for AGIs over 100k)
Self-employed pension: $24,147 (reported on 0.9% of returns)
Here:
$24,147
New York:
$19,016
Total itemized deductions: $25,669 (26% of AGI, reported on 43.0% of returns)
Here:
$25,669
State:
$25,864
Here:
26.2% of AGI
State:
21.9% of AGI
(% of AGI for various income ranges: 9.1% for AGIs below $10k, 10.5% for AGIs $10k-25k, 20.6% for AGIs $25k-50k, 25.3% for AGIs $50k-75k, 24.9% for AGIs $75k-100k, 20.2% for AGIs over 100k)
Charity contributions deductions: $3,403 (3% of AGI, reported on 38.9% of returns)
Here:
$3,403
State:
$4,439
Here:
3.3% of AGI
State:
3.6% of AGI
(% of AGI for various income ranges: 0.4% for AGIs below $10k, 1.1% for AGIs $10k-25k, 2.8% for AGIs $25k-50k, 3.5% for AGIs $50k-75k, 3.1% for AGIs $75k-100k, 2.2% for AGIs over 100k)
Total tax: $9,983 (reported on 69.3% of returns)
10304:
$9,983
State:
$11,730
(% of AGI for various income ranges: 4.2% for AGIs below $10k, 3.4% for AGIs $10k-25k, 5.4% for AGIs $25k-50k, 8.5% for AGIs $50k-75k, 9.9% for AGIs $75k-100k, 19.4% for AGIs over 100k)
Earned income credit: $1,938 (reported on 24.5% of returns)
Here:
$1,938
State:
$1,757
Percentage of individuals using paid preparers for their 2004 taxes: 76.0%
Here:
76%
State:
67%
(% for various income ranges: 72.6% for AGIs below $10k, 77.5% for AGIs $10k-25k, 75.5% for AGIs $25k-50k, 75.2% for AGIs $50k-75k, 75.0% for AGIs $75k-100k, 82.1% for AGIs over 100k)
Likely homosexual households (counted as self-reported same-sex unmarried-partner households)
Lesbian couples: 0.7% of all households
Gay men: 0.1% of all households
Household received Food Stamps/SNAP in the past 12 months: 4,607 Household did not receive Food Stamps/SNAP in the past 12 months: 11,529
Women who had a birth in the past 12 months: 469 (352 now married, 115 unmarried) Women who did not have a birth in the past 12 months: 10,667 (3,589 now married, 7,091 unmarried)
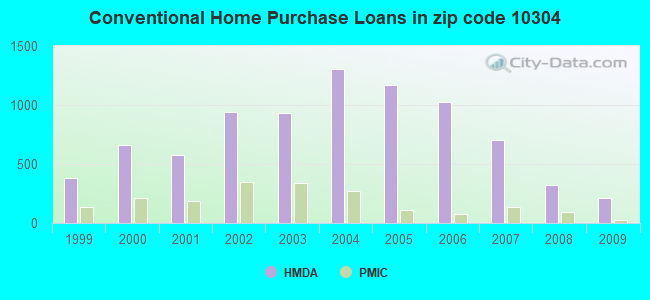
Housing units in zip code 10304 with a mortgage: 4,992 (407 second mortgage, 396 both second mortgage and home equity loan) Houses without a mortgage: 260
Median monthly owner costs for units with a mortgage: $2,783 Median monthly owner costs for units without a mortgage: $1,142
Residents with income below the poverty level in 2022:
This zip code:
17.9%
Whole state:
14.3%
Residents with income below 50% of the poverty level in 2022:
This zip code:
8.2%
Whole state:
6.8%
Median number of rooms in houses and condos:
Here:
6.0
State:
6.3
Median number of rooms in apartments:
Here:
3.7
State:
3.8
Notable locations in this zip code not listed on our city pages
Notable locations in zip code 10304: Consolidated Edison Sub-Station Number 3 (A), Pier 6 (B), Pier 8 (C), Richmond County Country Club (D), Edwin Markham Child Care Center (E), Stapleton Branch New York Public Library (F), Campus Hall (G), Cunard Hall (H), Harborview Hall (I), Parker Hall (J), Fire Department New York Engine 153 Ladder 77 (K), Fire Department New York Engine 159 Satellite 5 (L), Fire Department New York Engine 160 Rescue Company 5 Division 8 (M), New York Rescue Company 5 (N), New York Ladder Company 77 (O), Richmond University Medical Center Bayley Seton Campus (P), New York Satellite Company 5 (Q), George Cromwell Center (R), lStaten Island Childrens Museum (S). Display/hide their locations on the map
Churches in zip code 10304 include: Saint Paul's Memorial Church (A), Saint Simon's Episcopal Church (B), New Dorp Moravian Church (C), First Presbyterian Church (D), Kingdom Hall of Jehovah's Witnesses (E), Vanderbilt Avenue Moravian Church (F), Mount Augustine Apostolic Center (G), Our Lady of Good Counsel Roman Catholic Church (H), Stapleton Union African Methodist Episcopal Church (I). Display/hide their locations on the map
Parks in zip code 10304 include: Tappen Park (1), Tompkinsville Play Center (2), Bedford Green (3), Sobel Court Park (4), Luis R Lopez Playground (5), Maple Woods (6), Naples Playground (7), Reed's Basket Willow Swamp Park (8), Stapleton Playground (9). Display/hide their locations on the map
4,655 married couples with children.
3,066 single-parent households (515 men, 2,551 women).
56.2% of residents of 10304 zip code speak English at home.
14.2% of residents speak Spanish at home (65% very well, 19% well, 14% not well, 2% not at all).
11.8% of residents speak other Indo-European language at home (63% very well, 26% well, 9% not well, 2% not at all).
9.1% of residents speak Asian or Pacific Island language at home (25% very well, 28% well, 36% not well, 11% not at all).
8.8% of residents speak other language at home (84% very well, 12% well, 4% not well).
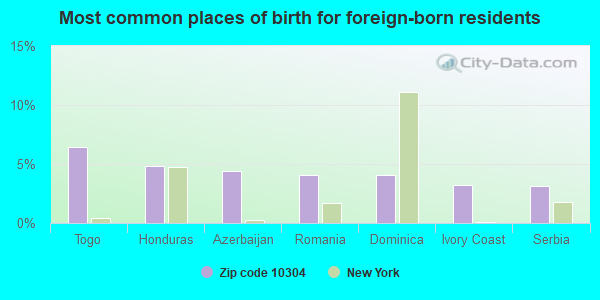
Foreign born population: 14,171 (32.1%) (69.7% of them are naturalized citizens)
This zip code:
32.1%
Whole state:
22.7%
6%Togo
5%Honduras
4%Azerbaijan
4%Romania
4%Dominica
3%Ivory Coast
3%Serbia
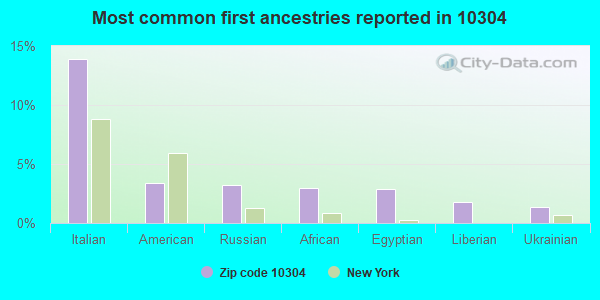
14%Italian
3%American
3%Russian
3%African
3%Egyptian
2%Liberian
1%Ukrainian
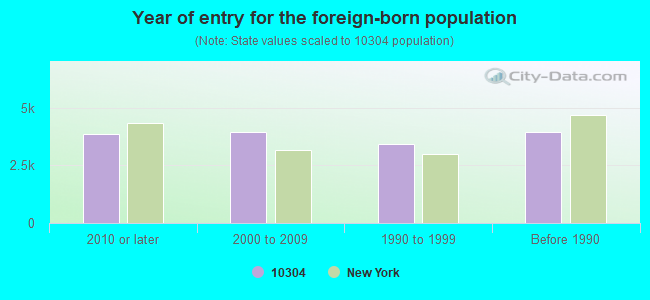
Year of entry for the foreign-born population
3,8672010 or later
3,9542000 to 2009
3,4241990 to 1999
3,942Before 1990
Major facilities with environmental interests located in this zip code:
GROUP HOME ( in STATEN ISLAND, NY)
(National Center for Education Statistics) - STATE ID-353100890003 (National Center for Education Statistics) - STATE ID-353100890114 Organizations: NEW YORK CITY PUBLIC SCHOOLS (SCHOOL DISTRICT)
COMMON DREAMS INC (425 VANDERBILT AVENU in STATEN ISLAND, NY)
AIR MINOR (AIRS/AFS) STATE MASTER (New York facility tracking) - AIR PROGRAM, (Resource Conservation and Recovery Act (tracking hazardous waste)) Business SIC classification: GASOLINE SERVICE STATIONS Organizations: RACKO MANAGEMENT INC (LEGALLY RESPONSIBLE PARTY)
Alternative names: COMMON DREAMS ENTERPRISE
A-JOFIS AUTO BODY (33 WAVE STREET in STATEN ISLAND, NY)
AIR MINOR (AIRS/AFS) STATE MASTER (New York facility tracking) - AIR PROGRAM Business SIC classification: TOP, BODY, AND UPHOLSTERY REPAIR SHOPS AND PAINT SHOPS Business NAICS classification: AUTOMOTIVE BODY, PAINT, AND INTERIOR REPAIR AND MAINTENANCE.
GRANT AUTO BODY (31 WAVE STREET in STATEN ISLAND, NY)
AIR SYNTHETIC MINOR (AIRS/AFS) STATE MASTER (New York facility tracking) - AIR PROGRAM Business SIC classification: TOP, BODY, AND UPHOLSTERY REPAIR SHOPS AND PAINT SHOPS Business NAICS classification: AUTOMOTIVE BODY, PAINT, AND INTERIOR REPAIR AND MAINTENANCE.
IS 49 B. A. DREYFUS IS ( in STATEN ISLAND, NY)
(National Center for Education Statistics) - STATE ID-353100010049 Organizations: NEW YORK CITY PUBLIC SCHOOLS (SCHOOL DISTRICT)
CONCORD ALTERNATIVE HS ( in STATEN ISLAND, NY)
(National Center for Education Statistics) - STATE ID-357700010470 Organizations: NEW YORK CITY PUBLIC SCHOOLS (SCHOOL DISTRICT)
CON EDISON FOX HILLS SUBSTATION (311 VIRGINIA AVENUE in STATEN ISLAND, NY)
HAZARDOUS WASTE BIENNIAL REPORTER (Resource Conservation and Recovery Act (tracking hazardous waste)) Large Quantity Generators, more that 1000 kg of hazardous waste/month (Resource Conservation and Recovery Act (tracking hazardous waste)) Business NAICS classification: ELECTRIC POWER DISTRIBUTION. Organizations: CONSOLIDATED EDISON COMPANY OF NY, INC. (CONTACT/OPERATOR)
Alternative names: CON EDISON - FOX HILLS
HOME DEPOT (545 TARGEE STREET in STATEN ISLAND, NY)
ENFORCEMENT/COMPLIANCE ACTIVITY (Integrated Compliance Information System) COMPLIANCE ACTIVITY (Tracking inspections of insecticide, fungicide, and rodenticide, and toxic substances) Small Quantity Generators, between 100 kg and 1000 kg of hazardous waste/month (Resource Conservation and Recovery Act (tracking hazardous waste)) Organizations: HOME DEPOT USA (CONTACT/OPERATOR)
Alternative names: HOME DEPOT 6150 THE
CON EDISON - MH 20 (PROSPECT ST. S/O SI RAPID TRAN in STATEN ISLAND, NY)
Large Quantity Generators, more that 1000 kg of hazardous waste/month (Resource Conservation and Recovery Act (tracking hazardous waste)) Organizations: CONSOLIDATED EDISON COMPANY OF NY, INC. (CONTACT/OPERATOR)
CON EDISON - MH 29 (SI RAPID TRANSIT RIGHT OF WAY in STATEN ISLAND, NY)
Large Quantity Generators, more that 1000 kg of hazardous waste/month (Resource Conservation and Recovery Act (tracking hazardous waste)) Organizations: CONSOLIDATED EDISON COMPANY OF NY, INC. (CONTACT/OPERATOR)
CON EDISON - MH 413 (CANTERBURY AVE AND VICTORY BLV in STATEN ISLAND, NY)
Large Quantity Generators, more that 1000 kg of hazardous waste/month (Resource Conservation and Recovery Act (tracking hazardous waste)) Organizations: CONSOLIDATED EDISON COMPANY OF NY, INC. (CONTACT/OPERATOR)
CON ED - V 7653 (F/O 135 VANDERBILT AVE in STATEN ISLAND, NY)
HAZARDOUS WASTE BIENNIAL REPORTER (Resource Conservation and Recovery Act (tracking hazardous waste)) (Resource Conservation and Recovery Act (tracking hazardous waste))
CON ED - V 7836 (FATHER CAPADANO BLVD in STATEN ISLAND, NY)
HAZARDOUS WASTE BIENNIAL REPORTER (Resource Conservation and Recovery Act (tracking hazardous waste)) (Resource Conservation and Recovery Act (tracking hazardous waste))
Housing units lacking complete plumbing facilities: 0.9% Housing units lacking complete kitchen facilities: 2.8%
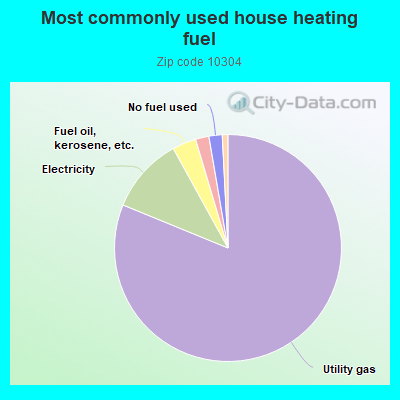
81.2%Utility gas
10.8%Electricity
3.4%Fuel oil, kerosene, etc.
1.9%Bottled, tank, or LP gas
1.9%No fuel used
0.8%Other fuel
Population in 1990: 33,028. Population change in the 1990s: +5,944 (+18.0%).
Place of birth for U.S.-born residents:
This state: 26,092
Northeast: 861
Midwest: 326
South: 1,250
West: 322
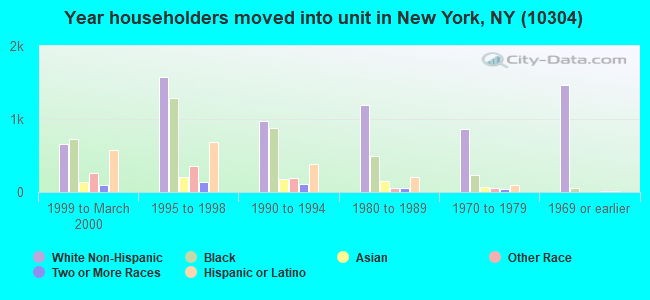
63% of the 10304 zip code residents lived in the same house 5 years ago. Out of people who lived in different houses, 54% lived in this county. Out of people who lived in different counties, 50% lived in New York.
94% of the 10304 zip code residents lived in the same house 1 year ago. Out of people who lived in different houses, 54% moved from this county. Out of people who lived in different houses, 32% moved from different county within same state. Out of people who lived in different houses, 11% moved from different state. Out of people who lived in different houses, 2% moved from abroad.
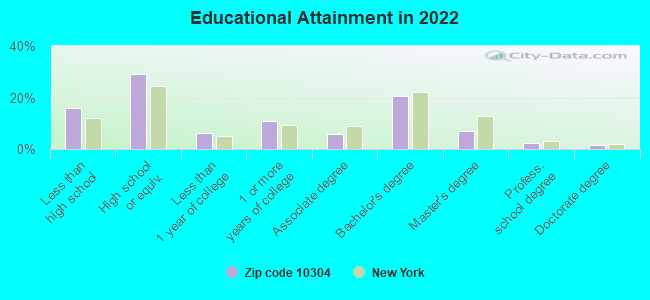
Private vs. public school enrollment:
Students in private schools in grades 1 to 8 (elementary and middle school): 745
Here:
16.0%
New York:
15.6%
Students in private schools in grades 9 to 12 (high school): 579
Here:
23.4%
New York:
15.0%
Students in private undergraduate colleges: 881
Here:
36.9%
New York:
39.2%
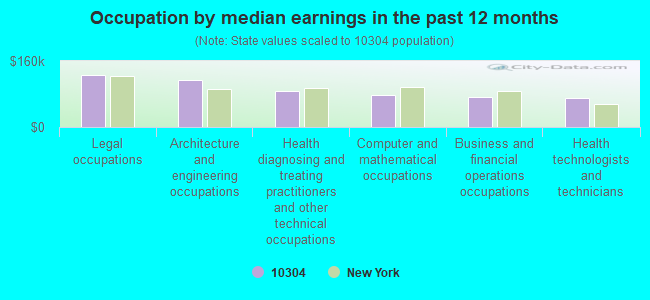
Occupation by median earnings in the past 12 months ($)
126,379Legal occupations
113,828Architecture and engineering occupations
87,071Health diagnosing and treating practitioners and other technical occupations
78,332Computer and mathematical occupations
73,805Business and financial operations occupations
69,502Health technologists and technicians
Companies with federal contracts located in this zip code (STATEN ISLAND, NY):
SISTERS OF CHARITY HEALTH CARE (75 VANDERBILT AVE) : $138,241,931 in 16 contractsfrom 1999 to 2002
Contracts for General Health Care Services, Other Medical Services by Army Signed by year:2000: $44,025,176; 2001: $14,303,730; 2002: $38,957,675; 2003: $0; 2004: $0; 2005: $0; 2006: $0.
Biggest contracts:
$46,045,000 with Army for General Health Care Services. Signed on 2000-10-31. Completion date: 2001-07-31.
$40,955,350, same as above.Signed on 1999-11-02. Completion date: 2000-07-31.
$33,896,502, same as above.Signed on 2002-03-05. Completion date: 2001-07-31.
$8,669,765, same as above.Signed on 2001-07-27. Completion date: 2001-07-31.
SAINT VINCENTS CATHOLIC MEDICA (75 VANDERBILT AVE) : $136,851,125 in 13 contractsfrom 2001 to 2005
Contracts for Medical and Health Studies, General Health Care Services by Army Signed by year:2000: $0; 2001: $9,085,599; 2002: $9,239,545; 2003: $0; 2004: $99,441,238; 2005: $19,084,743; 2006: $0.
Biggest contracts:
$51,656,360 with Army for Medical and Health Studies. Taking place in VA. Signed on 2004-10-15. Completion date: 2005-09-30.
$47,784,878, same as above.Signed on 2004-06-01. Completion date: 2004-09-25.
$28,284,743, same as above.Signed on 2005-06-01. Effective on 2005-05-31. Completion date: 2005-09-30.
$8,935,000 with Army for General Health Care Services. Signed on 2002-07-11. Completion date: 2001-07-31.
GEEWIZ08 COM (36 JACKSON ST; small business) : $25,959 in 4 contractsfrom 2002 to 2005
$9,075 with Army for ADPE System Configuration. Signed on 2004-08-03. Completion date: 2003-08-15.
$8,250, same as above.Signed on 2003-09-30. Completion date: 2003-08-15.
$7,500, same as above.Signed on 2002-08-09. Completion date: 2003-08-15.
$1,134, same as above.Signed on 2005-08-10. Completion date: 2003-08-15.
COAST TO COAST CONTRACTING GRO (110 VANDERBILT AVE; small business) : $15,394 in 2 contractsin 2003
$10,722 with U.S. Army Corps of Engineers - civil program financing only for Maintenance, Repair or Alteration of Real Property -- Ship Construction and Repair Facilities. Taking place in NJ. Signed on 2003-01-14. Completion date: 2003-03-14.
$4,672, same as above.Signed on 2003-02-19. Completion date: 2003-03-14.
-$1,264,321 with Army for General Health Care Services. Signed on 2006-02-28. Completion date: 2006-03-01.
-$5,048,465, same as above.Signed on 2006-02-28. Completion date: 2006-03-01.
Top industries in this zip code by the number of employees in 2005:
Health Care and Social Assistance: Nursing Care Facilities (250-499 employees: 2 establishments, 50-99 employees: 1 establishment)
Health Care and Social Assistance: Offices of Physicians (except Mental Health Specialists) (100-249: 1, 20-49: 5, 10-19: 14, 5-9: 12, 1-4: 27)
2007 - 2018 National Fire Incident Reporting System (NFIRS) incidents
According to the data from the years 2007 - 2018 the average number of fires per year is 203. The highest number of fire incidents - 234 took place in 2008, and the least - 150 in 2007. The data has a growing trend.
When looking into fire subcategories, the most reports belonged to: Structure Fires (66.3%), and Outside Fires (23.1%).
Fire incident types reported to NFIRS in Zip Code 10304

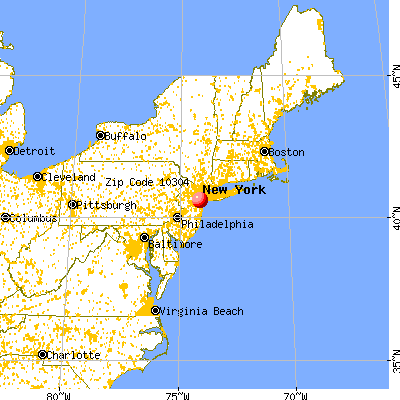


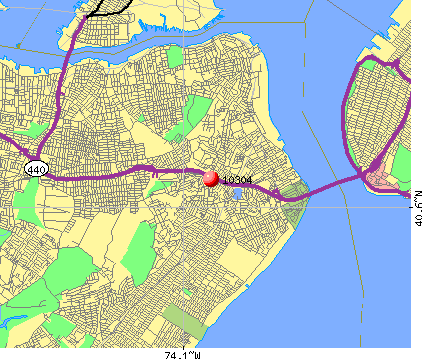 Nearest zip codes: 10301, 10305, 10310, 10302, 10306, 07002.


 According to the data from the years 2007 - 2018 the average number of fires per year is 203. The highest number of fire incidents - 234 took place in 2008, and the least - 150 in 2007. The data has a growing trend.
 When looking into fire subcategories, the most reports belonged to: Structure Fires (66.3%), and Outside Fires (23.1%).