Estimated zip code population in 2022: 91,532 Zip code population in 2010: 99,598 Zip code population in 2000: 92,718
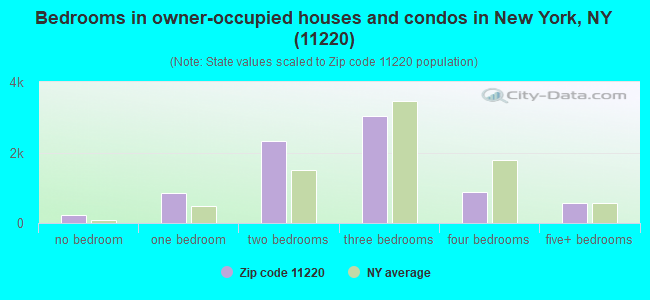
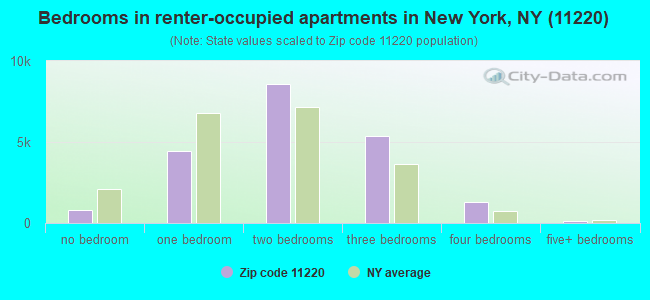
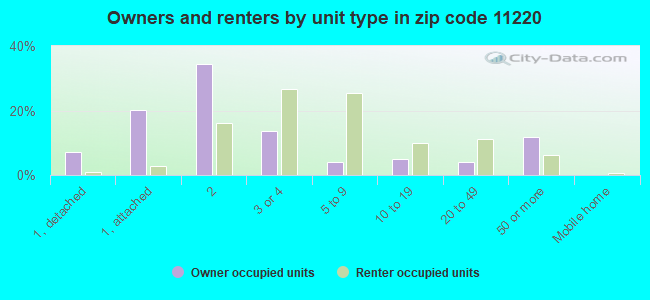
Houses and condos: 30,893 Renter-occupied apartments: 20,766
% of renters here:
73%
State:
46%
March 2022 cost of living index in zip code 11220: 162.1 (very high, U.S. average is 100)
Land area: 1.8 sq. mi. Water area: 0.0 sq. mi.
Population density: 51,098 people per square mile
(very high).
OSM Map
General Map
Google Map
MSN Map
OSM Map
General Map
Google Map
MSN Map
OSM Map
General Map
Google Map
MSN Map
OSM Map
General Map
Google Map
MSN Map
Please wait while loading the map...
Real estate property taxes paid for housing units in 2022:
This zip code:
0.6% ($5,996)
New York:
1.5% ($6,180)
Median real estate property taxes paid for housing units with mortgages in 2022: $5,886 (0.5%) Median real estate property taxes paid for housing units with no mortgage in 2022: $6,060 (0.7%)
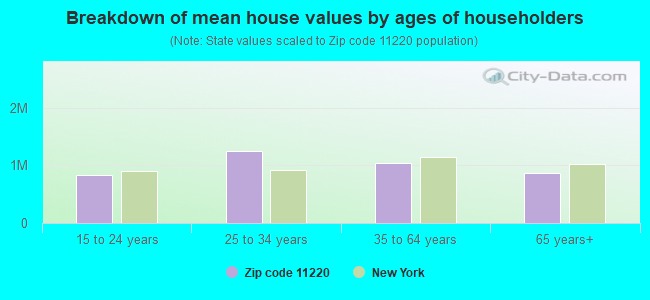
Estimated median house/condo value in 2022: $1,020,337
11220:
$1,020,337
New York:
$400,400
According to our research of New York and other state lists, there were 27 registered sex offenders living in 11220 zip code as of April 27, 2024. The ratio of all residents to sex offenders in zip code 11220 is 3,795 to 1. The ratio of registered sex offenders to all residents in this zip code is much lower than the state average.
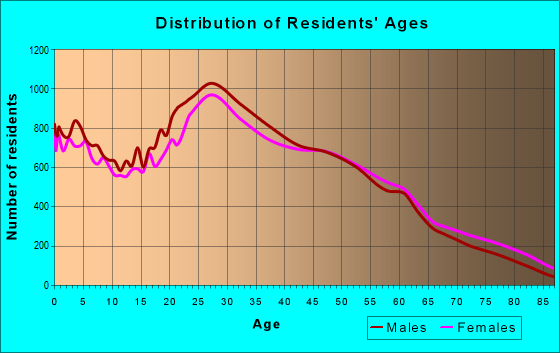
Median resident age:
This zip code:
36.6 years
New York median age:
40.0 years
Average household size:
This zip code:
3.2 people
New York:
2.5 people
Averages for the 2020 tax year for zip code 11220, filed in 2021:
Average Adjusted Gross Income (AGI) in 2020: $32,415 (Individual Income Tax Returns)
Here:
$32,415
State:
$90,930
Salary/wage: $30,285 (reported on 80.0% of returns)
Here:
$30,285
State:
$72,104
(% of AGI for various income ranges: 1214.4% for AGIs below $25k, 3405.6% for AGIs $25k-50k, 7053.0% for AGIs $50k-75k, 11004.9% for AGIs $75k-100k, 19374.8% for AGIs $100k-200k, 67470.6% for AGIs over 200k)
Taxable interest for individuals: $1,004 (reported on 14.2% of returns)
This zip code:
$1,004
New York:
$3,075
(% of AGI for various income ranges: 4.1% for AGIs below $25k, 9.9% for AGIs $25k-50k, 27.1% for AGIs $50k-75k, 59.0% for AGIs $75k-100k, 156.0% for AGIs $100k-200k, 1417.6% for AGIs over 200k)
Ordinary dividends: $2,762 (reported on 7.6% of returns)
Here:
$2,762
State:
$11,095
(% of AGI for various income ranges: 4.1% for AGIs below $25k, 12.3% for AGIs $25k-50k, 52.7% for AGIs $50k-75k, 104.2% for AGIs $75k-100k, 203.1% for AGIs $100k-200k, 2270.6% for AGIs over 200k)
Net capital gain/loss in AGI: +$7,309 (reported on 8.6% of returns)
Here:
+$7,309
State:
+$44,925
(% of AGI for various income ranges: 2.7% for AGIs below $25k, 17.7% for AGIs $25k-50k, 85.7% for AGIs $50k-75k, 144.0% for AGIs $75k-100k, 653.2% for AGIs $100k-200k, 11734.7% for AGIs over 200k)
Profit/loss from business: +$8,202 (reported on 19.7% of returns)
Here:
+$8,202
State:
+$14,940
(% of AGI for various income ranges: 224.7% for AGIs below $25k, 193.0% for AGIs $25k-50k, 178.3% for AGIs $50k-75k, 294.3% for AGIs $75k-100k, 528.8% for AGIs $100k-200k, 2686.5% for AGIs over 200k)
Taxable individual retirement arrangement distribution: $14,616 (reported on 1.5% of returns)
11220:
$14,616
New York:
$19,609
(% of AGI for various income ranges: 6.5% for AGIs below $25k, 15.9% for AGIs $25k-50k, 55.0% for AGIs $50k-75k, 86.4% for AGIs $75k-100k, 335.3% for AGIs $100k-200k, 1388.2% for AGIs over 200k)
Self-employed (Keogh) retirement plans: $19,786 (reported on 0.1% of returns)
11220:
$19,786
New York:
$32,497
(% of AGI for various income ranges: 2.2% for AGIs $25k-50k, 32.3% for AGIs $100k-200k, 452.9% for AGIs over 200k)
Total itemized deductions: $28,524 (reported on 2.3% of returns)
Here:
$28,524
State:
$39,326
(% of AGI for various income ranges: 11.8% for AGIs below $25k, 31.3% for AGIs $25k-50k, 147.4% for AGIs $50k-75k, 334.8% for AGIs $75k-100k, 905.2% for AGIs $100k-200k, 5621.2% for AGIs over 200k)
Charity contributions: $6,905 (reported on 1.6% of returns)
Here:
$6,905
State:
$15,420
(% of AGI for various income ranges: 0.5% for AGIs below $25k, 2.2% for AGIs $25k-50k, 20.2% for AGIs $50k-75k, 41.5% for AGIs $75k-100k, 157.4% for AGIs $100k-200k, 1496.5% for AGIs over 200k)
Taxes paid: $8,302 (reported on 2.2% of returns)
11220:
$8,302
State:
$9,183
(% of AGI for various income ranges: 2.7% for AGIs below $25k, 8.3% for AGIs $25k-50k, 46.1% for AGIs $50k-75k, 117.3% for AGIs $75k-100k, 324.7% for AGIs $100k-200k, 1027.6% for AGIs over 200k)
Earned income credit: $2,110 (reported on 37.9% of returns)
Here:
$2,110
State:
$2,138
(% of AGI for various income ranges: 136.9% for AGIs below $25k, 140.0% for AGIs $25k-50k, 1.6% for AGIs $50k-75k)
Percentage of individuals using paid preparers for their 2020 taxes: 93.3%
Here:
93%
State:
95%
(% for various income ranges: 91.8% for AGIs below $25k, 95.5% for AGIs $25k-50k, 95.4% for AGIs $50k-75k, 94.2% for AGIs $75k-100k, 95.4% for AGIs $100k-200k, 98.0% for AGIs over 200k)
Averages for the 2012 tax year for zip code 11220, filed in 2013:
Average Adjusted Gross Income (AGI) in 2012: $25,773 (Individual Income Tax Returns)
Here:
$25,773
State:
$77,088
Salary/wage: $26,577 (reported on 78.0% of returns)
Here:
$26,577
State:
$60,593
(% of AGI for various income ranges: 74.4% for AGIs below $25k, 88.5% for AGIs $25k-50k, 87.6% for AGIs $50k-75k, 86.8% for AGIs $75k-100k, 83.4% for AGIs $100k-200k, 53.2% for AGIs over 200k)
Taxable interest for individuals: $679 (reported on 15.7% of returns)
This zip code:
$679
New York:
$3,125
(% of AGI for various income ranges: 0.2% for AGIs below $25k, 0.3% for AGIs $25k-50k, 0.5% for AGIs $50k-75k, 0.7% for AGIs $75k-100k, 0.5% for AGIs $100k-200k, 0.7% for AGIs over 200k)
Ordinary dividends: $2,088 (reported on 6.4% of returns)
Here:
$2,088
State:
$10,299
(% of AGI for various income ranges: 0.3% for AGIs below $25k, 0.3% for AGIs $25k-50k, 0.6% for AGIs $50k-75k, 0.8% for AGIs $75k-100k, 1.0% for AGIs $100k-200k, 0.7% for AGIs over 200k)
Net capital gain/loss in AGI: +$3,640 (reported on 5.0% of returns)
Here:
+$3,640
State:
+$42,474
(% of AGI for various income ranges: 0.2% for AGIs $50k-75k, 0.6% for AGIs $75k-100k, 0.9% for AGIs $100k-200k, 7.6% for AGIs over 200k)
Profit/loss from business: +$9,092 (reported on 24.4% of returns)
Here:
+$9,092
State:
+$16,168
(% of AGI for various income ranges: 20.7% for AGIs below $25k, 4.1% for AGIs $25k-50k, 1.9% for AGIs $50k-75k, 2.1% for AGIs $75k-100k, 2.1% for AGIs $100k-200k, 3.5% for AGIs over 200k)
Taxable individual retirement arrangement distribution: $10,697 (reported on 2.0% of returns)
11220:
$10,697
New York:
$17,621
(% of AGI for various income ranges: 0.5% for AGIs below $25k, 0.7% for AGIs $25k-50k, 1.0% for AGIs $50k-75k, 1.3% for AGIs $75k-100k, 1.4% for AGIs $100k-200k, 0.5% for AGIs over 200k)
Self-employment retirement plans: $11,857 (reported on 0.1% of returns)
11220:
$11,857
New York:
$27,330
Total itemized deductions: $20,169 (24% of AGI, reported on 10.6% of returns)
Here:
$20,169
State:
$34,985
Here:
23.7% of AGI
State:
21.3% of AGI
(% of AGI for various income ranges: 1.9% for AGIs below $25k, 5.7% for AGIs $25k-50k, 9.9% for AGIs $50k-75k, 14.9% for AGIs $75k-100k, 16.6% for AGIs $100k-200k, 17.9% for AGIs over 200k)
Charity contributions: $2,744 (reported on 8.2% of returns)
Here:
$2,744
State:
$5,572
(% of AGI for various income ranges: 0.6% for AGIs $25k-50k, 1.3% for AGIs $50k-75k, 1.5% for AGIs $75k-100k, 1.7% for AGIs $100k-200k, 2.0% for AGIs over 200k)
Taxes paid: $9,137 (reported on 10.6% of returns)
11220:
$9,137
State:
$18,656
(% of AGI for various income ranges: 0.4% for AGIs below $25k, 1.6% for AGIs $25k-50k, 4.1% for AGIs $50k-75k, 6.9% for AGIs $75k-100k, 8.9% for AGIs $100k-200k, 11.0% for AGIs over 200k)
Earned income credit: $2,194 (reported on 44.5% of returns)
Here:
$2,194
State:
$2,230
(% of AGI for various income ranges: 10.7% for AGIs below $25k, 1.5% for AGIs $25k-50k)
Percentage of individuals using paid preparers for their 2012 taxes: 75.7%
Here:
76%
State:
66%
(% for various income ranges: 77.0% for AGIs below $25k, 73.4% for AGIs $25k-50k, 70.6% for AGIs $50k-75k, 70.5% for AGIs $75k-100k, 73.7% for AGIs $100k-200k, 75.0% for AGIs over 200k)
Averages for the 2004 tax year for zip code 11220, filed in 2005:
Average Adjusted Gross Income (AGI) in 2004: $25,012 (Individual Income Tax Returns)
Here:
$25,012
State:
$59,519
Salary/wage: $26,728 (reported on 79.5% of returns)
Here:
$26,728
State:
$50,673
(% of AGI for various income ranges: 71.5% for AGIs below $10k, 79.9% for AGIs $10k-25k, 91.4% for AGIs $25k-50k, 88.3% for AGIs $50k-75k, 88.1% for AGIs $75k-100k, 78.5% for AGIs over 100k)
Taxable interest for individuals: $722 (reported on 37.5% of returns)
This zip code:
$722
New York:
$2,377
(% of AGI for various income ranges: 2.3% for AGIs below $10k, 1.0% for AGIs $10k-25k, 0.8% for AGIs $25k-50k, 1.1% for AGIs $50k-75k, 1.0% for AGIs $75k-100k, 1.4% for AGIs over 100k)
Taxable dividends: $1,348 (reported on 10.8% of returns)
Here:
$1,348
State:
$5,394
(% of AGI for various income ranges: 0.7% for AGIs below $10k, 0.4% for AGIs $10k-25k, 0.4% for AGIs $25k-50k, 0.7% for AGIs $50k-75k, 0.7% for AGIs $75k-100k, 1.0% for AGIs over 100k)
Net capital gain/loss: +$2,602 (reported on 8.1% of returns)
Here:
+$2,602
State:
+$23,581
(% of AGI for various income ranges: -0.4% for AGIs below $10k, -0.1% for AGIs $10k-25k, -0.2% for AGIs $25k-50k, 0.6% for AGIs $50k-75k, 0.8% for AGIs $75k-100k, 4.9% for AGIs over 100k)
Profit/loss from business: +$7,312 (reported on 21.8% of returns)
Here:
+$7,312
State:
+$13,809
(% of AGI for various income ranges: 33.9% for AGIs below $10k, 12.9% for AGIs $10k-25k, 2.4% for AGIs $25k-50k, 1.3% for AGIs $50k-75k, 1.4% for AGIs $75k-100k, 2.9% for AGIs over 100k)
IRA payment deduction: $3,134 (reported on 2.0% of returns)
11220:
$3,134
New York:
$3,115
(% of AGI for various income ranges: 0.1% for AGIs below $10k, 0.2% for AGIs $10k-25k, 0.4% for AGIs $25k-50k, 0.2% for AGIs $50k-75k, 0.2% for AGIs $75k-100k, 0.1% for AGIs over 100k)
Self-employed pension: $12,817 (reported on 0.2% of returns)
Here:
$12,817
New York:
$19,016
Total itemized deductions: $16,028 (27% of AGI, reported on 18.0% of returns)
Here:
$16,028
State:
$25,864
Here:
26.6% of AGI
State:
21.9% of AGI
(% of AGI for various income ranges: 3.1% for AGIs below $10k, 4.7% for AGIs $10k-25k, 11.6% for AGIs $25k-50k, 15.0% for AGIs $50k-75k, 16.7% for AGIs $75k-100k, 17.5% for AGIs over 100k)
Charity contributions deductions: $2,672 (4% of AGI, reported on 15.7% of returns)
Here:
$2,672
State:
$4,439
Here:
4.2% of AGI
State:
3.6% of AGI
(% of AGI for various income ranges: 0.1% for AGIs below $10k, 0.5% for AGIs $10k-25k, 1.8% for AGIs $25k-50k, 2.3% for AGIs $50k-75k, 2.4% for AGIs $75k-100k, 2.6% for AGIs over 100k)
Total tax: $3,249 (reported on 63.8% of returns)
11220:
$3,249
State:
$11,730
(% of AGI for various income ranges: 6.0% for AGIs below $10k, 3.9% for AGIs $10k-25k, 6.2% for AGIs $25k-50k, 9.6% for AGIs $50k-75k, 11.4% for AGIs $75k-100k, 16.3% for AGIs over 100k)
Earned income credit: $1,899 (reported on 38.8% of returns)
Here:
$1,899
State:
$1,757
Percentage of individuals using paid preparers for their 2004 taxes: 74.3%
Here:
74%
State:
67%
(% for various income ranges: 72.2% for AGIs below $10k, 77.8% for AGIs $10k-25k, 72.6% for AGIs $25k-50k, 72.5% for AGIs $50k-75k, 71.9% for AGIs $75k-100k, 75.3% for AGIs over 100k)
Likely homosexual households (counted as self-reported same-sex unmarried-partner households)
Lesbian couples: 0.2% of all households
Gay men: 0.1% of all households
Household received Food Stamps/SNAP in the past 12 months: 8,238 Household did not receive Food Stamps/SNAP in the past 12 months: 20,713
Women who had a birth in the past 12 months: 900 (765 now married, 128 unmarried) Women who did not have a birth in the past 12 months: 21,246 (9,250 now married, 11,921 unmarried)
Housing units in zip code 11220 with a mortgage: 3,208 (322 second mortgage, 45 home equity loan, 253 both second mortgage and home equity loan) Houses without a mortgage: 62
Median monthly owner costs for units with a mortgage: $3,222 Median monthly owner costs for units without a mortgage: $932
Residents with income below the poverty level in 2022:
This zip code:
22.7%
Whole state:
14.3%
Residents with income below 50% of the poverty level in 2022:
This zip code:
14.4%
Whole state:
6.8%
Median number of rooms in houses and condos:
Here:
4.8
State:
6.3
Median number of rooms in apartments:
Here:
3.9
State:
3.8
Notable locations in this zip code not listed on our city pages
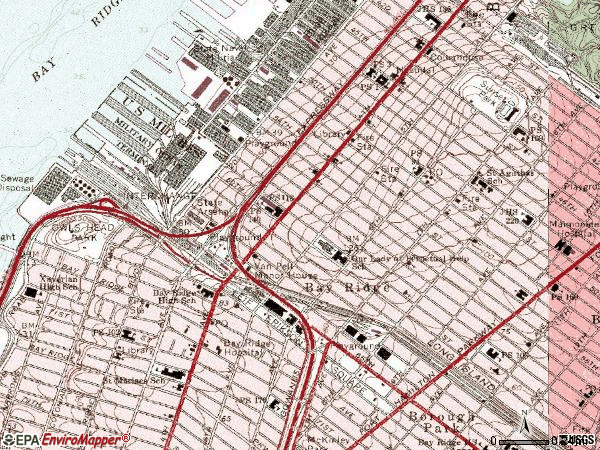
Notable locations in zip code 11220: Owl's Head Water Pollution Control Plant (A), Sixtyfifth Street Railyard (B), Pier 4 (C), Pier 3 (D), Pier 2 (E), Van Pelt Manor House (F), Sunset Park Branch Brooklyn Public Library (G), Fire Department New York Engine 201 Battalion 40 (H), Alpine Theater (I), Fire Department New York Engine 241 Ladder 109 (J), New York Ladder Company 109 (K), Fire Department New York City Ladder Company 114 (L), Bay Ridge Masonic Temple (M). Display/hide their locations on the map
Churches in zip code 11220 include: Alahambra Church (A), Congregation Bnai Israel (B), Saint Agatha's Church (C), Jehovah's Witnesses of Sunset Park (D), Trinity Lutheran Church (E), Fourth Avenue Methodist Church (F), Pentecostal Assembly Church (G), Jerusalem Christian Church (H), Spanish Bay Ridge Seventh Day Adventist Church (I). Display/hide their locations on the map
Parks in zip code 11220 include: Owls Head Park (1), Leif Ericson Park And Square (2), Payne Park (3), Dustbowl (4), Rainbow Playground (5), Martin Luther Playground (6), Public School 1 Playground (7). Display/hide their locations on the map
12,824 married couples with children.
5,775 single-parent households (2,011 men, 3,764 women).
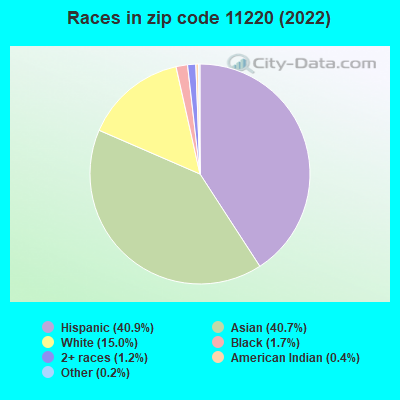
18.8% of residents of 11220 zip code speak English at home.
37.5% of residents speak Spanish at home (28% very well, 24% well, 26% not well, 22% not at all).
4.9% of residents speak other Indo-European language at home (45% very well, 32% well, 19% not well, 4% not at all).
37.5% of residents speak Asian or Pacific Island language at home (18% very well, 24% well, 45% not well, 13% not at all).
3.0% of residents speak other language at home (49% very well, 24% well, 23% not well, 4% not at all).
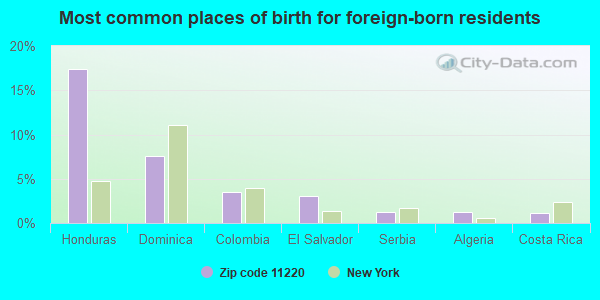
Foreign born population: 48,193 (52.7%) (41.5% of them are naturalized citizens)
This zip code:
52.7%
Whole state:
22.7%
17%Honduras
8%Dominica
3%Colombia
3%El Salvador
1%Serbia
1%Algeria
1%Costa Rica
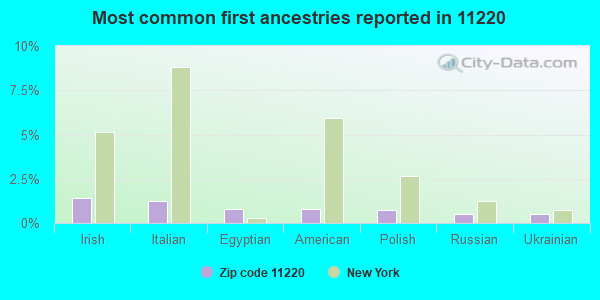
1%Irish
1%Italian
1%Egyptian
1%American
1%Polish
1%Russian
1%Ukrainian
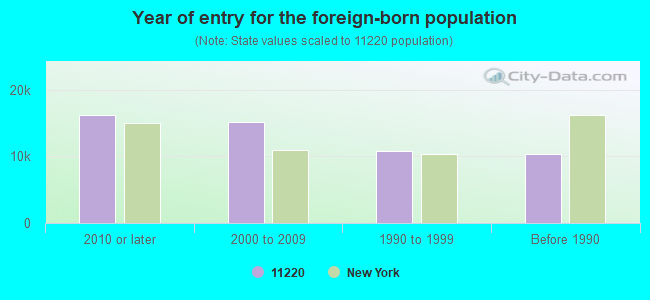
Year of entry for the foreign-born population
16,2122010 or later
15,1002000 to 2009
10,7981990 to 1999
10,422Before 1990
Major facilities with environmental interests located in this zip code:
AMOCO-54930096005 (802 65TH STREET in BROOKLYN, NY)
AIR MINOR (AIRS/AFS) STATE MASTER (New York facility tracking) - AIR PROGRAM (Resource Conservation and Recovery Act (tracking hazardous waste)) Business SIC classification: GASOLINE SERVICE STATIONS Organizations: AMOCO OIL CO (LEGALLY RESPONSIBLE PARTY)
Alternative names: LEVELAND OIL CO
AMOCO-56230115005 (6401 4TH AVE & 64TH ST in BROOKLYN, NY)
AIR MINOR (AIRS/AFS) STATE MASTER (New York facility tracking) - AIR PROGRAM (Resource Conservation and Recovery Act (tracking hazardous waste)) Business SIC classification: GASOLINE SERVICE STATIONS Organizations: AMOCO OIL CO (LEGALLY RESPONSIBLE PARTY)
Alternative names: AMOCO SERVICE STATION
HARRIMAN CORP (720 64TH STREET in BROOKLYN, NY)
STATE MASTER (New Jersey environmental info) - NJEMS-200581, REFUSE DISPOSAL, NJEMS-209373, NJEMS-NYD187826664, TRANSPORTER TRANSPORTER (Resource Conservation and Recovery Act (tracking hazardous waste)) - notification Organizations: RONALD LICKMAN (CONTACT/OWNER)
HOLLYWOOD CLEANERS (5609 5TH AVENUE in BROOKLYN, NY)
AIR MINOR (AIRS/AFS) STATE MASTER (New York facility tracking) - AIR PROGRAM Business SIC classification: DRYCLEANING PLANTS, EXCEPT RUG CLEANING
ILANA ENTERPRISES LTD (5701 2ND AVENUE in BROOKLYN, NY)
AIR MINOR (AIRS/AFS) STATE MASTER (New York facility tracking) - AIR PROGRAM Business SIC classification: NONCLASSIFIABLE ESTABLISHMENTS
HS OF TELECOMMUNICATIONS ( in BROOKLYN, NY)
(National Center for Education Statistics) - STATE ID-337800010485 Organizations: NEW YORK CITY PUBLIC SCHOOLS (SCHOOL DISTRICT)
IS 220 J. J PERSHING IS ( in BROOKLYN, NY)
(National Center for Education Statistics) - STATE ID-332000010220 Organizations: NEW YORK CITY PUBLIC SCHOOLS (SCHOOL DISTRICT)
CON ED-TM 2 (46TH ST & 3RD AVE in BROOKLYN, NY)
HAZARDOUS WASTE BIENNIAL REPORTER (Resource Conservation and Recovery Act (tracking hazardous waste)) (Resource Conservation and Recovery Act (tracking hazardous waste)) Alternative names: CON ED - MH 5789
ALBEST METAL STAMPING CORP CO (240 50TH ST in BROOKLYN, NY)
COMPLIANCE ACTIVITY (Tracking inspections of insecticide, fungicide, and rodenticide, and toxic substances) (Resource Conservation and Recovery Act (tracking hazardous waste)) Business SIC classification: MAGNETIC AND OPTICAL RECORDING MEDIA Alternative names: ALBEST METAL CORP
CON-RAY NOVELTY FINISHING CO (4605-8TH AVE in BROOKLYN, NY)
(Resource Conservation and Recovery Act (tracking hazardous waste)) Business NAICS classification: ELECTROPLATING, PLATING, POLISHING, ANODIZING, AND COLORING. Organizations: OWNERNAME (CONTACT/OWNER)
CON ED - MH 61630 (19TH AVE & 48TH ST in BROOKLYN, NY)
HAZARDOUS WASTE BIENNIAL REPORTER (Resource Conservation and Recovery Act (tracking hazardous waste)) (Resource Conservation and Recovery Act (tracking hazardous waste))
CON ED MH 6126 (W/INT 4TH AVE & 61 ST in BROOKLYN, NY)
HAZARDOUS WASTE BIENNIAL REPORTER (Resource Conservation and Recovery Act (tracking hazardous waste)) (Resource Conservation and Recovery Act (tracking hazardous waste))
140 58TH ST BUILDING (140 58TH ST in BROOKLYN, NY)
AIR MINOR (AIRS/AFS) Business SIC classification: NONCLASSIFIABLE ESTABLISHMENTS Alternative names: C & W SEWING MACHINES
Housing units lacking complete plumbing facilities: 1.2% Housing units lacking complete kitchen facilities: 1.4%
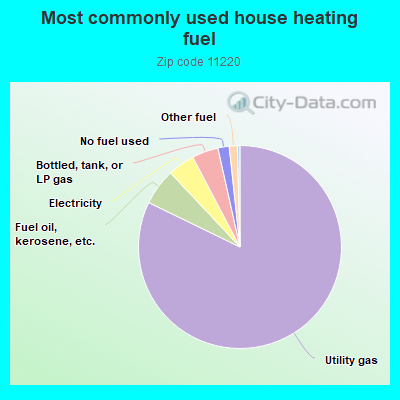
82.3%Utility gas
5.8%Fuel oil, kerosene, etc.
4.3%Electricity
4.2%Bottled, tank, or LP gas
1.8%No fuel used
1.3%Other fuel
Population in 1990: 76,923. Population change in the 1990s: +15,795 (+20.5%).
Place of birth for U.S.-born residents:
This state: 34,742
Northeast: 1,666
Midwest: 841
South: 1,016
West: 1,254
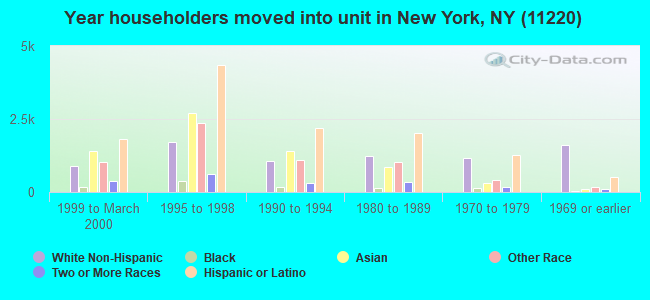
66% of the 11220 zip code residents lived in the same house 5 years ago. Out of people who lived in different houses, 79% lived in this county. Out of people who lived in different counties, 50% lived in New York.
92% of the 11220 zip code residents lived in the same house 1 year ago. Out of people who lived in different houses, 64% moved from this county. Out of people who lived in different houses, 13% moved from different county within same state. Out of people who lived in different houses, 9% moved from different state. Out of people who lived in different houses, 13% moved from abroad.
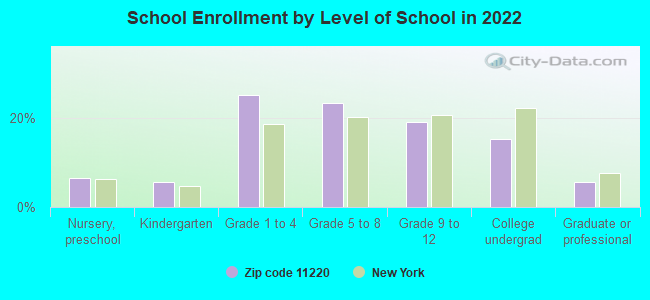
Private vs. public school enrollment:
Students in private schools in grades 1 to 8 (elementary and middle school): 491
Here:
4.2%
New York:
15.6%
Students in private schools in grades 9 to 12 (high school): 151
Here:
3.3%
New York:
15.0%
Students in private undergraduate colleges: 753
Here:
20.8%
New York:
39.2%
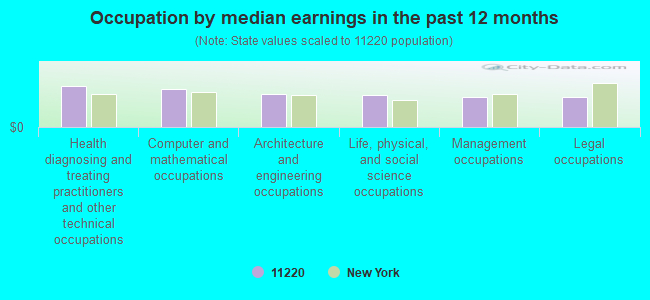
Occupation by median earnings in the past 12 months ($)
94,495Health diagnosing and treating practitioners and other technical occupations
87,698Computer and mathematical occupations
76,333Architecture and engineering occupations
73,029Life, physical, and social science occupations
69,952Management occupations
69,047Legal occupations
Companies with biggest federal contracts located in this zip code (BROOKLYN, NY):
TRATAROSCONSTRUCTION INC (664 64TH STREET) : $35,473,452 in 96 contractsfrom 1999 to 2006
Contracts for Construction of Structures and Facilities -- Other Administrative Facilities and Service Buildings, Construction of Structures and Facilities -- Recreational Buildings, Construction of Structures and Facilities -- Schools, Construction of Structures and Facilities -- Other Residential Buildings, and moreby Army, Navy Signed by year:2000: $5,790,654; 2001: $14,019,584; 2002: $13,574,798; 2003: $273,915; 2004: $339,495; 2005: $645,413; 2006: $11,640.
Biggest contracts:
$9,330,468 with Army for Construction of Structures and Facilities -- Other Administrative Facilities and Service Buildings. Signed on 2001-06-29. Completion date: 2002-05-01.
$9,084,493, same as above.Signed on 2002-05-14. Completion date: 2002-05-01.
$4,960,593, same as above.Signed on 2000-09-09. Completion date: 2003-09-24.
$4,482,409 with Army for Construction of Structures and Facilities -- Recreational Buildings. Signed on 2001-09-29. Completion date: 2002-06-11.
M E S , INC (231 - 46TH STREET; small business) : $19,434,117 in 23 contractsfrom 2001 to 2006
Contracts for Construction of Structures and Facilities -- Other Airfield Structures, Construction of Structures and Facilities -- Ammunition Facilities, Ammunition, through 30 mm, Construction of Structures and Facilities -- Office Buildings by Army Signed by year:2000: $0; 2001: $10,272,000; 2002: $0; 2003: $663,802; 2004: $349,190; 2005: $8,080,975; 2006: $68,150.
Biggest contracts:
$10,272,000 with Army for Construction of Structures and Facilities -- Other Airfield Structures. Taking place in NJ. Signed on 2001-09-29. Completion date: 2003-10-31.
$7,262,975 with Army for Construction of Structures and Facilities -- Ammunition Facilities. Taking place in NJ. Signed on 2005-02-11. Completion date: 2007-03-05.
$730,000, same as above.Signed on 2005-04-15. Completion date: 2007-03-05.
$240,000 with Army for Ammunition, through 30 mm. Taking place in NJ. Signed on 2003-06-27. Completion date: 2002-11-01.
HIRANI-M E S JV (231 46TH ST; small business) : $18,107,143 in 18 contractsfrom 2003 to 2006
Contracts for Construction of Structures and Facilities -- Ammunition Storage Buildings by Army Signed by year:2000: $0; 2001: $0; 2002: $0; 2003: $16,549,000; 2004: $0; 2005: $1,248,643; 2006: $309,500.
Biggest contracts:
$16,549,000 with Army for Construction of Structures and Facilities -- Ammunition Storage Buildings. Taking place in NJ. Signed on 2003-09-19. Completion date: 2006-09-30.
$487,000, same as above.Signed on 2005-09-15. Completion date: 2007-01-07.
$227,000, same as above.Signed on 2005-08-12. Completion date: 2006-11-19.
$136,000, same as above.Signed on 2006-03-01. Completion date: 2007-05-07.
EDSAL MACHINE PRDUCTS (126-56 STREET; small business) : $10,312,211 in 548 contractsfrom 1999 to 2006
Contracts for Miscellaneous Vehicular Components, Metal Finishing Equipment, Capacitors, Electrical Hardware and Supplies, and moreby Bureau of Prisoners/Federal Prison System, Navy, National Oceanic and Atmospheric Administration/Under Secretary for Oceans and Atmosphere, Army, and others Signed by year:2000: $384,000; 2001: $440,405; 2002: $636,358; 2003: $1,028,431; 2004: $1,392,937; 2005: $3,936,633; 2006: $2,350,814.
Biggest contracts:
$586,058 with Bureau of Prisoners/Federal Prison System for Miscellaneous Vehicular Components. Signed on 2005-11-09. Completion date: 2007-07-30.
$570,495 with Bureau of Prisoners/Federal Prison System for Metal Finishing Equipment. Signed on 2005-10-19. Completion date: 2010-10-30.
$375,339 with Bureau of Prisoners/Federal Prison System for Capacitors. Signed on 2006-08-10. Completion date: 2010-03-30.
$312,000, same as above.Signed on 2005-07-27. Completion date: 2006-09-30.
ATLAS CONSTRUCTION LLC (255 52 STREET; small business) : $9,419,395 in 22 contractsfrom 2000 to 2004
Contracts for Construction of Structures and Facilities -- Office Buildings, Construction of Structures and Facilities -- Other Administrative Facilities and Service Buildings by Army, United States Coast Guard (disused code: now 7008) Signed by year:2000: $4,198,000; 2001: $3,201,336; 2002: $201,000; 2003: $103,959; 2004: $1,715,100; 2005: $0; 2006: $0.
Biggest contracts:
$4,198,000 with Army for Construction of Structures and Facilities -- Office Buildings. Taking place in MA. Signed on 2000-09-28. Completion date: 2002-02-04.
$3,005,000 with United States Coast Guard (disused code: now 7008) for Construction of Structures and Facilities -- Other Administrative Facilities and Service Buildings. Signed on 2001-02-15. Completion date: 2002-03-15.
$1,715,100 with Army for Construction of Structures and Facilities -- Office Buildings. Taking place in MA. Signed on 2004-01-05. Completion date: 2002-06-27.
$66,000 with United States Coast Guard (disused code: now 7008) for Construction of Structures and Facilities -- Other Administrative Facilities and Service Buildings. Signed on 2002-05-15. Completion date: 2002-08-15.
CHOWDHRY, HABEEB (6814 8TH AVE; small business) : $461,091 in 4 contractsfrom 2001 to 2002
$448,986 with Army for Maintenance, Repair or Alteration of Real Property -- Other Industrial Buildings. Taking place in PA. Signed on 2001-11-07. Completion date: 2002-10-15.
$70,786 with Army for Maintenance, Repair or Alteration of Real Property -- Office Buildings. Taking place in KY. Signed on 2001-09-21. Completion date: 2001-12-17.
-$6,000 with Army for Maintenance, Repair or Alteration of Real Property -- Other Industrial Buildings. Taking place in PA. Signed on 2002-06-06. Completion date: 2002-10-15.
-$52,681 with Army for Maintenance, Repair or Alteration of Real Property -- Office Buildings. Taking place in KY. Signed on 2002-03-15. Completion date: 2001-11-30.
EVEREST GENERAL CONTRACTORS IN (323 68TH STREET; small business) : $190,468 in 3 contractsin 2000
$113,955 with Defense Logistics Agency for Maintenance, Repair or Alteration of Real Property -- Other Warehouse Buildings. Taking place in PA. Signed on 2000-09-30. Completion date: 2000-12-31.
$51,151, same as above.Signed on 2000-09-30. Completion date: 2000-12-31.
$25,362, same as above.Signed on 2000-09-30. Completion date: 2000-12-31.
IEH CORPORATION (140 58TH ST STE 8E) : $22,849 in 12 contractsfrom 2003 to 2005
Contracts for Lugs, Terminals, and Terminal Strips, Aircraft Air Conditioning, Heating, and Pressurizing Equipment, Connectors, Electrical by Navy, Army Signed by year:2000: $0; 2001: $0; 2002: $0; 2003: $2,992; 2004: $14,983; 2005: $4,874; 2006: $0.
Biggest contracts:
$9,500 with Navy for Lugs, Terminals, and Terminal Strips. Taking place in FL. Signed on 2004-10-19. Completion date: 2005-02-28.
$4,968 with Navy for Aircraft Air Conditioning, Heating, and Pressurizing Equipment. Taking place in FL. Signed on 2005-12-14. Completion date: 2006-12-12.
$4,000 with Army for Connectors, Electrical. Signed on 2004-04-14. Completion date: 2004-06-11.
$1,680, same as above.Signed on 2003-08-27. Completion date: 2004-03-31.
AIR TECH LABS INC (269 46TH ST; small business)
$10,000 with Navy for Maintenance, Repair or Alteration of Real Property -- Troop Housing Facilities. Taking place in FL. Signed on 2000-09-20. Completion date: 2000-09-26.
M MAROPAKIS CARPENTRY INC (553 63RD ST; small business) : $8,211 in 2 contractsfrom 2000 to 2001
$6,154 with Navy for Construction of Structures and Facilities -- Other Warehouse Buildings. Taking place in PA. Signed on 2000-06-30. Completion date: 2000-01-30.
$2,057, same as above.Signed on 2001-04-02. Completion date: 2000-02-04.
Top industries in this zip code by the number of employees in 2005:
Health Care and Social Assistance: General Medical and Surgical Hospitals (over 1000 employees: 1 establishment)
Health Care and Social Assistance: All Other Outpatient Care Centers (500-999: 1, 100-249: 1, 50-99: 3, 20-49: 2)
Administrative and Support and Waste Management and Remediation Services: Telemarketing Bureaus (500-999: 1, 1-4: 1)
Health Care and Social Assistance: Home Health Care Services (250-499: 1, 100-249: 1, 1-4: 2)
Health Care and Social Assistance: Services for the Elderly and Persons with Disabilities (100-249: 1, 50-99: 3, 20-49: 1, 10-19: 1, 5-9: 6)
2007 - 2018 National Fire Incident Reporting System (NFIRS) incidents
According to the data from the years 2007 - 2018 the average number of fires per year is 231. The highest number of reported fires - 309 took place in 2010, and the least - 173 in 2018. The data has a decreasing trend.
When looking into fire subcategories, the most reports belonged to: Structure Fires (59.0%), and Outside Fires (27.1%).
Fire incident types reported to NFIRS in Zip Code 11220
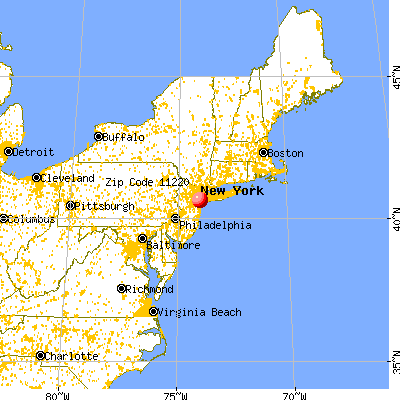


 Nearest zip codes: 11232, 11219, 11209, 11228, 11425, 11215.
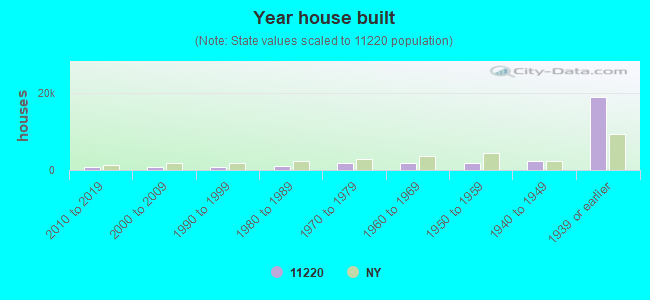


 According to the data from the years 2007 - 2018 the average number of fires per year is 231. The highest number of reported fires - 309 took place in 2010, and the least - 173 in 2018. The data has a decreasing trend.
 When looking into fire subcategories, the most reports belonged to: Structure Fires (59.0%), and Outside Fires (27.1%).