Estimated zip code population in 2022: 90,818 Zip code population in 2010: 92,221 Zip code population in 2000: 85,987
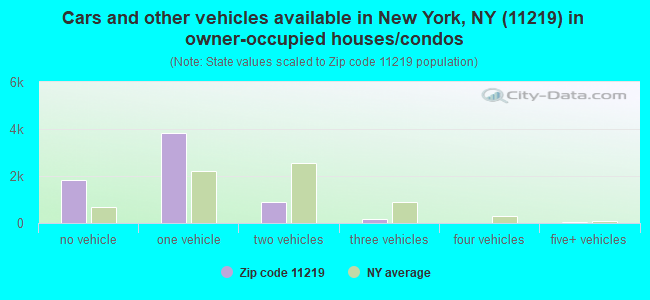
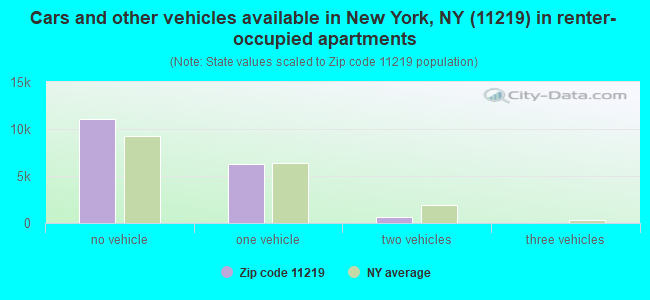
Houses and condos: 27,668 Renter-occupied apartments: 18,033
% of renters here:
73%
State:
46%
March 2022 cost of living index in zip code 11219: 170.3 (very high, U.S. average is 100)
Land area: 1.5 sq. mi. Water area: 0.0 sq. mi.
Population density: 61,278 people per square mile
(very high).
OSM Map
General Map
Google Map
MSN Map
OSM Map
General Map
Google Map
MSN Map
OSM Map
General Map
Google Map
MSN Map
OSM Map
General Map
Google Map
MSN Map
Please wait while loading the map...
Real estate property taxes paid for housing units in 2022:
This zip code:
0.7% ($7,514)
New York:
1.5% ($6,180)
Median real estate property taxes paid for housing units with mortgages in 2022: $7,421 (0.6%) Median real estate property taxes paid for housing units with no mortgage in 2022: $7,672 (0.7%)
Estimated median house/condo value in 2022: $1,100,605
11219:
$1,100,605
New York:
$400,400
According to our research of New York and other state lists, there were 17 registered sex offenders living in 11219 zip code as of April 27, 2024. The ratio of all residents to sex offenders in zip code 11219 is 5,745 to 1. The ratio of registered sex offenders to all residents in this zip code is much lower than the state average.
Median resident age:
This zip code:
26.3 years
New York median age:
40.0 years
Average household size:
This zip code:
3.6 people
New York:
2.5 people
Averages for the 2020 tax year for zip code 11219, filed in 2021:
Average Adjusted Gross Income (AGI) in 2020: $45,682 (Individual Income Tax Returns)
Here:
$45,682
State:
$90,930
Salary/wage: $34,459 (reported on 79.6% of returns)
Here:
$34,459
State:
$72,104
(% of AGI for various income ranges: 1199.0% for AGIs below $25k, 3251.1% for AGIs $25k-50k, 7023.1% for AGIs $50k-75k, 11022.6% for AGIs $75k-100k, 19072.1% for AGIs $100k-200k, 70471.2% for AGIs over 200k)
Taxable interest for individuals: $2,350 (reported on 19.3% of returns)
This zip code:
$2,350
New York:
$3,075
(% of AGI for various income ranges: 11.1% for AGIs below $25k, 14.3% for AGIs $25k-50k, 51.0% for AGIs $50k-75k, 116.3% for AGIs $75k-100k, 285.1% for AGIs $100k-200k, 5058.8% for AGIs over 200k)
Ordinary dividends: $4,856 (reported on 10.9% of returns)
Here:
$4,856
State:
$11,095
(% of AGI for various income ranges: 9.5% for AGIs below $25k, 19.4% for AGIs $25k-50k, 58.3% for AGIs $50k-75k, 183.4% for AGIs $75k-100k, 378.6% for AGIs $100k-200k, 5489.4% for AGIs over 200k)
Net capital gain/loss in AGI: +$16,570 (reported on 12.3% of returns)
Here:
+$16,570
State:
+$44,925
(% of AGI for various income ranges: 6.6% for AGIs below $25k, 30.8% for AGIs $25k-50k, 137.7% for AGIs $50k-75k, 311.2% for AGIs $75k-100k, 978.1% for AGIs $100k-200k, 31867.1% for AGIs over 200k)
Profit/loss from business: +$12,195 (reported on 20.5% of returns)
Here:
+$12,195
State:
+$14,940
(% of AGI for various income ranges: 233.1% for AGIs below $25k, 231.6% for AGIs $25k-50k, 338.3% for AGIs $50k-75k, 454.3% for AGIs $75k-100k, 915.7% for AGIs $100k-200k, 12571.8% for AGIs over 200k)
Taxable individual retirement arrangement distribution: $13,315 (reported on 2.1% of returns)
11219:
$13,315
New York:
$19,609
(% of AGI for various income ranges: 11.4% for AGIs below $25k, 16.3% for AGIs $25k-50k, 73.0% for AGIs $50k-75k, 130.2% for AGIs $75k-100k, 252.7% for AGIs $100k-200k, 1056.5% for AGIs over 200k)
Self-employed (Keogh) retirement plans: $32,183 (reported on 0.2% of returns)
11219:
$32,183
New York:
$32,497
(% of AGI for various income ranges: 43.7% for AGIs $75k-100k, 891.8% for AGIs over 200k)
Total itemized deductions: $83,593 (reported on 5.3% of returns)
Here:
$83,593
State:
$39,326
(% of AGI for various income ranges: 16.7% for AGIs below $25k, 58.1% for AGIs $25k-50k, 307.5% for AGIs $50k-75k, 687.6% for AGIs $75k-100k, 2549.0% for AGIs $100k-200k, 66402.9% for AGIs over 200k)
Charity contributions: $75,163 (reported on 4.2% of returns)
Here:
$75,163
State:
$15,420
(% of AGI for various income ranges: 1.4% for AGIs below $25k, 9.8% for AGIs $25k-50k, 72.2% for AGIs $50k-75k, 227.8% for AGIs $75k-100k, 1174.7% for AGIs $100k-200k, 57014.1% for AGIs over 200k)
Taxes paid: $8,492 (reported on 5.3% of returns)
11219:
$8,492
State:
$9,183
(% of AGI for various income ranges: 4.3% for AGIs below $25k, 13.1% for AGIs $25k-50k, 73.6% for AGIs $50k-75k, 180.9% for AGIs $75k-100k, 569.7% for AGIs $100k-200k, 3134.7% for AGIs over 200k)
Earned income credit: $3,034 (reported on 39.0% of returns)
Here:
$3,034
State:
$2,138
(% of AGI for various income ranges: 203.4% for AGIs below $25k, 219.6% for AGIs $25k-50k, 6.3% for AGIs $50k-75k)
Percentage of individuals using paid preparers for their 2020 taxes: 93.0%
Here:
93%
State:
95%
(% for various income ranges: 91.3% for AGIs below $25k, 95.2% for AGIs $25k-50k, 94.7% for AGIs $50k-75k, 94.1% for AGIs $75k-100k, 94.3% for AGIs $100k-200k, 93.2% for AGIs over 200k)
Averages for the 2012 tax year for zip code 11219, filed in 2013:
Average Adjusted Gross Income (AGI) in 2012: $37,407 (Individual Income Tax Returns)
Here:
$37,407
State:
$77,088
Salary/wage: $30,636 (reported on 79.8% of returns)
Here:
$30,636
State:
$60,593
(% of AGI for various income ranges: 75.3% for AGIs below $25k, 86.1% for AGIs $25k-50k, 83.8% for AGIs $50k-75k, 78.4% for AGIs $75k-100k, 72.1% for AGIs $100k-200k, 26.1% for AGIs over 200k)
Taxable interest for individuals: $3,129 (reported on 23.2% of returns)
This zip code:
$3,129
New York:
$3,125
(% of AGI for various income ranges: 0.7% for AGIs below $25k, 0.8% for AGIs $25k-50k, 1.1% for AGIs $50k-75k, 1.7% for AGIs $75k-100k, 1.8% for AGIs $100k-200k, 4.3% for AGIs over 200k)
Ordinary dividends: $4,775 (reported on 11.0% of returns)
Here:
$4,775
State:
$10,299
(% of AGI for various income ranges: 0.6% for AGIs below $25k, 0.8% for AGIs $25k-50k, 1.0% for AGIs $50k-75k, 1.6% for AGIs $75k-100k, 1.8% for AGIs $100k-200k, 2.4% for AGIs over 200k)
Net capital gain/loss in AGI: +$21,063 (reported on 9.6% of returns)
Here:
+$21,063
State:
+$42,474
(% of AGI for various income ranges: 0.2% for AGIs $50k-75k, 1.2% for AGIs $75k-100k, 1.7% for AGIs $100k-200k, 19.6% for AGIs over 200k)
Profit/loss from business: +$12,301 (reported on 24.0% of returns)
Here:
+$12,301
State:
+$16,168
(% of AGI for various income ranges: 19.1% for AGIs below $25k, 5.6% for AGIs $25k-50k, 4.8% for AGIs $50k-75k, 3.8% for AGIs $75k-100k, 4.5% for AGIs $100k-200k, 4.7% for AGIs over 200k)
Taxable individual retirement arrangement distribution: $10,625 (reported on 3.3% of returns)
11219:
$10,625
New York:
$17,621
(% of AGI for various income ranges: 0.9% for AGIs below $25k, 0.8% for AGIs $25k-50k, 0.8% for AGIs $50k-75k, 1.4% for AGIs $75k-100k, 1.7% for AGIs $100k-200k, 0.5% for AGIs over 200k)
Self-employment retirement plans: $38,871 (reported on 0.2% of returns)
11219:
$38,871
New York:
$27,330
(% of AGI for various income ranges: 0.2% for AGIs $25k-50k, 0.3% for AGIs $100k-200k, 0.6% for AGIs over 200k)
Total itemized deductions: $41,373 (30% of AGI, reported on 14.4% of returns)
Here:
$41,373
State:
$34,985
Here:
30.5% of AGI
State:
21.3% of AGI
(% of AGI for various income ranges: 2.5% for AGIs below $25k, 6.8% for AGIs $25k-50k, 12.4% for AGIs $50k-75k, 15.9% for AGIs $75k-100k, 21.8% for AGIs $100k-200k, 31.5% for AGIs over 200k)
Charity contributions: $21,427 (reported on 11.9% of returns)
Here:
$21,427
State:
$5,572
(% of AGI for various income ranges: 0.2% for AGIs below $25k, 1.2% for AGIs $25k-50k, 2.6% for AGIs $50k-75k, 4.0% for AGIs $75k-100k, 7.1% for AGIs $100k-200k, 18.8% for AGIs over 200k)
Taxes paid: $14,813 (reported on 14.3% of returns)
11219:
$14,813
State:
$18,656
(% of AGI for various income ranges: 0.6% for AGIs below $25k, 1.9% for AGIs $25k-50k, 4.4% for AGIs $50k-75k, 6.6% for AGIs $75k-100k, 9.1% for AGIs $100k-200k, 10.8% for AGIs over 200k)
Earned income credit: $3,082 (reported on 45.8% of returns)
Here:
$3,082
State:
$2,230
(% of AGI for various income ranges: 15.4% for AGIs below $25k, 2.6% for AGIs $25k-50k)
Percentage of individuals using paid preparers for their 2012 taxes: 73.8%
Here:
74%
State:
66%
(% for various income ranges: 73.2% for AGIs below $25k, 73.5% for AGIs $25k-50k, 74.1% for AGIs $50k-75k, 76.9% for AGIs $75k-100k, 78.3% for AGIs $100k-200k, 84.1% for AGIs over 200k)
Averages for the 2004 tax year for zip code 11219, filed in 2005:
Average Adjusted Gross Income (AGI) in 2004: $35,207 (Individual Income Tax Returns)
Here:
$35,207
State:
$59,519
Salary/wage: $29,046 (reported on 77.1% of returns)
Here:
$29,046
State:
$50,673
(% of AGI for various income ranges: 96.0% for AGIs below $10k, 76.1% for AGIs $10k-25k, 86.6% for AGIs $25k-50k, 83.0% for AGIs $50k-75k, 80.8% for AGIs $75k-100k, 33.1% for AGIs over 100k)
Taxable interest for individuals: $2,620 (reported on 46.1% of returns)
This zip code:
$2,620
New York:
$2,377
(% of AGI for various income ranges: 8.1% for AGIs below $10k, 2.6% for AGIs $10k-25k, 1.9% for AGIs $25k-50k, 2.4% for AGIs $50k-75k, 2.8% for AGIs $75k-100k, 4.7% for AGIs over 100k)
Taxable dividends: $2,886 (reported on 18.4% of returns)
Here:
$2,886
State:
$5,394
(% of AGI for various income ranges: 3.6% for AGIs below $10k, 1.3% for AGIs $10k-25k, 1.1% for AGIs $25k-50k, 1.4% for AGIs $50k-75k, 1.6% for AGIs $75k-100k, 1.7% for AGIs over 100k)
Net capital gain/loss: +$13,090 (reported on 15.0% of returns)
Here:
+$13,090
State:
+$23,581
(% of AGI for various income ranges: -1.3% for AGIs below $10k, 0.0% for AGIs $10k-25k, 0.2% for AGIs $25k-50k, 1.0% for AGIs $50k-75k, 1.5% for AGIs $75k-100k, 13.7% for AGIs over 100k)
Profit/loss from business: +$11,642 (reported on 21.1% of returns)
Here:
+$11,642
State:
+$13,809
(% of AGI for various income ranges: 34.8% for AGIs below $10k, 13.9% for AGIs $10k-25k, 4.9% for AGIs $25k-50k, 3.0% for AGIs $50k-75k, 2.5% for AGIs $75k-100k, 5.4% for AGIs over 100k)
IRA payment deduction: $3,680 (reported on 3.5% of returns)
11219:
$3,680
New York:
$3,115
(% of AGI for various income ranges: 0.3% for AGIs below $10k, 0.3% for AGIs $10k-25k, 0.7% for AGIs $25k-50k, 0.5% for AGIs $50k-75k, 0.5% for AGIs $75k-100k, 0.2% for AGIs over 100k)
Self-employed pension: $16,924 (reported on 0.3% of returns)
Here:
$16,924
New York:
$19,016
Total itemized deductions: $35,054 (34% of AGI, reported on 20.1% of returns)
Here:
$35,054
State:
$25,864
Here:
33.5% of AGI
State:
21.9% of AGI
(% of AGI for various income ranges: 5.5% for AGIs below $10k, 5.1% for AGIs $10k-25k, 15.9% for AGIs $25k-50k, 16.6% for AGIs $50k-75k, 19.4% for AGIs $75k-100k, 30.7% for AGIs over 100k)
Charity contributions deductions: $17,938 (16% of AGI, reported on 18.2% of returns)
Here:
$17,938
State:
$4,439
Here:
16.1% of AGI
State:
3.6% of AGI
(% of AGI for various income ranges: 0.3% for AGIs below $10k, 0.9% for AGIs $10k-25k, 2.3% for AGIs $25k-50k, 4.2% for AGIs $50k-75k, 5.6% for AGIs $75k-100k, 19.6% for AGIs over 100k)
Total tax: $6,237 (reported on 61.2% of returns)
11219:
$6,237
State:
$11,730
(% of AGI for various income ranges: 6.7% for AGIs below $10k, 3.9% for AGIs $10k-25k, 6.1% for AGIs $25k-50k, 8.7% for AGIs $50k-75k, 9.8% for AGIs $75k-100k, 17.4% for AGIs over 100k)
Earned income credit: $2,307 (reported on 36.8% of returns)
Here:
$2,307
State:
$1,757
Percentage of individuals using paid preparers for their 2004 taxes: 68.3%
Here:
68%
State:
67%
(% for various income ranges: 64.9% for AGIs below $10k, 67.7% for AGIs $10k-25k, 69.9% for AGIs $25k-50k, 71.6% for AGIs $50k-75k, 73.6% for AGIs $75k-100k, 79.7% for AGIs over 100k)
Likely homosexual households (counted as self-reported same-sex unmarried-partner households)
Lesbian couples: 0.1% of all households
Gay men: 0.0% of all households
Household received Food Stamps/SNAP in the past 12 months: 9,323 Household did not receive Food Stamps/SNAP in the past 12 months: 15,868
Women who had a birth in the past 12 months: 2,339 (2,147 now married, 164 unmarried) Women who did not have a birth in the past 12 months: 17,161 (8,387 now married, 8,669 unmarried)
Housing units in zip code 11219 with a mortgage: 3,195 (296 second mortgage, 122 both second mortgage and home equity loan) Houses without a mortgage: 190
Median monthly owner costs for units with a mortgage: $3,452 Median monthly owner costs for units without a mortgage: $1,272
Residents with income below the poverty level in 2022:
This zip code:
33.5%
Whole state:
14.3%
Residents with income below 50% of the poverty level in 2022:
This zip code:
20.8%
Whole state:
6.8%
Median number of rooms in houses and condos:
Here:
5.7
State:
6.3
Median number of rooms in apartments:
Here:
3.9
State:
3.8
Notable locations in this zip code not listed on our city pages
Notable locations in zip code 11219: Sixtysixth Precinct Police Station (A), Borough Park Branch Brooklyn Public Library (B), Fire Department New York Engine 247 Thawing Apparatus 64 (C), New York Thawing Apparatus Company 64 (D), Fire Department New York Engine 282 Ladder 148 (E), New York Ladder Company 148 (F). Display/hide their locations on the map
Churches in zip code 11219 include: Coptic Orthodox Church of Saint George (A), Chamiohoon Church of New York (B), Saint Roslia Roman Catholic Church (C), Bnos Zion of Bobov Synagogue (D), Boro Park Synagogue (E), Congregation Beth El of Boro Park (F), Congregation Khal Chasidim (G), Congregation Shaarei Zion (H), Congregation Beer Moshe (I). Display/hide their locations on the map
29,945 married couples with children.
2,498 single-parent households (1,075 men, 1,423 women).
17.9% of residents of 11219 zip code speak English at home.
12.7% of residents speak Spanish at home (34% very well, 27% well, 24% not well, 16% not at all).
44.8% of residents speak other Indo-European language at home (42% very well, 50% well, 7% not well, 2% not at all).
21.9% of residents speak Asian or Pacific Island language at home (24% very well, 19% well, 40% not well, 17% not at all).
4.4% of residents speak other language at home (58% very well, 28% well, 13% not well, 1% not at all).
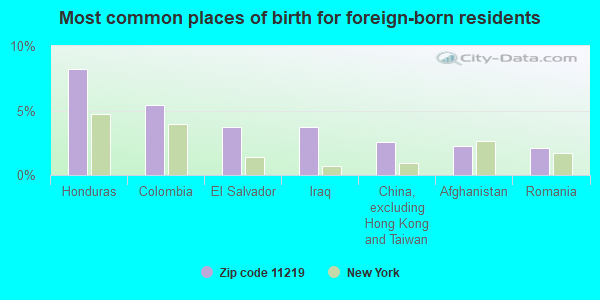
Foreign born population: 28,944 (31.9%) (51.9% of them are naturalized citizens)
This zip code:
31.9%
Whole state:
22.7%
8%Honduras
5%Colombia
4%El Salvador
4%Iraq
3%China, excluding Hong Kong and Taiwan
2%Afghanistan
2%Romania
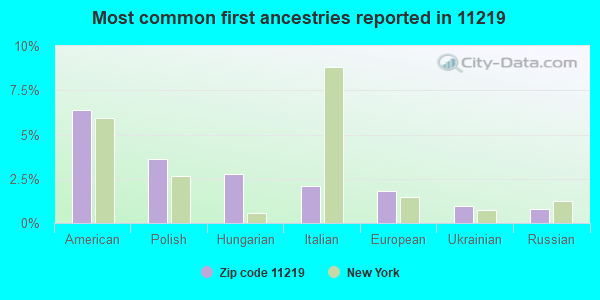
6%American
4%Polish
3%Hungarian
2%Italian
2%European
1%Ukrainian
1%Russian
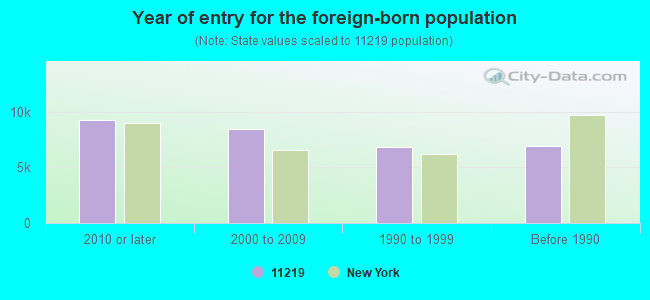
Year of entry for the foreign-born population
9,2282010 or later
8,4582000 to 2009
6,8481990 to 1999
6,947Before 1990
Major facilities with environmental interests located in this zip code:
AMOCO SVCS STA #60488 (1301-19 65TH STREET in BROOKLYN, NY)
AIR MINOR (AIRS/AFS) STATE MASTER (New York facility tracking) - AIR PROGRAM (Resource Conservation and Recovery Act (tracking hazardous waste)) Business SIC classification: GASOLINE SERVICE STATIONS Organizations: BP PRODUCTS NORTH AMERICA INC, AMOCO OIL CO (LEGALLY RESPONSIBLE PARTY)
Alternative names: A C A AMOCO 585, AMOCO service station 60488
ACE DRY CLEANERS (6805 11TH AVENUE in BROOKLYN, NY)
AIR MINOR (AIRS/AFS) STATE MASTER (New York facility tracking) - AIR PROGRAM, HAZARDOUS WASTE PROGRAM (Resource Conservation and Recovery Act (tracking hazardous waste)) Business SIC classification: DRYCLEANING PLANTS, EXCEPT RUG CLEANING Business NAICS classification: DRYCLEANING AND LAUNDRY SERVICES (EXCEPT COIN-OPERATED). Organizations: ACE DRY CLEANERS INC (LEGALLY RESPONSIBLE PARTY)
ALEXIS FRENCH CLEANERS (6706 11TH AVENUE in BROOKLYN, NY)
AIR MINOR (AIRS/AFS) STATE MASTER (New York facility tracking) - AIR PROGRAM, HAZARDOUS WASTE PROGRAM Small Quantity Generators, between 100 kg and 1000 kg of hazardous waste/month (Resource Conservation and Recovery Act (tracking hazardous waste)) - notification Business SIC classification: DRYCLEANING PLANTS, EXCEPT RUG CLEANING Business NAICS classification: DRYCLEANING AND LAUNDRY SERVICES (EXCEPT COIN-OPERATED). Organizations: ARTHUR ARBIT (CONTACT/OWNER)
, ALEXIS FRENCH CLEANERS CORP (LEGALLY RESPONSIBLE PARTY)
Alternative names: J GALATI CHEZ LAMI
GRACE CLEANERS (6405 11TH AVE in BROOKLYN, NY)
AIR MINOR (AIRS/AFS) STATE MASTER (New York facility tracking) - AIR PROGRAM (Resource Conservation and Recovery Act (tracking hazardous waste)) Business SIC classification: DRYCLEANING PLANTS, EXCEPT RUG CLEANING Organizations: P & L CLEANERS CORP (LEGALLY RESPONSIBLE PARTY)
ALFAX AUTO COLLISION-6115 15TH AVE (6115 15TH AVE in BROOKLYN, NY)
STATE MASTER (New York facility tracking) - AIR PROGRAM (Resource Conservation and Recovery Act (tracking hazardous waste)) Organizations: ALFAX AUTO COLLISION INC (LEGALLY RESPONSIBLE PARTY)
Alternative names: ALFAX AUTO COLLISION INC
BETH JACOB OF BOROUGH PARK (1371 46TH ST in BROOKLYN, NY)
FORMAL ENFORCEMENT ACTION (Integrated Compliance Information System) - ICIS-02-2005-1032, ENFORCEMENT/COMPLIANCE ACTIVITY COMPLIANCE ACTIVITY (Tracking inspections of insecticide, fungicide, and rodenticide, and toxic substances)
IS 187 ( in BROOKLYN, NY)
(National Center for Education Statistics) - STATE ID-332000010187 Organizations: NEW YORK CITY PUBLIC SCHOOLS (SCHOOL DISTRICT)
CON EDISON - VS 1691 (46TH ST & 12TH AVE in BROOKLYN, NY)
Large Quantity Generators, more that 1000 kg of hazardous waste/month (Resource Conservation and Recovery Act (tracking hazardous waste)) Organizations: CONSOLIDATED EDISON COMPANY OF NY, INC. (CONTACT/OPERATOR)
COIN ED - MH 4531 (S/S ST JOHNS PL 20' W/O in BROOKLYN, NY)
HAZARDOUS WASTE BIENNIAL REPORTER (Resource Conservation and Recovery Act (tracking hazardous waste)) (Resource Conservation and Recovery Act (tracking hazardous waste))
A MICHELS AUTO PARTS (1456 62ND ST in BROOKLYN, NY)
(Resource Conservation and Recovery Act (tracking hazardous waste))
ADVANCED AUTO BODY DBA NIC-WAY CORP (925 61ST STREET in BROOKLYN, NY)
(Resource Conservation and Recovery Act (tracking hazardous waste))
HAZEL BRACHA HATZLOCHA INC (1430 48TH ST in BROOKLYN, NY)
(Resource Conservation and Recovery Act (tracking hazardous waste))
CON EDISON (N SIDE OF LENOX RD 19 FEET W in BROOKLYN, NY)
(Resource Conservation and Recovery Act (tracking hazardous waste))
Housing units lacking complete plumbing facilities: 0.7% Housing units lacking complete kitchen facilities: 1.2%
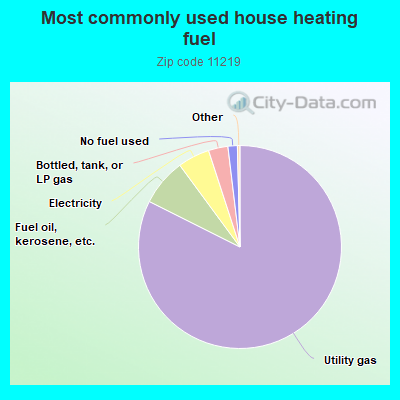
82.4%Utility gas
7.5%Fuel oil, kerosene, etc.
5.1%Electricity
3.1%Bottled, tank, or LP gas
1.5%No fuel used
Population in 1990: 73,527. Population change in the 1990s: +12,460 (+16.9%).
Place of birth for U.S.-born residents:
This state: 55,811
Northeast: 976
Midwest: 970
South: 818
West: 806
72% of the 11219 zip code residents lived in the same house 5 years ago. Out of people who lived in different houses, 85% lived in this county. Out of people who lived in different counties, 50% lived in New York.
93% of the 11219 zip code residents lived in the same house 1 year ago. Out of people who lived in different houses, 69% moved from this county. Out of people who lived in different houses, 8% moved from different county within same state. Out of people who lived in different houses, 6% moved from different state. Out of people who lived in different houses, 15% moved from abroad.
Private vs. public school enrollment:
Students in private schools in grades 1 to 8 (elementary and middle school): 11,113
Here:
70.7%
New York:
15.6%
Students in private schools in grades 9 to 12 (high school): 3,796
Here:
59.9%
New York:
15.0%
Students in private undergraduate colleges: 3,293
Here:
66.0%
New York:
39.2%
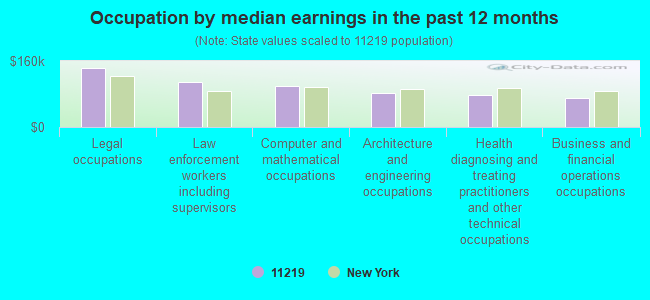
Occupation by median earnings in the past 12 months ($)
142,479Legal occupations
108,948Law enforcement workers including supervisors
99,922Computer and mathematical occupations
81,505Architecture and engineering occupations
77,936Health diagnosing and treating practitioners and other technical occupations
71,504Business and financial operations occupations
Companies with federal contracts located in this zip code (BROOKLYN, NY):
ARIS JUDAICA TREASURES CORP (4514-11TH AVENUE; small business) : $173,007 in 21 contractsfrom 2004 to 2006
Contracts for Ecclesiastical Equipment, Furnishings, and Supplies by Defense Logistics Agency Signed by year:2000: $0; 2001: $0; 2002: $0; 2003: $0; 2004: $71,668; 2005: $70,655; 2006: $30,684.
Biggest contracts:
$38,409 with Defense Logistics Agency for Ecclesiastical Equipment, Furnishings, and Supplies. Signed on 2004-03-25. Completion date: 2004-03-25.
$33,259, same as above.Signed on 2004-02-06. Completion date: 2004-03-31.
$27,023, same as above.Signed on 2006-01-31. Completion date: 2006-02-28.
$17,364, same as above.Signed on 2005-03-29. Completion date: 2005-04-12.
INDUSTRIAL BEARING TECHNOLOGIE (1537 59TH ST; small business) : $106,852 in 2 contractsfrom 2004 to 2005
$72,420 with Navy for Bearings, Antifriction, Unmounted. Signed on 2005-05-06. Completion date: 2005-06-08.
$34,432 with U.S. Coast Guard for Bearings, Antifriction, Unmounted. Signed on 2004-06-15. Completion date: 2004-07-20.
S & F INDUSTRIES, LLC (5201-14TH AVE; small business) : $79,079 in 20 contractsfrom 2004 to 2005
Contracts for Clothing, Special Purpose by Army Signed by year:2000: $0; 2001: $0; 2002: $0; 2003: $0; 2004: $40,670; 2005: $38,409; 2006: $0.
Biggest contracts:
$12,329 with Army for Clothing, Special Purpose. Signed on 2004-09-27. Completion date: 2004-10-27.
$10,921, same as above.Signed on 2004-08-16. Completion date: 2004-08-30.
$10,138, same as above.Signed on 2005-06-20. Completion date: 2005-07-20.
$8,573, same as above.Signed on 2005-04-21. Completion date: 2005-05-05.
SHANNON E OROURKE (939 68TH STREET ST, BASEME; small business) : $15,808 in 4 contractsin 2001
$16,172 with Army for Other Education and Training Services. Signed on 2001-10-23. Completion date: 2002-09-30.
$0, same as above.Signed on 2001-10-23. Completion date: 2002-09-30.
$0 with Army for Educational Services. Signed on 2001-07-20. Completion date: 2000-11-30.
-$364, same as above.Signed on 2001-07-20. Completion date: 2000-11-30.
PRICERITEPHOTO.COM (1274 49TH STREET; small business)
$4,623 with Bureau of Reclamation for Cameras, Still Picture. Signed on 2005-08-17. Completion date: 2005-08-30.
REGINA CATERERS INC (6409 - 11TH AVE; small business)
$4,140 with Army for Food Cooking, Baking, and Serving Equipment. Signed on 2006-02-06. Completion date: 2006-02-11.
LOUIS DRY CLEANERS, INC (1032 OVINGTON AVE; small business)
$3,794 with Army for Laundry and DryCleaning Services. Signed on 2004-04-09. Completion date: 2004-04-19.
LEE SPRING COMPANY (1462 62ND ST; small business) : $768 in 2 contractsfrom 2004 to 2005
$703 with Navy for Coil, Flat, Leaf, and Wire Springs. Signed on 2005-04-18. Completion date: 2005-05-20.
$65 with Navy for Pipe and Conduit, Nonmetallic. Taking place in VA. Signed on 2004-09-10. Completion date: 2004-09-27.
Top industries in this zip code by the number of employees in 2005:
Health Care and Social Assistance: Home Health Care Services (over 1000 employees: 2 establishments, 250-499 employees: 1 establishment, 50-99 employees: 1 establishment, 20-49 employees: 2 establishments, 1-4 employees: 1 establishment)
Health Care and Social Assistance: General Medical and Surgical Hospitals (over 1000: 1)
2007 - 2018 National Fire Incident Reporting System (NFIRS) incidents
According to the data from the years 2007 - 2018 the average number of fire incidents per year is 301. The highest number of reported fire incidents - 367 took place in 2008, and the least - 255 in 2017. The data has a declining trend.
When looking into fire subcategories, the most reports belonged to: Structure Fires (64.9%), and Outside Fires (26.2%).
Fire incident types reported to NFIRS in Zip Code 11219


 Nearest zip codes: 11204, 11220, 11228, 11218, 11232, 11215.


 According to the data from the years 2007 - 2018 the average number of fire incidents per year is 301. The highest number of reported fire incidents - 367 took place in 2008, and the least - 255 in 2017. The data has a declining trend.
 When looking into fire subcategories, the most reports belonged to: Structure Fires (64.9%), and Outside Fires (26.2%).