Estimated zip code population in 2022: 27,403
Zip code population in 2010: 25,105
Zip code population in 2000: 27,647
Houses and condos: 8,476
Renter-occupied apartments: 2,277
% of renters here:
28%State:
46%
March 2022 cost of living index in zip code 11429: 146.4
(very high, U.S. average is 100)
Land area: 1.3
sq. mi.
Water area: 0.0
sq. mi.
Population density: 21,039 people per square mile (very high).
OSM Map
General Map
Google Map
MSN Map
OSM Map
General Map
Google Map
MSN Map
OSM Map
General Map
Google Map
MSN Map
OSM Map
General Map
Google Map
MSN Map
Please wait while loading the map...
Real estate property taxes paid for housing units in 2022:
This zip code:
0.7% ($4,738)New York:
1.5% ($6,180)
Median real estate property taxes paid for housing units with mortgages in 2022: $4,878 (0.7%)
Median real estate property taxes paid for housing units with no mortgage in 2022: $4,496 (0.8%)
Profiles of local businesses
Business Search - 14 Million verified businesses
Males: 12,942 Females: 14,460
For population 25 years and over in 11429:
High school or higher: 84.5%Bachelor's degree or higher: 28.1%Graduate or professional degree: 10.5%Unemployed: 8.5%Mean travel time to work (commute): 49.1 minutes
For population 15 years and over in 11429:
Never married: 45.2%Now married: 40.5%Separated: 2.0%Widowed: 5.3%Divorced: 6.9%
Zip code 11429 compared to state average:
Median house value above state average. Black race population percentage significantly above state average. Foreign-born population percentage above state average. Renting percentage below state average. Length of stay since moving in above state average. House age above state average. 17,927 65.4% Black 4,115 15.0% Hispanic or Latino 2,026 7.4% Asian 1,281 4.7% Two or more races 1,219 4.4% Some other race 820 3.0% White 11 0.04% American Indian
Data:
Median household income ($)
Median household income (% change since 2000)
Household income diversity
Ratio of average income to average house value (%)
Ratio of average income to average rent
Median household income ($) - White
Median household income ($) - Black or African American
Median household income ($) - Asian
Median household income ($) - Hispanic or Latino
Median household income ($) - American Indian and Alaska Native
Median household income ($) - Multirace
Median household income ($) - Other Race
Median household income for houses/condos with a mortgage ($)
Median household income for apartments without a mortgage ($)
Races - White alone (%)
Races - White alone (% change since 2000)
Races - Black alone (%)
Races - Black alone (% change since 2000)
Races - American Indian alone (%)
Races - American Indian alone (% change since 2000)
Races - Asian alone (%)
Races - Asian alone (% change since 2000)
Races - Hispanic (%)
Races - Hispanic (% change since 2000)
Races - Native Hawaiian and Other Pacific Islander alone (%)
Races - Native Hawaiian and Other Pacific Islander alone (% change since 2000)
Races - Two or more races (%)
Races - Two or more races (% change since 2000)
Races - Other race alone (%)
Races - Other race alone (% change since 2000)
Racial diversity
Unemployment (%)
Unemployment (% change since 2000)
Unemployment (%) - White
Unemployment (%) - Black or African American
Unemployment (%) - Asian
Unemployment (%) - Hispanic or Latino
Unemployment (%) - American Indian and Alaska Native
Unemployment (%) - Multirace
Unemployment (%) - Other Race
Population density (people per square mile)
Population - Males (%)
Population - Females (%)
Population - Males (%) - White
Population - Males (%) - Black or African American
Population - Males (%) - Asian
Population - Males (%) - Hispanic or Latino
Population - Males (%) - American Indian and Alaska Native
Population - Males (%) - Multirace
Population - Males (%) - Other Race
Population - Females (%) - White
Population - Females (%) - Black or African American
Population - Females (%) - Asian
Population - Females (%) - Hispanic or Latino
Population - Females (%) - American Indian and Alaska Native
Population - Females (%) - Multirace
Population - Females (%) - Other Race
Coronavirus confirmed cases (Apr 27, 2024)
Deaths caused by coronavirus (Apr 27, 2024)
Coronavirus confirmed cases (per 100k population) (Apr 27, 2024)
Deaths caused by coronavirus (per 100k population) (Apr 27, 2024)
Daily increase in number of cases (Apr 27, 2024)
Weekly increase in number of cases (Apr 27, 2024)
Cases doubled (in days) (Apr 27, 2024)
Hospitalized patients (Apr 18, 2022)
Negative test results (Apr 18, 2022)
Total test results (Apr 18, 2022)
COVID Vaccine doses distributed (per 100k population) (Sep 19, 2023)
COVID Vaccine doses administered (per 100k population) (Sep 19, 2023)
COVID Vaccine doses distributed (Sep 19, 2023)
COVID Vaccine doses administered (Sep 19, 2023)
Likely homosexual households (%)
Likely homosexual households (% change since 2000)
Likely homosexual households - Lesbian couples (%)
Likely homosexual households - Lesbian couples (% change since 2000)
Likely homosexual households - Gay men (%)
Likely homosexual households - Gay men (% change since 2000)
Cost of living index
Median gross rent ($)
Median contract rent ($)
Median monthly housing costs ($)
Median house or condo value ($)
Median house or condo value ($ change since 2000)
Mean house or condo value by units in structure - 1, detached ($)
Mean house or condo value by units in structure - 1, attached ($)
Mean house or condo value by units in structure - 2 ($)
Mean house or condo value by units in structure by units in structure - 3 or 4 ($)
Mean house or condo value by units in structure - 5 or more ($)
Mean house or condo value by units in structure - Boat, RV, van, etc. ($)
Mean house or condo value by units in structure - Mobile home ($)
Median house or condo value ($) - White
Median house or condo value ($) - Black or African American
Median house or condo value ($) - Asian
Median house or condo value ($) - Hispanic or Latino
Median house or condo value ($) - American Indian and Alaska Native
Median house or condo value ($) - Multirace
Median house or condo value ($) - Other Race
Median resident age
Resident age diversity
Median resident age - Males
Median resident age - Females
Median resident age - White
Median resident age - Black or African American
Median resident age - Asian
Median resident age - Hispanic or Latino
Median resident age - American Indian and Alaska Native
Median resident age - Multirace
Median resident age - Other Race
Median resident age - Males - White
Median resident age - Males - Black or African American
Median resident age - Males - Asian
Median resident age - Males - Hispanic or Latino
Median resident age - Males - American Indian and Alaska Native
Median resident age - Males - Multirace
Median resident age - Males - Other Race
Median resident age - Females - White
Median resident age - Females - Black or African American
Median resident age - Females - Asian
Median resident age - Females - Hispanic or Latino
Median resident age - Females - American Indian and Alaska Native
Median resident age - Females - Multirace
Median resident age - Females - Other Race
Commute - mean travel time to work (minutes)
Travel time to work - Less than 5 minutes (%)
Travel time to work - Less than 5 minutes (% change since 2000)
Travel time to work - 5 to 9 minutes (%)
Travel time to work - 5 to 9 minutes (% change since 2000)
Travel time to work - 10 to 19 minutes (%)
Travel time to work - 10 to 19 minutes (% change since 2000)
Travel time to work - 20 to 29 minutes (%)
Travel time to work - 20 to 29 minutes (% change since 2000)
Travel time to work - 30 to 39 minutes (%)
Travel time to work - 30 to 39 minutes (% change since 2000)
Travel time to work - 40 to 59 minutes (%)
Travel time to work - 40 to 59 minutes (% change since 2000)
Travel time to work - 60 to 89 minutes (%)
Travel time to work - 60 to 89 minutes (% change since 2000)
Travel time to work - 90 or more minutes (%)
Travel time to work - 90 or more minutes (% change since 2000)
Marital status - Never married (%)
Marital status - Now married (%)
Marital status - Separated (%)
Marital status - Widowed (%)
Marital status - Divorced (%)
Median family income ($)
Median family income (% change since 2000)
Median non-family income ($)
Median non-family income (% change since 2000)
Median per capita income ($)
Median per capita income (% change since 2000)
Median family income ($) - White
Median family income ($) - Black or African American
Median family income ($) - Asian
Median family income ($) - Hispanic or Latino
Median family income ($) - American Indian and Alaska Native
Median family income ($) - Multirace
Median family income ($) - Other Race
Median year house/condo built
Median year apartment built
Year house built - Built 2005 or later (%)
Year house built - Built 2000 to 2004 (%)
Year house built - Built 1990 to 1999 (%)
Year house built - Built 1980 to 1989 (%)
Year house built - Built 1970 to 1979 (%)
Year house built - Built 1960 to 1969 (%)
Year house built - Built 1950 to 1959 (%)
Year house built - Built 1940 to 1949 (%)
Year house built - Built 1939 or earlier (%)
Average household size
Household density (households per square mile)
Average household size - White
Average household size - Black or African American
Average household size - Asian
Average household size - Hispanic or Latino
Average household size - American Indian and Alaska Native
Average household size - Multirace
Average household size - Other Race
Occupied housing units (%)
Vacant housing units (%)
Owner occupied housing units (%)
Renter occupied housing units (%)
Vacancy status - For rent (%)
Vacancy status - For sale only (%)
Vacancy status - Rented or sold, not occupied (%)
Vacancy status - For seasonal, recreational, or occasional use (%)
Vacancy status - For migrant workers (%)
Vacancy status - Other vacant (%)
Residents with income below the poverty level (%)
Residents with income below 50% of the poverty level (%)
Children below poverty level (%)
Poor families by family type - Married-couple family (%)
Poor families by family type - Male, no wife present (%)
Poor families by family type - Female, no husband present (%)
Poverty status for native-born residents (%)
Poverty status for foreign-born residents (%)
Poverty among high school graduates not in families (%)
Poverty among people who did not graduate high school not in families (%)
Residents with income below the poverty level (%) - White
Residents with income below the poverty level (%) - Black or African American
Residents with income below the poverty level (%) - Asian
Residents with income below the poverty level (%) - Hispanic or Latino
Residents with income below the poverty level (%) - American Indian and Alaska Native
Residents with income below the poverty level (%) - Multirace
Residents with income below the poverty level (%) - Other Race
Air pollution - Air Quality Index (AQI)
Air pollution - CO
Air pollution - NO2
Air pollution - SO2
Air pollution - Ozone
Air pollution - PM10
Air pollution - PM25
Air pollution - Pb
Crime - Murders per 100,000 population
Crime - Rapes per 100,000 population
Crime - Robberies per 100,000 population
Crime - Assaults per 100,000 population
Crime - Burglaries per 100,000 population
Crime - Thefts per 100,000 population
Crime - Auto thefts per 100,000 population
Crime - Arson per 100,000 population
Crime - City-data.com crime index
Crime - Violent crime index
Crime - Property crime index
Crime - Murders per 100,000 population (5 year average)
Crime - Rapes per 100,000 population (5 year average)
Crime - Robberies per 100,000 population (5 year average)
Crime - Assaults per 100,000 population (5 year average)
Crime - Burglaries per 100,000 population (5 year average)
Crime - Thefts per 100,000 population (5 year average)
Crime - Auto thefts per 100,000 population (5 year average)
Crime - Arson per 100,000 population (5 year average)
Crime - City-data.com crime index (5 year average)
Crime - Violent crime index (5 year average)
Crime - Property crime index (5 year average)
1996 Presidential Elections Results (%) - Democratic Party (Clinton)
1996 Presidential Elections Results (%) - Republican Party (Dole)
1996 Presidential Elections Results (%) - Other
2000 Presidential Elections Results (%) - Democratic Party (Gore)
2000 Presidential Elections Results (%) - Republican Party (Bush)
2000 Presidential Elections Results (%) - Other
2004 Presidential Elections Results (%) - Democratic Party (Kerry)
2004 Presidential Elections Results (%) - Republican Party (Bush)
2004 Presidential Elections Results (%) - Other
2008 Presidential Elections Results (%) - Democratic Party (Obama)
2008 Presidential Elections Results (%) - Republican Party (McCain)
2008 Presidential Elections Results (%) - Other
2012 Presidential Elections Results (%) - Democratic Party (Obama)
2012 Presidential Elections Results (%) - Republican Party (Romney)
2012 Presidential Elections Results (%) - Other
2016 Presidential Elections Results (%) - Democratic Party (Clinton)
2016 Presidential Elections Results (%) - Republican Party (Trump)
2016 Presidential Elections Results (%) - Other
2020 Presidential Elections Results (%) - Democratic Party (Biden)
2020 Presidential Elections Results (%) - Republican Party (Trump)
2020 Presidential Elections Results (%) - Other
Ancestries Reported - Arab (%)
Ancestries Reported - Czech (%)
Ancestries Reported - Danish (%)
Ancestries Reported - Dutch (%)
Ancestries Reported - English (%)
Ancestries Reported - French (%)
Ancestries Reported - French Canadian (%)
Ancestries Reported - German (%)
Ancestries Reported - Greek (%)
Ancestries Reported - Hungarian (%)
Ancestries Reported - Irish (%)
Ancestries Reported - Italian (%)
Ancestries Reported - Lithuanian (%)
Ancestries Reported - Norwegian (%)
Ancestries Reported - Polish (%)
Ancestries Reported - Portuguese (%)
Ancestries Reported - Russian (%)
Ancestries Reported - Scotch-Irish (%)
Ancestries Reported - Scottish (%)
Ancestries Reported - Slovak (%)
Ancestries Reported - Subsaharan African (%)
Ancestries Reported - Swedish (%)
Ancestries Reported - Swiss (%)
Ancestries Reported - Ukrainian (%)
Ancestries Reported - United States (%)
Ancestries Reported - Welsh (%)
Ancestries Reported - West Indian (%)
Ancestries Reported - Other (%)
Educational Attainment - No schooling completed (%)
Educational Attainment - Less than high school (%)
Educational Attainment - High school or equivalent (%)
Educational Attainment - Less than 1 year of college (%)
Educational Attainment - 1 or more years of college (%)
Educational Attainment - Associate degree (%)
Educational Attainment - Bachelor's degree (%)
Educational Attainment - Master's degree (%)
Educational Attainment - Professional school degree (%)
Educational Attainment - Doctorate degree (%)
School Enrollment - Nursery, preschool (%)
School Enrollment - Kindergarten (%)
School Enrollment - Grade 1 to 4 (%)
School Enrollment - Grade 5 to 8 (%)
School Enrollment - Grade 9 to 12 (%)
School Enrollment - College undergrad (%)
School Enrollment - Graduate or professional (%)
School Enrollment - Not enrolled in school (%)
School enrollment - Public schools (%)
School enrollment - Private schools (%)
School enrollment - Not enrolled (%)
Median number of rooms in houses and condos
Median number of rooms in apartments
Housing units lacking complete plumbing facilities (%)
Housing units lacking complete kitchen facilities (%)
Density of houses
Urban houses (%)
Rural houses (%)
Households with people 60 years and over (%)
Households with people 65 years and over (%)
Households with people 75 years and over (%)
Households with one or more nonrelatives (%)
Households with no nonrelatives (%)
Population in households (%)
Family households (%)
Nonfamily households (%)
Population in families (%)
Family households with own children (%)
Median number of bedrooms in owner occupied houses
Mean number of bedrooms in owner occupied houses
Median number of bedrooms in renter occupied houses
Mean number of bedrooms in renter occupied houses
Median number of vehichles in owner occupied houses
Mean number of vehichles in owner occupied houses
Median number of vehichles in renter occupied houses
Mean number of vehichles in renter occupied houses
Mortgage status - with mortgage (%)
Mortgage status - with second mortgage (%)
Mortgage status - with home equity loan (%)
Mortgage status - with both second mortgage and home equity loan (%)
Mortgage status - without a mortgage (%)
Average family size
Average family size - White
Average family size - Black or African American
Average family size - Asian
Average family size - Hispanic or Latino
Average family size - American Indian and Alaska Native
Average family size - Multirace
Average family size - Other Race
Geographical mobility - Same house 1 year ago (%)
Geographical mobility - Moved within same county (%)
Geographical mobility - Moved from different county within same state (%)
Geographical mobility - Moved from different state (%)
Geographical mobility - Moved from abroad (%)
Place of birth - Born in state of residence (%)
Place of birth - Born in other state (%)
Place of birth - Native, outside of US (%)
Place of birth - Foreign born (%)
Housing units in structures - 1, detached (%)
Housing units in structures - 1, attached (%)
Housing units in structures - 2 (%)
Housing units in structures - 3 or 4 (%)
Housing units in structures - 5 to 9 (%)
Housing units in structures - 10 to 19 (%)
Housing units in structures - 20 to 49 (%)
Housing units in structures - 50 or more (%)
Housing units in structures - Mobile home (%)
Housing units in structures - Boat, RV, van, etc. (%)
House/condo owner moved in on average (years ago)
Renter moved in on average (years ago)
Year householder moved into unit - Moved in 1999 to March 2000 (%)
Year householder moved into unit - Moved in 1995 to 1998 (%)
Year householder moved into unit - Moved in 1990 to 1994 (%)
Year householder moved into unit - Moved in 1980 to 1989 (%)
Year householder moved into unit - Moved in 1970 to 1979 (%)
Year householder moved into unit - Moved in 1969 or earlier (%)
Means of transportation to work - Drove car alone (%)
Means of transportation to work - Carpooled (%)
Means of transportation to work - Public transportation (%)
Means of transportation to work - Bus or trolley bus (%)
Means of transportation to work - Streetcar or trolley car (%)
Means of transportation to work - Subway or elevated (%)
Means of transportation to work - Railroad (%)
Means of transportation to work - Ferryboat (%)
Means of transportation to work - Taxicab (%)
Means of transportation to work - Motorcycle (%)
Means of transportation to work - Bicycle (%)
Means of transportation to work - Walked (%)
Means of transportation to work - Other means (%)
Working at home (%)
Industry diversity
Most Common Industries - Agriculture, forestry, fishing and hunting, and mining (%)
Most Common Industries - Agriculture, forestry, fishing and hunting (%)
Most Common Industries - Mining, quarrying, and oil and gas extraction (%)
Most Common Industries - Construction (%)
Most Common Industries - Manufacturing (%)
Most Common Industries - Wholesale trade (%)
Most Common Industries - Retail trade (%)
Most Common Industries - Transportation and warehousing, and utilities (%)
Most Common Industries - Transportation and warehousing (%)
Most Common Industries - Utilities (%)
Most Common Industries - Information (%)
Most Common Industries - Finance and insurance, and real estate and rental and leasing (%)
Most Common Industries - Finance and insurance (%)
Most Common Industries - Real estate and rental and leasing (%)
Most Common Industries - Professional, scientific, and management, and administrative and waste management services (%)
Most Common Industries - Professional, scientific, and technical services (%)
Most Common Industries - Management of companies and enterprises (%)
Most Common Industries - Administrative and support and waste management services (%)
Most Common Industries - Educational services, and health care and social assistance (%)
Most Common Industries - Educational services (%)
Most Common Industries - Health care and social assistance (%)
Most Common Industries - Arts, entertainment, and recreation, and accommodation and food services (%)
Most Common Industries - Arts, entertainment, and recreation (%)
Most Common Industries - Accommodation and food services (%)
Most Common Industries - Other services, except public administration (%)
Most Common Industries - Public administration (%)
Occupation diversity
Most Common Occupations - Management, business, science, and arts occupations (%)
Most Common Occupations - Management, business, and financial occupations (%)
Most Common Occupations - Management occupations (%)
Most Common Occupations - Business and financial operations occupations (%)
Most Common Occupations - Computer, engineering, and science occupations (%)
Most Common Occupations - Computer and mathematical occupations (%)
Most Common Occupations - Architecture and engineering occupations (%)
Most Common Occupations - Life, physical, and social science occupations (%)
Most Common Occupations - Education, legal, community service, arts, and media occupations (%)
Most Common Occupations - Community and social service occupations (%)
Most Common Occupations - Legal occupations (%)
Most Common Occupations - Education, training, and library occupations (%)
Most Common Occupations - Arts, design, entertainment, sports, and media occupations (%)
Most Common Occupations - Healthcare practitioners and technical occupations (%)
Most Common Occupations - Health diagnosing and treating practitioners and other technical occupations (%)
Most Common Occupations - Health technologists and technicians (%)
Most Common Occupations - Service occupations (%)
Most Common Occupations - Healthcare support occupations (%)
Most Common Occupations - Protective service occupations (%)
Most Common Occupations - Fire fighting and prevention, and other protective service workers including supervisors (%)
Most Common Occupations - Law enforcement workers including supervisors (%)
Most Common Occupations - Food preparation and serving related occupations (%)
Most Common Occupations - Building and grounds cleaning and maintenance occupations (%)
Most Common Occupations - Personal care and service occupations (%)
Most Common Occupations - Sales and office occupations (%)
Most Common Occupations - Sales and related occupations (%)
Most Common Occupations - Office and administrative support occupations (%)
Most Common Occupations - Natural resources, construction, and maintenance occupations (%)
Most Common Occupations - Farming, fishing, and forestry occupations (%)
Most Common Occupations - Construction and extraction occupations (%)
Most Common Occupations - Installation, maintenance, and repair occupations (%)
Most Common Occupations - Production, transportation, and material moving occupations (%)
Most Common Occupations - Production occupations (%)
Most Common Occupations - Transportation occupations (%)
Most Common Occupations - Material moving occupations (%)
People in Group quarters - Institutionalized population (%)
People in Group quarters - Correctional institutions (%)
People in Group quarters - Federal prisons and detention centers (%)
People in Group quarters - Halfway houses (%)
People in Group quarters - Local jails and other confinement facilities (including police lockups) (%)
People in Group quarters - Military disciplinary barracks (%)
People in Group quarters - State prisons (%)
People in Group quarters - Other types of correctional institutions (%)
People in Group quarters - Nursing homes (%)
People in Group quarters - Hospitals/wards, hospices, and schools for the handicapped (%)
People in Group quarters - Hospitals/wards and hospices for chronically ill (%)
People in Group quarters - Hospices or homes for chronically ill (%)
People in Group quarters - Military hospitals or wards for chronically ill (%)
People in Group quarters - Other hospitals or wards for chronically ill (%)
People in Group quarters - Hospitals or wards for drug/alcohol abuse (%)
People in Group quarters - Mental (Psychiatric) hospitals or wards (%)
People in Group quarters - Schools, hospitals, or wards for the mentally retarded (%)
People in Group quarters - Schools, hospitals, or wards for the physically handicapped (%)
People in Group quarters - Institutions for the deaf (%)
People in Group quarters - Institutions for the blind (%)
People in Group quarters - Orthopedic wards and institutions for the physically handicapped (%)
People in Group quarters - Wards in general hospitals for patients who have no usual home elsewhere (%)
People in Group quarters - Wards in military hospitals for patients who have no usual home elsewhere (%)
People in Group quarters - Juvenile institutions (%)
People in Group quarters - Long-term care (%)
People in Group quarters - Homes for abused, dependent, and neglected children (%)
People in Group quarters - Residential treatment centers for emotionally disturbed children (%)
People in Group quarters - Training schools for juvenile delinquents (%)
People in Group quarters - Short-term care, detention or diagnostic centers for delinquent children (%)
People in Group quarters - Type of juvenile institution unknown (%)
People in Group quarters - Noninstitutionalized population (%)
People in Group quarters - College dormitories (includes college quarters off campus) (%)
People in Group quarters - Military quarters (%)
People in Group quarters - On base (%)
People in Group quarters - Barracks, unaccompanied personnel housing (UPH), (Enlisted/Officer), ;and similar group living quarters for military personnel (%)
People in Group quarters - Transient quarters for temporary residents (%)
People in Group quarters - Military ships (%)
People in Group quarters - Group homes (%)
People in Group quarters - Homes or halfway houses for drug/alcohol abuse (%)
People in Group quarters - Homes for the mentally ill (%)
People in Group quarters - Homes for the mentally retarded (%)
People in Group quarters - Homes for the physically handicapped (%)
People in Group quarters - Other group homes (%)
People in Group quarters - Religious group quarters (%)
People in Group quarters - Dormitories (%)
People in Group quarters - Agriculture workers' dormitories on farms (%)
People in Group quarters - Job Corps and vocational training facilities (%)
People in Group quarters - Other workers' dormitories (%)
People in Group quarters - Crews of maritime vessels (%)
People in Group quarters - Other nonhousehold living situations (%)
People in Group quarters - Other noninstitutional group quarters (%)
Residents speaking English at home (%)
Residents speaking English at home - Born in the United States (%)
Residents speaking English at home - Native, born elsewhere (%)
Residents speaking English at home - Foreign born (%)
Residents speaking Spanish at home (%)
Residents speaking Spanish at home - Born in the United States (%)
Residents speaking Spanish at home - Native, born elsewhere (%)
Residents speaking Spanish at home - Foreign born (%)
Residents speaking other language at home (%)
Residents speaking other language at home - Born in the United States (%)
Residents speaking other language at home - Native, born elsewhere (%)
Residents speaking other language at home - Foreign born (%)
Class of Workers - Employee of private company (%)
Class of Workers - Self-employed in own incorporated business (%)
Class of Workers - Private not-for-profit wage and salary workers (%)
Class of Workers - Local government workers (%)
Class of Workers - State government workers (%)
Class of Workers - Federal government workers (%)
Class of Workers - Self-employed workers in own not incorporated business and Unpaid family workers (%)
House heating fuel used in houses and condos - Utility gas (%)
House heating fuel used in houses and condos - Bottled, tank, or LP gas (%)
House heating fuel used in houses and condos - Electricity (%)
House heating fuel used in houses and condos - Fuel oil, kerosene, etc. (%)
House heating fuel used in houses and condos - Coal or coke (%)
House heating fuel used in houses and condos - Wood (%)
House heating fuel used in houses and condos - Solar energy (%)
House heating fuel used in houses and condos - Other fuel (%)
House heating fuel used in houses and condos - No fuel used (%)
House heating fuel used in apartments - Utility gas (%)
House heating fuel used in apartments - Bottled, tank, or LP gas (%)
House heating fuel used in apartments - Electricity (%)
House heating fuel used in apartments - Fuel oil, kerosene, etc. (%)
House heating fuel used in apartments - Coal or coke (%)
House heating fuel used in apartments - Wood (%)
House heating fuel used in apartments - Solar energy (%)
House heating fuel used in apartments - Other fuel (%)
House heating fuel used in apartments - No fuel used (%)
Armed forces status - In Armed Forces (%)
Armed forces status - Civilian (%)
Armed forces status - Civilian - Veteran (%)
Armed forces status - Civilian - Nonveteran (%)
Fatal accidents locations in years 2005-2021
Fatal accidents locations in 2005
Fatal accidents locations in 2006
Fatal accidents locations in 2007
Fatal accidents locations in 2008
Fatal accidents locations in 2009
Fatal accidents locations in 2010
Fatal accidents locations in 2011
Fatal accidents locations in 2012
Fatal accidents locations in 2013
Fatal accidents locations in 2014
Fatal accidents locations in 2015
Fatal accidents locations in 2016
Fatal accidents locations in 2017
Fatal accidents locations in 2018
Fatal accidents locations in 2019
Fatal accidents locations in 2020
Fatal accidents locations in 2021
Alcohol use - People drinking some alcohol every month (%)
Alcohol use - People not drinking at all (%)
Alcohol use - Average days/month drinking alcohol
Alcohol use - Average drinks/week
Alcohol use - Average days/year people drink much
Audiometry - Average condition of hearing (%)
Audiometry - People that can hear a whisper from across a quiet room (%)
Audiometry - People that can hear normal voice from across a quiet room (%)
Audiometry - Ears ringing, roaring, buzzing (%)
Audiometry - Had a job exposure to loud noise (%)
Audiometry - Had off-work exposure to loud noise (%)
Blood Pressure & Cholesterol - Has high blood pressure (%)
Blood Pressure & Cholesterol - Checking blood pressure at home (%)
Blood Pressure & Cholesterol - Frequently checking blood cholesterol (%)
Blood Pressure & Cholesterol - Has high cholesterol level (%)
Consumer Behavior - Money monthly spent on food at supermarket/grocery store
Consumer Behavior - Money monthly spent on food at other stores
Consumer Behavior - Money monthly spent on eating out
Consumer Behavior - Money monthly spent on carryout/delivered foods
Consumer Behavior - Income spent on food at supermarket/grocery store (%)
Consumer Behavior - Income spent on food at other stores (%)
Consumer Behavior - Income spent on eating out (%)
Consumer Behavior - Income spent on carryout/delivered foods (%)
Current Health Status - General health condition (%)
Current Health Status - Blood donors (%)
Current Health Status - Has blood ever tested for HIV virus (%)
Current Health Status - Left-handed people (%)
Dermatology - People using sunscreen (%)
Diabetes - Diabetics (%)
Diabetes - Had a blood test for high blood sugar (%)
Diabetes - People taking insulin (%)
Diet Behavior & Nutrition - Diet health (%)
Diet Behavior & Nutrition - Milk product consumption (# of products/month)
Diet Behavior & Nutrition - Meals not home prepared (#/week)
Diet Behavior & Nutrition - Meals from fast food or pizza place (#/week)
Diet Behavior & Nutrition - Ready-to-eat foods (#/month)
Diet Behavior & Nutrition - Frozen meals/pizza (#/month)
Drug Use - People that ever used marijuana or hashish (%)
Drug Use - Ever used hard drugs (%)
Drug Use - Ever used any form of cocaine (%)
Drug Use - Ever used heroin (%)
Drug Use - Ever used methamphetamine (%)
Health Insurance - People covered by health insurance (%)
Kidney Conditions-Urology - Avg. # of times urinating at night
Medical Conditions - People with asthma (%)
Medical Conditions - People with anemia (%)
Medical Conditions - People with psoriasis (%)
Medical Conditions - People with overweight (%)
Medical Conditions - Elderly people having difficulties in thinking or remembering (%)
Medical Conditions - People who ever received blood transfusion (%)
Medical Conditions - People having trouble seeing even with glass/contacts (%)
Medical Conditions - People with arthritis (%)
Medical Conditions - People with gout (%)
Medical Conditions - People with congestive heart failure (%)
Medical Conditions - People with coronary heart disease (%)
Medical Conditions - People with angina pectoris (%)
Medical Conditions - People who ever had heart attack (%)
Medical Conditions - People who ever had stroke (%)
Medical Conditions - People with emphysema (%)
Medical Conditions - People with thyroid problem (%)
Medical Conditions - People with chronic bronchitis (%)
Medical Conditions - People with any liver condition (%)
Medical Conditions - People who ever had cancer or malignancy (%)
Mental Health - People who have little interest in doing things (%)
Mental Health - People feeling down, depressed, or hopeless (%)
Mental Health - People who have trouble sleeping or sleeping too much (%)
Mental Health - People feeling tired or having little energy (%)
Mental Health - People with poor appetite or overeating (%)
Mental Health - People feeling bad about themself (%)
Mental Health - People who have trouble concentrating on things (%)
Mental Health - People moving or speaking slowly or too fast (%)
Mental Health - People having thoughts they would be better off dead (%)
Oral Health - Average years since last visit a dentist
Oral Health - People embarrassed because of mouth (%)
Oral Health - People with gum disease (%)
Oral Health - General health of teeth and gums (%)
Oral Health - Average days a week using dental floss/device
Oral Health - Average days a week using mouthwash for dental problem
Oral Health - Average number of teeth
Pesticide Use - Households using pesticides to control insects (%)
Pesticide Use - Households using pesticides to kill weeds (%)
Physical Activity - People doing vigorous-intensity work activities (%)
Physical Activity - People doing moderate-intensity work activities (%)
Physical Activity - People walking or bicycling (%)
Physical Activity - People doing vigorous-intensity recreational activities (%)
Physical Activity - People doing moderate-intensity recreational activities (%)
Physical Activity - Average hours a day doing sedentary activities
Physical Activity - Average hours a day watching TV or videos
Physical Activity - Average hours a day using computer
Physical Functioning - People having limitations keeping them from working (%)
Physical Functioning - People limited in amount of work they can do (%)
Physical Functioning - People that need special equipment to walk (%)
Physical Functioning - People experiencing confusion/memory problems (%)
Physical Functioning - People requiring special healthcare equipment (%)
Prescription Medications - Average number of prescription medicines taking
Preventive Aspirin Use - Adults 40+ taking low-dose aspirin (%)
Reproductive Health - Vaginal deliveries (%)
Reproductive Health - Cesarean deliveries (%)
Reproductive Health - Deliveries resulted in a live birth (%)
Reproductive Health - Pregnancies resulted in a delivery (%)
Reproductive Health - Women breastfeeding newborns (%)
Reproductive Health - Women that had a hysterectomy (%)
Reproductive Health - Women that had both ovaries removed (%)
Reproductive Health - Women that have ever taken birth control pills (%)
Reproductive Health - Women taking birth control pills (%)
Reproductive Health - Women that have ever used Depo-Provera or injectables (%)
Reproductive Health - Women that have ever used female hormones (%)
Sexual Behavior - People 18+ that ever had sex (vaginal, anal, or oral) (%)
Sexual Behavior - Males 18+ that ever had vaginal sex with a woman (%)
Sexual Behavior - Males 18+ that ever performed oral sex on a woman (%)
Sexual Behavior - Males 18+ that ever had anal sex with a woman (%)
Sexual Behavior - Males 18+ that ever had any sex with a man (%)
Sexual Behavior - Females 18+ that ever had vaginal sex with a man (%)
Sexual Behavior - Females 18+ that ever performed oral sex on a man (%)
Sexual Behavior - Females 18+ that ever had anal sex with a man (%)
Sexual Behavior - Females 18+ that ever had any kind of sex with a woman (%)
Sexual Behavior - Average age people first had sex
Sexual Behavior - Average number of female sex partners in lifetime (males 18+)
Sexual Behavior - Average number of female vaginal sex partners in lifetime (males 18+)
Sexual Behavior - Average age people first performed oral sex on a woman (18+)
Sexual Behavior - Average number of woman performed oral sex on in lifetime (18+)
Sexual Behavior - Average number of male sex partners in lifetime (males 18+)
Sexual Behavior - Average number of male anal sex partners in lifetime (males 18+)
Sexual Behavior - Average age people first performed oral sex on a man (18+)
Sexual Behavior - Average number of male oral sex partners in lifetime (18+)
Sexual Behavior - People using protection when performing oral sex (%)
Sexual Behavior - Average number of times people have vaginal or anal sex a year
Sexual Behavior - People having sex without condom (%)
Sexual Behavior - Average number of male sex partners in lifetime (females 18+)
Sexual Behavior - Average number of male vaginal sex partners in lifetime (females 18+)
Sexual Behavior - Average number of female sex partners in lifetime (females 18+)
Sexual Behavior - Circumcised males 18+ (%)
Sleep Disorders - Average hours sleeping at night
Sleep Disorders - People that has trouble sleeping (%)
Smoking-Cigarette Use - People smoking cigarettes (%)
Taste & Smell - People 40+ having problems with smell (%)
Taste & Smell - People 40+ having problems with taste (%)
Taste & Smell - People 40+ that ever had wisdom teeth removed (%)
Taste & Smell - People 40+ that ever had tonsils teeth removed (%)
Taste & Smell - People 40+ that ever had a loss of consciousness because of a head injury (%)
Taste & Smell - People 40+ that ever had a broken nose or other serious injury to face or skull (%)
Taste & Smell - People 40+ that ever had two or more sinus infections (%)
Weight - Average height (inches)
Weight - Average weight (pounds)
Weight - Average BMI
Weight - People that are obese (%)
Weight - People that ever were obese (%)
Weight - People trying to lose weight (%)
100%
urban population.
Estimated median house/condo value in 2022: $635,053
11429:
$635,053New York:
$400,400
According to our research of New York and other state lists, there were 20 registered sex offenders living in 11429 zip code as of April 27, 2024 . The ratio of all residents to sex offenders in zip code 11429 is 1,356 to 1.The ratio of registered sex offenders to all residents in this zip code is lower than the state average.
Median resident age: This zip code:
42.5 yearsNew York median age:
40.0 years
Average household size: This zip code:
3.3 peopleNew York:
2.5 people
Averages for the 2020 tax year for zip code 11429, filed in 2021:
Average Adjusted Gross Income (AGI) in 2020: $49,395 (Individual Income Tax Returns) Here:
$49,395State:
$90,930
Salary/wage: $46,694 (reported on 82.8% of returns )Here:
$46,694State:
$72,104
(% of AGI for various income ranges: 1026.4% for AGIs below $25k , 3670.1% for AGIs $25k-50k , 6762.3% for AGIs $50k-75k , 10237.7% for AGIs $75k-100k , 17789.0% for AGIs $100k-200k , 50985.0% for AGIs over 200k ) Taxable interest for individuals: $337 (reported on 21.6% of returns )This zip code:
$337New York:
$3,075
(% of AGI for various income ranges: 5.5% for AGIs below $25k , 5.7% for AGIs $25k-50k , 7.7% for AGIs $50k-75k , 20.5% for AGIs $75k-100k , 34.4% for AGIs $100k-200k , 102.5% for AGIs over 200k ) Ordinary dividends: $1,051 (reported on 7.3% of returns )(% of AGI for various income ranges: 3.2% for AGIs below $25k , 3.2% for AGIs $25k-50k , 8.4% for AGIs $50k-75k , 24.5% for AGIs $75k-100k , 53.2% for AGIs $100k-200k , 127.5% for AGIs over 200k ) Net capital gain/loss in AGI: +$3,678 (reported on 7.9% of returns )Here:
+$3,678State:
+$44,925
(% of AGI for various income ranges: 1.4% for AGIs $25k-50k , 8.1% for AGIs $50k-75k , 26.8% for AGIs $75k-100k , 152.9% for AGIs $100k-200k , 5942.5% for AGIs over 200k ) Profit/loss from business: +$3,997 (reported on 17.3% of returns )Here:
+$3,997State:
+$14,940
(% of AGI for various income ranges: 148.3% for AGIs below $25k , 57.7% for AGIs $25k-50k , 66.3% for AGIs $50k-75k , 98.2% for AGIs $75k-100k , 96.9% for AGIs $100k-200k ) Taxable individual retirement arrangement distribution: $9,770 (reported on 2.7% of returns )11429:
$9,770New York:
$19,609
(% of AGI for various income ranges: 11.5% for AGIs below $25k , 17.4% for AGIs $25k-50k , 36.7% for AGIs $50k-75k , 89.5% for AGIs $75k-100k , 152.0% for AGIs $100k-200k ) Total itemized deductions: $26,671 (reported on 14.3% of returns )Here:
$26,671State:
$39,326
(% of AGI for various income ranges: 68.3% for AGIs below $25k , 204.4% for AGIs $25k-50k , 610.9% for AGIs $50k-75k , 1391.7% for AGIs $75k-100k , 2235.5% for AGIs $100k-200k , 5900.0% for AGIs over 200k ) Charity contributions: $5,792 (reported on 11.4% of returns )(% of AGI for various income ranges: 3.8% for AGIs below $25k , 25.1% for AGIs $25k-50k , 101.3% for AGIs $50k-75k , 255.1% for AGIs $75k-100k , 435.2% for AGIs $100k-200k , 1472.5% for AGIs over 200k ) Taxes paid: $8,728 (reported on 14.2% of returns )(% of AGI for various income ranges: 16.9% for AGIs below $25k , 59.7% for AGIs $25k-50k , 202.5% for AGIs $50k-75k , 481.2% for AGIs $75k-100k , 758.1% for AGIs $100k-200k , 1557.5% for AGIs over 200k ) Earned income credit: $1,991 (reported on 18.4% of returns )(% of AGI for various income ranges: 97.1% for AGIs below $25k , 57.1% for AGIs $25k-50k ) Percentage of individuals using paid preparers for their 2020 taxes: 93.5%(% for various income ranges: 90.8% for AGIs below $25k , 95.6% for AGIs $25k-50k , 94.0% for AGIs $50k-75k , 95.0% for AGIs $75k-100k , 93.9% for AGIs $100k-200k , 100.0% for AGIs over 200k )
Averages for the 2012 tax year for zip code 11429, filed in 2013:
Average Adjusted Gross Income (AGI) in 2012: $39,843 (Individual Income Tax Returns) Here:
$39,843State:
$77,088
Salary/wage: $39,371 (reported on 84.7% of returns )Here:
$39,371State:
$60,593
(% of AGI for various income ranges: 72.1% for AGIs below $25k , 88.0% for AGIs $25k-50k , 84.7% for AGIs $50k-75k , 86.6% for AGIs $75k-100k , 84.6% for AGIs $100k-200k , 69.1% for AGIs over 200k ) Taxable interest for individuals: $327 (reported on 24.1% of returns )This zip code:
$327New York:
$3,125
(% of AGI for various income ranges: 0.3% for AGIs below $25k , 0.1% for AGIs $25k-50k , 0.2% for AGIs $50k-75k , 0.1% for AGIs $75k-100k , 0.2% for AGIs $100k-200k , 0.8% for AGIs over 200k ) Ordinary dividends: $1,591 (reported on 6.8% of returns )(% of AGI for various income ranges: 0.2% for AGIs below $25k , 0.5% for AGIs $25k-50k , 0.2% for AGIs $50k-75k , 0.2% for AGIs $75k-100k , 0.2% for AGIs $100k-200k ) Profit/loss from business: +$6,392 (reported on 14.6% of returns )Here:
+$6,392State:
+$16,168
(% of AGI for various income ranges: 12.5% for AGIs below $25k , 1.1% for AGIs $25k-50k , 0.7% for AGIs $50k-75k , 0.5% for AGIs $75k-100k , 0.5% for AGIs $100k-200k ) Taxable individual retirement arrangement distribution: $8,488 (reported on 3.8% of returns )11429:
$8,488New York:
$17,621
(% of AGI for various income ranges: 0.9% for AGIs below $25k , 0.7% for AGIs $25k-50k , 1.0% for AGIs $50k-75k , 0.8% for AGIs $75k-100k , 0.9% for AGIs $100k-200k ) Total itemized deductions: $21,520 (32% of AGI, reported on 37.9% of returns )Here:
$21,520State:
$34,985
Here:
32.3% of AGIState:
21.3% of AGI
(% of AGI for various income ranges: 9.8% for AGIs below $25k , 17.5% for AGIs $25k-50k , 23.7% for AGIs $50k-75k , 25.7% for AGIs $75k-100k , 24.1% for AGIs $100k-200k , 17.7% for AGIs over 200k ) Charity contributions: $3,243 (reported on 32.6% of returns )(% of AGI for various income ranges: 1.0% for AGIs below $25k , 2.4% for AGIs $25k-50k , 3.3% for AGIs $50k-75k , 3.2% for AGIs $75k-100k , 3.1% for AGIs $100k-200k , 2.2% for AGIs over 200k ) Taxes paid: $7,178 (reported on 37.8% of returns )11429:
$7,178State:
$18,656
(% of AGI for various income ranges: 1.9% for AGIs below $25k , 4.6% for AGIs $25k-50k , 7.6% for AGIs $50k-75k , 9.3% for AGIs $75k-100k , 9.8% for AGIs $100k-200k , 10.4% for AGIs over 200k ) Earned income credit: $2,156 (reported on 25.6% of returns )(% of AGI for various income ranges: 8.0% for AGIs below $25k , 1.1% for AGIs $25k-50k ) Percentage of individuals using paid preparers for their 2012 taxes: 71.7%(% for various income ranges: 69.6% for AGIs below $25k , 72.0% for AGIs $25k-50k , 72.4% for AGIs $50k-75k , 76.6% for AGIs $75k-100k , 77.2% for AGIs $100k-200k , 75.0% for AGIs over 200k )
Averages for the 2004 tax year for zip code 11429, filed in 2005:
Average Adjusted Gross Income (AGI) in 2004: $34,651 (Individual Income Tax Returns) Here:
$34,651State:
$59,519
Salary/wage: $34,853 (reported on 88.1% of returns )Here:
$34,853State:
$50,673
(% of AGI for various income ranges: 79.0% for AGIs below $10k , 82.8% for AGIs $10k-25k , 92.0% for AGIs $25k-50k , 91.0% for AGIs $50k-75k , 88.0% for AGIs $75k-100k , 83.7% for AGIs over 100k ) Taxable interest for individuals: $395 (reported on 36.6% of returns )This zip code:
$395New York:
$2,377
(% of AGI for various income ranges: 1.1% for AGIs below $10k , 0.5% for AGIs $10k-25k , 0.4% for AGIs $25k-50k , 0.3% for AGIs $50k-75k , 0.5% for AGIs $75k-100k , 0.5% for AGIs over 100k ) Taxable dividends: $741 (reported on 9.6% of returns )(% of AGI for various income ranges: 0.3% for AGIs below $10k , 0.2% for AGIs $10k-25k , 0.2% for AGIs $25k-50k , 0.2% for AGIs $50k-75k , 0.2% for AGIs $75k-100k , 0.4% for AGIs over 100k ) Net capital gain/loss: +$3,059 (reported on 5.2% of returns )Here:
+$3,059State:
+$23,581
(% of AGI for various income ranges: -0.2% for AGIs below $10k , 0.2% for AGIs $10k-25k , -0.0% for AGIs $25k-50k , 0.1% for AGIs $50k-75k , 0.2% for AGIs $75k-100k , 3.2% for AGIs over 100k ) Profit/loss from business: +$5,144 (reported on 11.5% of returns )Here:
+$5,144State:
+$13,809
(% of AGI for various income ranges: 19.6% for AGIs below $10k , 6.5% for AGIs $10k-25k , 0.6% for AGIs $25k-50k , 0.4% for AGIs $50k-75k , 0.0% for AGIs $75k-100k , 0.1% for AGIs over 100k ) IRA payment deduction: $2,054 (reported on 1.1% of returns )11429:
$2,054New York:
$3,115
Total itemized deductions: $19,510 (37% of AGI, reported on 46.0% of returns )Here:
$19,510State:
$25,864
Here:
37.3% of AGIState:
21.9% of AGI
(% of AGI for various income ranges: 9.1% for AGIs below $10k , 15.7% for AGIs $10k-25k , 27.6% for AGIs $25k-50k , 30.4% for AGIs $50k-75k , 28.1% for AGIs $75k-100k , 24.4% for AGIs over 100k ) Charity contributions deductions: $3,430 (6% of AGI, reported on 42.6% of returns )Here:
6.4% of AGIState:
3.6% of AGI
(% of AGI for various income ranges: 0.4% for AGIs below $10k , 2.1% for AGIs $10k-25k , 4.7% for AGIs $25k-50k , 4.9% for AGIs $50k-75k , 4.5% for AGIs $75k-100k , 4.4% for AGIs over 100k ) Total tax: $3,405 (reported on 68.3% of returns )11429:
$3,405State:
$11,730
(% of AGI for various income ranges: 3.6% for AGIs below $10k , 3.1% for AGIs $10k-25k , 4.7% for AGIs $25k-50k , 7.3% for AGIs $50k-75k , 9.1% for AGIs $75k-100k , 12.9% for AGIs over 100k ) Earned income credit: $1,665 (reported on 23.4% of returns )Percentage of individuals using paid preparers for their 2004 taxes: 71.4%(% for various income ranges: 64.8% for AGIs below $10k , 74.2% for AGIs $10k-25k , 71.2% for AGIs $25k-50k , 72.9% for AGIs $50k-75k , 74.9% for AGIs $75k-100k , 72.8% for AGIs over 100k )
Estimated median household income in 2022: This zip code:
$93,570New York:
$79,557
Nearest zip codes: 11428 ,
11411 ,
11427 ,
11412 ,
11423 ,
11426 .
New York Zip Code Map
Percentage of family households: This zip code:
44.2%New York:
41.3%
Percentage of households with unmarried partners: This zip code:
3.7%New York:
42.3%
Likely homosexual households (counted as self-reported same-sex unmarried-partner households)
Lesbian couples: 0.1% of all households Gay men: 0.0% of all households
Household received Food Stamps/SNAP in the past 12 months: 1,374Household did not receive Food Stamps/SNAP in the past 12 months: 6,847
Women who had a birth in the past 12 months: 194 (117 now married , 78 unmarried) Women who did not have a birth in the past 12 months: 6,405 (1,794 now married , 4,636 unmarried)
Housing units in zip code 11429 with a mortgage: 4,115 (294
second mortgage , 176
both second mortgage and home equity loan )
Houses without a mortgage: 31
Median monthly owner costs for units with a mortgage: $2,875
Median monthly owner costs for units without a mortgage: $932
Residents with income below the poverty level in 2022:
This zip code:
8.8%Whole state:
14.3%
Residents with income below 50% of the poverty level in 2022:
This zip code:
4.6%Whole state:
6.8%
Median number of rooms in houses and condos: Median number of rooms in apartments: Notable locations in this zip code not listed on our city pages
Click to draw/clear zip code borders Notable locations in zip code 11429: (A) , Fire Department New York Engine 304 Ladder 162 (B) , New York Ladder Company 162 (C) . Display/hide their locations on the map
Churches in zip code 11429 include: (A) , Hollis Avenue Congregational Church (B) , Grace Lutheran Church (C) , Maranatha Baptist Church (D) , Solid Rock Church of the Nazarene (E) , Bethlehem Missionary Church (F) , Saint Joseph's Episcopal Church (G) , First Revelation Church (H) , Little Sisters of the Poor Convent (I) . Display/hide their locations on the map
Parks in zip code 11429 include: (1) , Pat Williams Playground (2) . Display/hide their locations on the map
Year house built (houses)
0 2020 or later32 2010 to 201961 2000 to 200942 1990 to 199972 1980 to 198981 1970 to 1979715 1960 to 19691,502 1950 to 19591,844 1940 to 19493,947 1939 or earlier
Zip code 11429 household income distribution in 2022 390 Less than $10,000575 $10,000 to $14,999118 $15,000 to $19,99991 $20,000 to $24,999406 $25,000 to $29,999248 $30,000 to $34,999123 $35,000 to $39,999220 $40,000 to $44,99973 $45,000 to $49,999498 $50,000 to $59,999376 $60,000 to $74,9991,126 $75,000 to $99,999787 $100,000 to $124,999835 $125,000 to $149,999975 $150,000 to $199,9991,308 $200,000 or moreEstimate of home value of owner-occupied houses/condos in 2022 in zip code 11429 50 Less than $10,00013 $10,000 to $14,99926 $40,000 to $49,99941 $50,000 to $59,99916 $60,000 to $69,99911 $70,000 to $79,9997 $125,000 to $149,99963 $200,000 to $249,99918 $250,000 to $299,999362 $300,000 to $399,999841 $400,000 to $499,9993,684 $500,000 to $749,999998 $750,000 to $999,999107 $1,000,000 to $1,499,99923 $2,000,000 or moreRent paid by renters in 2022 in zip code 11429 251 $300 to $34922 $450 to $4995 $550 to $5995 $600 to $64976 $700 to $749123 $800 to $89964 $900 to $999265 $1,000 to $1,249376 $1,250 to $1,499527 $1,500 to $1,999233 $2,000 to $2,49932 $2,500 to $2,99947 $3,000 to $3,49927 $3,500 or more165 No cash rent
Median gross rent in 2022: $1,444.
Median price asked for vacant for-sale houses and condos in 2022: $610,151.
Estimated median house (or condo) value in 2022 for: White Non-Hispanic householders: $572,456Black or African American householders: $630,506American Indian or Alaska Native householders: $543,431Asian householders: $620,714Some other race householders: $623,862Two or more races householders: $665,826Hispanic or Latino householders: $644,144Estimated median house or condo value in 2022: $635,053
11429:
$635,053New York:
$400,400
Lower value quartile - upper value quartile: $534,741 - $732,087
Mean price in 2022: Detached houses: $622,860Here:
$622,860State:
$476,719
Townhouses or other attached units: $571,187Here:
$571,187State:
$699,270
In 2-unit structures: $801,831Here:
$801,831State:
$713,077
Housing units in structures:
One, detached: 5,492One, attached: 805Two: 1,4313 or 4: 3255 to 9: 8620 to 49: 7250 or more: 177Unemployment : 8.5%
Means of transportation to work in zip code 11429 43.2% 5,774 Drove a car alone7.0% 931 Carpooled17.1% 2,284 Bus or trolley bus14.4% 1,922 Streetcar or trolley car1.8% 236 Subway or elevated1.1% 145 Taxi0.3% 43 Bicycle2.0% 262 Walked1.5% 204 Other means11.2% 1,493 Worked at homeTravel time to work (commute) in zip code 11429 58 Less than 5 minutes173 5 to 9 minutes318 10 to 14 minutes1,029 15 to 19 minutes949 20 to 24 minutes397 25 to 29 minutes1,736 30 to 34 minutes342 35 to 39 minutes497 40 to 44 minutes1,532 45 to 59 minutes2,782 60 to 89 minutes1,947 90 or more minutes
Neighborhoods in zip code 11429: Percentage of zip code residents living and working in this county: 53.6%
Household type by relationship:
Households: 27,403
Male householders: 3,633 (538 living alone ), Female householders: 4,590 (1,043 living alone )3,597 spouses (3,544 opposite-sex spouses ), 286 unmarried partners , (272 opposite-sex unmarried partners ), 8,748 children (8,385 natural , 110 adopted , 252 stepchildren ), 1,260 grandchildren , 1,003 brothers or sisters , 1,064 parents , 6 foster children , 1,341 other relatives , 1,163 non-relatives In group quarters: 216 (-1 institutionalized population )
Size of family households: 2,033 2-persons , 1,374 3-persons , 1,248 4-persons , 807 5-persons , 403 6-persons , 443 7-or-more-persons
Size of nonfamily households: 1,579 1-person , 184 2-persons , 25 5-persons , 19 7-or-more-persons
2,036 married couples with children. single-parent households (420 men , 742 women ).
69.4% of residents of 11429 zip code speak English at home. of residents speak Spanish at home (51% very well, 29% well, 16% not well, 5% not at all ).of residents speak other Indo-European language at home (43% very well, 35% well, 18% not well, 4% not at all ).of residents speak Asian or Pacific Island language at home (47% very well, 9% well, 34% not well, 10% not at all ).of residents speak other language at home (55% very well, 38% well, 6% not well ).
Foreign born population: 12,505 (45.6%)
(72.8%
of them are naturalized citizens )
This zip code:
45.6%Whole state:
22.7%
28% Haiti 17% Grenada 12% Ecuador 8% St. Vincent and the Grenadines 5% Dominica 4% Afghanistan 2% Malaysia 18% Jamaican 13% Haitian 6% Guyanese 5% Trinidadian and Tobagonian 2% American 1% Nigerian 1% African
Year of entry for the foreign-born population
2,855 2010 or later 2,542 2000 to 2009 2,663 1990 to 1999 4,992 Before 1990
Facilities with environmental interests located in this zip code:
COLONIAL CLEANERS (220-25 HEMPSTEAD AVENUE in QUEENS VILLAGE, NY)
AIR MINOR (AIRS/AFS) STATE MASTER (New York facility tracking) - AIR PROGRAM, HAZARDOUS WASTE PROGRAM Small Quantity Generators, between 100 kg and 1000 kg of hazardous waste/month (Resource Conservation and Recovery Act (tracking hazardous waste)) Business SIC classification: DRYCLEANING PLANTS, EXCEPT RUG CLEANINGBusiness NAICS classification: DRYCLEANING AND LAUNDRY SERVICES (EXCEPT COIN-OPERATED).Organizations: HAN KANG DEVELOPMENT CORP (LEGALLY RESPONSIBLE PARTY)
IGNELZI INTERIORS-98-05 217TH ST (98-05 217TH ST in QUEENS VILLAGE, NY)
AIR MINOR (AIRS/AFS) STATE MASTER (New York facility tracking) - AIR PROGRAM Business SIC classification: WOOD PRODUCTSOrganizations: IGNELZI INTERIORS INC
A.RUBINO (96-20 222 ST. in QUEENS VILLAGE, NY)
AIR MINOR (AIRS/AFS) Business SIC classification: NONCLASSIFIABLE ESTABLISHMENTS
ADVANTAGE VOLKSWAGEN (218-25 HEMPSTEAD AVENUE in QUEENS VILLAGE, NY)
(Resource Conservation and Recovery Act (tracking hazardous waste))
GETTY PETROLEUM CORP #00231 (103-33 SPRINGFIELD AVE in QUEENS, NY)
(Resource Conservation and Recovery Act (tracking hazardous waste))
HERAEUS VOLKERT INC (222-34 96TH AVE in QUEENS VILLAGE, NY)
(Resource Conservation and Recovery Act (tracking hazardous waste))
ION GROUP, INC (107-10 180TH STREET in JAMAICA, NY)
National Pollutant Discharge Elimination System NON-MAJOR (Tracking pollutant discharge elimination systems) - permit Alternative names: ATLANTIC EXPRESS TRANSPORTAT-, ATLANTIC EXPRESS TRANSPORTATIO
CON EDISON (108 ST 50 FEET N OF W BOUND in QUEENS VILLAGE, NY)
(Resource Conservation and Recovery Act (tracking hazardous waste))
J K AUTO BODY (213-23 99TH AVE in QUEENS VILLAGE, NY)
Conditionally Exempt Small Quantity Generators, less than 100 kg/month of hazardous waste (Resource Conservation and Recovery Act (tracking hazardous waste))
BELLACICCO & SONS INCORPORATED (217-44 98TH AVENUE in JAMAICA, NY)
CRITERIA AND HAZARDOUS AIR POLLUTANT INVENTORY (Inventory of air pollution sources)
Housing units lacking complete plumbing facilities: 0.5%
Housing units lacking complete kitchen facilities: 1.2%
82.8% Utility gas 13.0% Fuel oil, kerosene, etc. 2.0% Bottled, tank, or LP gas 1.4% Electricity
Population in 1990: 24,311. Population change in the 1990s: +3,336 (+13.7%).
Place of birth for U.S.-born residents:
This state: 12,415Northeast: 430Midwest: 43South: 1,242West: 55
71% of the 11429 zip code residents lived in the same house 5 years ago.
Out of people who lived in different houses, 68% lived in this county.
Out of people who lived in different counties, 50% lived in New York.
94% of the 11429 zip code residents lived in the same house 1 year ago.
Out of people who lived in different houses, 67% moved from this county.
Out of people who lived in different houses, 21% moved from different county within same state.
Out of people who lived in different houses, 7% moved from different state.
Out of people who lived in different houses, 2% moved from abroad.
Private vs. public school enrollment:
Students in private schools in grades 1 to 8 (elementary and middle school): 357
Students in private schools in grades 9 to 12 (high school): 184
Students in private undergraduate colleges: 444
Occupation by median earnings in the past 12 months ($)
99,978 Health diagnosing and treating practitioners and other technical occupations 99,364 Architecture and engineering occupations 81,710 Legal occupations 78,804 Computer and mathematical occupations 78,322 Business and financial operations occupations 76,160 Community and social service occupations
Companies with federal contracts located in this zip code:
BERTNER THREAD CO INC (217-44 98 AVENUE in QUEENS VILLAGE, NY; small business)
$50,600 with Defense Logistics Agency for Yarn and Thread. Taking place in NC. Signed on 2004-01-13. Completion date: 2004-08-24.
Top industries in this zip code by the number of employees in 2005:
Accommodation and Food Services: Caterers (100-249 employees: 2 establishments, 5-9 employees: 1 establishment)Construction: Plumbing, Heating, and Air-Conditioning Contractors (100-249: 1, 20-49: 1, 10-19: 1, 1-4: 2)Health Care and Social Assistance: Nursing Care Facilities (100-249: 1)Health Care and Social Assistance: Home Health Care Services (100-249: 1)Accommodation and Food Services: Limited-Service Restaurants (20-49: 3, 5-9: 1, 1-4: 3)Construction: Highway, Street, and Bridge Construction (50-99: 1, 10-19: 1, 1-4: 1)Educational Services: Elementary and Secondary Schools (20-49: 2, 5-9: 1)Health Care and Social Assistance: Child Day Care Services (20-49: 1, 10-19: 1, 5-9: 1, 1-4: 6)
People in group quarters in 2010:
68 people in nursing facilities/skilled-nursing facilities
34 people in group homes for juveniles (non-correctional)
25 people in other noninstitutional facilities
15 people in group homes intended for adults
People in group quarters in 2000:
113 people in nursing homes
21 people in religious group quarters
15 people in homes for the mentally retarded
12 people in mental (psychiatric) hospitals or wards
7 people in residential treatment centers for emotionally disturbed children
Fatal accident statistics in 2014:
Fatal accident count: 1Vehicles involved in fatal accidents: 2Fatal accidents caused by drunken drivers: 1Fatalities: 1Persons involved in fatal accidents: 3Pedestrians involved in fatal accidents: 0
Fatal accident statistics in 2013:
Fatal accident count: 1Vehicles involved in fatal accidents: 1Fatal accidents caused by drunken drivers: 1Fatalities: 1Persons involved in fatal accidents: 1Pedestrians involved in fatal accidents: 0
Home Mortgage Disclosure Act Aggregated Statistics For Year 2009(Based on 5 full and 12 partial tracts) A) FHA, FSA/RHS & VA B) Conventional C) Refinancings D) Home Improvement Loans E) Loans on Dwellings For 5+ Families F) Non-occupant Loans on G) Loans On Manufactured Number Average Value Number Average Value Number Average Value Number Average Value Number Average Value Number Average Value Number Average Value
LOANS ORIGINATED 79 $351,153 25 $294,798 221 $270,150 20 $124,157 0 $0 7 $274,176 3 $352,600 APPLICATIONS APPROVED, NOT ACCEPTED 4 $357,020 5 $306,636 46 $289,243 10 $9,492 0 $0 3 $215,197 0 $0 APPLICATIONS DENIED 29 $395,013 30 $312,765 248 $300,979 58 $60,274 0 $0 27 $198,178 0 $0 APPLICATIONS WITHDRAWN 30 $364,752 8 $354,866 110 $292,786 4 $57,712 4 $448,072 5 $222,800 0 $0 FILES CLOSED FOR INCOMPLETENESS 8 $410,955 3 $210,087 32 $301,063 3 $153,840 1 $585,000 0 $0 0 $0
Aggregated Statistics For Year 2008(Based on 5 full and 12 partial tracts) A) FHA, FSA/RHS & VA B) Conventional C) Refinancings D) Home Improvement Loans E) Loans on Dwellings For 5+ Families F) Non-occupant Loans on G) Loans On Manufactured Number Average Value Number Average Value Number Average Value Number Average Value Number Average Value Number Average Value Number Average Value
LOANS ORIGINATED 35 $381,603 105 $361,098 244 $332,955 125 $56,021 4 $4,618,000 32 $358,746 0 $0 APPLICATIONS APPROVED, NOT ACCEPTED 1 $313,000 43 $351,772 67 $304,302 40 $78,775 0 $0 9 $356,796 1 $12,000 APPLICATIONS DENIED 15 $322,431 108 $393,528 369 $350,224 175 $43,938 0 $0 55 $302,166 0 $0 APPLICATIONS WITHDRAWN 20 $424,863 26 $349,413 104 $333,011 9 $160,039 0 $0 8 $327,662 1 $707,760 FILES CLOSED FOR INCOMPLETENESS 1 $258,000 12 $389,079 67 $334,585 10 $217,716 0 $0 2 $292,270 0 $0
Aggregated Statistics For Year 2007(Based on 5 full and 12 partial tracts) A) FHA, FSA/RHS & VA B) Conventional C) Refinancings D) Home Improvement Loans F) Non-occupant Loans on G) Loans On Manufactured Number Average Value Number Average Value Number Average Value Number Average Value Number Average Value Number Average Value
LOANS ORIGINATED 3 $357,333 340 $313,845 665 $301,415 123 $126,348 53 $327,942 1 $13,250 APPLICATIONS APPROVED, NOT ACCEPTED 0 $0 107 $290,190 241 $285,522 47 $124,681 7 $359,939 0 $0 APPLICATIONS DENIED 0 $0 399 $351,707 841 $333,476 221 $113,137 80 $369,435 0 $0 APPLICATIONS WITHDRAWN 1 $368,000 85 $325,596 246 $308,470 22 $171,554 12 $382,005 0 $0 FILES CLOSED FOR INCOMPLETENESS 0 $0 39 $301,620 99 $343,945 12 $152,894 7 $437,371 0 $0
Aggregated Statistics For Year 2006(Based on 5 full and 12 partial tracts) A) FHA, FSA/RHS & VA B) Conventional C) Refinancings D) Home Improvement Loans E) Loans on Dwellings For 5+ Families F) Non-occupant Loans on G) Loans On Manufactured Number Average Value Number Average Value Number Average Value Number Average Value Number Average Value Number Average Value Number Average Value
LOANS ORIGINATED 2 $387,735 740 $269,557 1,010 $289,250 165 $124,672 0 $0 98 $288,112 1 $463,890 APPLICATIONS APPROVED, NOT ACCEPTED 2 $383,720 148 $267,046 219 $283,889 31 $92,124 0 $0 15 $299,800 0 $0 APPLICATIONS DENIED 2 $263,040 601 $280,292 791 $300,961 244 $107,266 2 $3,705 60 $287,822 2 $62,480 APPLICATIONS WITHDRAWN 0 $0 296 $264,755 454 $279,955 56 $200,125 1 $250,000 21 $249,296 0 $0 FILES CLOSED FOR INCOMPLETENESS 0 $0 69 $289,326 173 $296,656 4 $125,468 0 $0 10 $328,562 1 $395,000
Aggregated Statistics For Year 2005(Based on 5 full and 12 partial tracts) A) FHA, FSA/RHS & VA B) Conventional C) Refinancings D) Home Improvement Loans E) Loans on Dwellings For 5+ Families F) Non-occupant Loans on G) Loans On Manufactured Number Average Value Number Average Value Number Average Value Number Average Value Number Average Value Number Average Value Number Average Value
LOANS ORIGINATED 1 $404,250 832 $246,597 1,108 $260,496 153 $129,541 6 $717,613 83 $264,812 0 $0 APPLICATIONS APPROVED, NOT ACCEPTED 2 $383,720 184 $255,673 248 $246,069 36 $125,397 0 $0 27 $276,627 0 $0 APPLICATIONS DENIED 1 $219,000 368 $261,844 821 $258,868 199 $99,781 2 $311,135 52 $308,709 4 $29,982 APPLICATIONS WITHDRAWN 5 $294,022 305 $260,271 553 $242,268 77 $170,895 2 $29,335 70 $272,900 0 $0 FILES CLOSED FOR INCOMPLETENESS 0 $0 70 $255,950 263 $260,830 2 $108,500 0 $0 1 $141,780 0 $0
Aggregated Statistics For Year 2004(Based on 5 full and 12 partial tracts) A) FHA, FSA/RHS & VA B) Conventional C) Refinancings D) Home Improvement Loans E) Loans on Dwellings For 5+ Families F) Non-occupant Loans on G) Loans On Manufactured Number Average Value Number Average Value Number Average Value Number Average Value Number Average Value Number Average Value Number Average Value
LOANS ORIGINATED 30 $274,729 649 $245,912 1,140 $224,253 169 $117,604 2 $528,000 102 $240,911 0 $0 APPLICATIONS APPROVED, NOT ACCEPTED 3 $283,417 175 $291,546 283 $220,702 41 $110,254 0 $0 37 $248,366 0 $0 APPLICATIONS DENIED 4 $274,042 217 $264,662 735 $231,508 220 $72,193 0 $0 62 $253,208 0 $0 APPLICATIONS WITHDRAWN 9 $262,862 201 $239,869 628 $214,611 59 $115,300 0 $0 32 $279,029 2 $28,390 FILES CLOSED FOR INCOMPLETENESS 1 $277,000 46 $244,257 183 $242,211 5 $183,430 0 $0 8 $236,076 0 $0
Aggregated Statistics For Year 2003(Based on 5 full and 12 partial tracts) A) FHA, FSA/RHS & VA B) Conventional C) Refinancings D) Home Improvement Loans E) Loans on Dwellings For 5+ Families F) Non-occupant Loans on Number Average Value Number Average Value Number Average Value Number Average Value Number Average Value Number Average Value
LOANS ORIGINATED 109 $259,229 312 $247,452 1,388 $183,656 106 $28,674 4 $2,288,000 84 $192,509 APPLICATIONS APPROVED, NOT ACCEPTED 8 $241,164 63 $237,257 353 $188,152 45 $38,751 0 $0 31 $192,251 APPLICATIONS DENIED 4 $223,672 110 $231,591 748 $188,149 148 $36,576 0 $0 50 $183,757 APPLICATIONS WITHDRAWN 37 $251,949 85 $258,336 607 $187,716 30 $68,412 0 $0 14 $174,129 FILES CLOSED FOR INCOMPLETENESS 2 $243,000 10 $290,506 103 $181,180 3 $38,333 0 $0 5 $236,068
Aggregated Statistics For Year 2002(Based on 5 full and 12 partial tracts) A) FHA, FSA/RHS & VA B) Conventional C) Refinancings D) Home Improvement Loans E) Loans on Dwellings For 5+ Families F) Non-occupant Loans on Number Average Value Number Average Value Number Average Value Number Average Value Number Average Value Number Average Value
LOANS ORIGINATED 106 $244,540 309 $202,951 915 $162,076 89 $35,754 4 $336,158 50 $178,759 APPLICATIONS APPROVED, NOT ACCEPTED 4 $179,900 47 $217,282 262 $154,585 36 $35,214 0 $0 12 $144,447 APPLICATIONS DENIED 17 $227,700 95 $225,968 571 $157,632 141 $34,387 0 $0 27 $161,692 APPLICATIONS WITHDRAWN 35 $249,700 75 $204,555 432 $158,264 54 $49,733 0 $0 20 $162,362 FILES CLOSED FOR INCOMPLETENESS 5 $266,080 11 $162,325 138 $148,457 10 $32,427 0 $0 11 $118,673
Aggregated Statistics For Year 2001(Based on 5 full and 12 partial tracts) A) FHA, FSA/RHS & VA B) Conventional C) Refinancings D) Home Improvement Loans E) Loans on Dwellings For 5+ Families F) Non-occupant Loans on Number Average Value Number Average Value Number Average Value Number Average Value Number Average Value Number Average Value
LOANS ORIGINATED 142 $219,561 188 $199,739 707 $143,984 84 $46,092 8 $193,246 48 $131,250 APPLICATIONS APPROVED, NOT ACCEPTED 13 $234,614 35 $170,063 228 $132,024 40 $31,644 2 $216,685 13 $155,230 APPLICATIONS DENIED 35 $221,260 54 $215,636 512 $134,235 196 $24,017 0 $0 30 $100,075 APPLICATIONS WITHDRAWN 55 $213,097 44 $202,358 471 $138,634 78 $36,399 0 $0 10 $97,298 FILES CLOSED FOR INCOMPLETENESS 7 $227,341 9 $171,059 114 $146,429 5 $26,528 0 $0 3 $130,747
Aggregated Statistics For Year 2000(Based on 5 full and 12 partial tracts) A) FHA, FSA/RHS & VA B) Conventional C) Refinancings D) Home Improvement Loans E) Loans on Dwellings For 5+ Families F) Non-occupant Loans on Number Average Value Number Average Value Number Average Value Number Average Value Number Average Value Number Average Value
LOANS ORIGINATED 146 $198,473 152 $173,398 335 $111,860 91 $22,152 0 $0 23 $111,310 APPLICATIONS APPROVED, NOT ACCEPTED 13 $183,325 28 $156,676 95 $103,087 70 $21,018 0 $0 6 $149,997 APPLICATIONS DENIED 39 $190,581 107 $149,412 446 $95,890 198 $22,117 4 $330,000 21 $82,230 APPLICATIONS WITHDRAWN 48 $189,310 53 $179,174 483 $86,990 21 $37,943 2 $29,920 13 $143,372 FILES CLOSED FOR INCOMPLETENESS 2 $151,360 8 $148,964 102 $174,505 3 $77,883 0 $0 4 $156,322
Aggregated Statistics For Year 1999(Based on 5 full and 7 partial tracts) A) FHA, FSA/RHS & VA B) Conventional C) Refinancings D) Home Improvement Loans E) Loans on Dwellings For 5+ Families F) Non-occupant Loans on Number Average Value Number Average Value Number Average Value Number Average Value Number Average Value Number Average Value
LOANS ORIGINATED 93 $181,829 107 $162,902 310 $116,878 120 $11,599 8 $263,368 21 $110,758 APPLICATIONS APPROVED, NOT ACCEPTED 7 $169,833 29 $144,606 278 $119,671 42 $26,808 0 $0 15 $119,374 APPLICATIONS DENIED 17 $175,489 66 $148,963 360 $103,942 135 $22,993 3 $524,720 24 $97,029 APPLICATIONS WITHDRAWN 20 $185,527 26 $169,074 281 $98,934 22 $25,859 4 $318,085 13 $111,490 FILES CLOSED FOR INCOMPLETENESS 6 $178,238 6 $139,425 113 $120,885 1 $7,960 1 $200,000 1 $112,000
Private Mortgage Insurance Companies Aggregated Statistics For Year 2009(Based on 3 full and 8 partial tracts) A) Conventional B) Refinancings Number Average Value Number Average Value
LOANS ORIGINATED 9 $348,687 3 $353,153 APPLICATIONS APPROVED, NOT ACCEPTED 19 $331,323 0 $0 APPLICATIONS DENIED 5 $343,200 2 $391,770 APPLICATIONS WITHDRAWN 2 $285,120 0 $0 FILES CLOSED FOR INCOMPLETENESS 5 $383,384 0 $0
Aggregated Statistics For Year 2008(Based on 5 full and 12 partial tracts) A) Conventional B) Refinancings C) Non-occupant Loans on Number Average Value Number Average Value Number Average Value
LOANS ORIGINATED 58 $412,555 33 $431,382 2 $337,830 APPLICATIONS APPROVED, NOT ACCEPTED 58 $400,434 27 $403,297 4 $406,135 APPLICATIONS DENIED 15 $380,630 3 $453,920 3 $385,580 APPLICATIONS WITHDRAWN 14 $383,314 0 $0 0 $0 FILES CLOSED FOR INCOMPLETENESS 0 $0 0 $0 0 $0
Aggregated Statistics For Year 2007(Based on 5 full and 12 partial tracts) A) Conventional B) Refinancings C) Non-occupant Loans on Number Average Value Number Average Value Number Average Value
LOANS ORIGINATED 52 $409,416 28 $417,350 1 $297,000 APPLICATIONS APPROVED, NOT ACCEPTED 16 $419,274 6 $471,178 2 $237,980 APPLICATIONS DENIED 2 $357,700 7 $445,041 0 $0 APPLICATIONS WITHDRAWN 7 $428,357 3 $424,387 0 $0 FILES CLOSED FOR INCOMPLETENESS 0 $0 0 $0 0 $0
Aggregated Statistics For Year 2006(Based on 5 full and 12 partial tracts) A) Conventional B) Refinancings C) Non-occupant Loans on Number Average Value Number Average Value Number Average Value
LOANS ORIGINATED 38 $377,286 10 $390,073 5 $312,478 APPLICATIONS APPROVED, NOT ACCEPTED 7 $324,361 9 $399,719 0 $0 APPLICATIONS DENIED 2 $446,885 0 $0 0 $0 APPLICATIONS WITHDRAWN 2 $387,000 2 $347,250 0 $0 FILES CLOSED FOR INCOMPLETENESS 0 $0 0 $0 0 $0
Aggregated Statistics For Year 2005(Based on 5 full and 10 partial tracts) A) Conventional B) Refinancings C) Non-occupant Loans on Number Average Value Number Average Value Number Average Value
LOANS ORIGINATED 74 $336,644 16 $355,609 8 $300,358 APPLICATIONS APPROVED, NOT ACCEPTED 46 $325,297 5 $378,484 1 $252,000 APPLICATIONS DENIED 1 $281,000 1 $357,000 1 $281,000 APPLICATIONS WITHDRAWN 9 $279,671 4 $309,530 1 $262,000 FILES CLOSED FOR INCOMPLETENESS 0 $0 2 $499,200 0 $0
Aggregated Statistics For Year 2004(Based on 5 full and 12 partial tracts) A) Conventional B) Refinancings C) Non-occupant Loans on Number Average Value Number Average Value Number Average Value
LOANS ORIGINATED 137 $303,216 27 $256,810 4 $240,798 APPLICATIONS APPROVED, NOT ACCEPTED 56 $307,725 13 $256,575 1 $252,000 APPLICATIONS DENIED 6 $293,975 2 $277,200 1 $124,660 APPLICATIONS WITHDRAWN 12 $276,884 0 $0 0 $0 FILES CLOSED FOR INCOMPLETENESS 0 $0 4 $276,542 0 $0
Aggregated Statistics For Year 2003(Based on 5 full and 12 partial tracts) A) Conventional B) Refinancings C) Non-occupant Loans on Number Average Value Number Average Value Number Average Value
LOANS ORIGINATED 130 $275,713 60 $256,348 4 $218,940 APPLICATIONS APPROVED, NOT ACCEPTED 37 $265,669 24 $242,561 0 $0 APPLICATIONS DENIED 6 $346,997 2 $179,520 3 $340,547 APPLICATIONS WITHDRAWN 17 $291,891 4 $215,922 1 $381,720 FILES CLOSED FOR INCOMPLETENESS 0 $0 0 $0 0 $0
Aggregated Statistics For Year 2002(Based on 5 full and 12 partial tracts) A) Conventional B) Refinancings C) Non-occupant Loans on Number Average Value Number Average Value Number Average Value
LOANS ORIGINATED 155 $239,384 48 $216,401 2 $199,670 APPLICATIONS APPROVED, NOT ACCEPTED 72 $251,432 26 $230,204 3 $246,867 APPLICATIONS DENIED 9 $311,351 2 $341,360 0 $0 APPLICATIONS WITHDRAWN 27 $219,703 8 $213,329 4 $193,185 FILES CLOSED FOR INCOMPLETENESS 6 $214,793 0 $0 0 $0
Aggregated Statistics For Year 2001(Based on 5 full and 12 partial tracts) A) Conventional B) Refinancings C) Non-occupant Loans on Number Average Value Number Average Value Number Average Value
LOANS ORIGINATED 93 $209,166 68 $199,520 4 $186,125 APPLICATIONS APPROVED, NOT ACCEPTED 46 $211,600 13 $186,419 6 $194,067 APPLICATIONS DENIED 2 $195,500 8 $243,808 0 $0 APPLICATIONS WITHDRAWN 3 $211,733 0 $0 0 $0 FILES CLOSED FOR INCOMPLETENESS 0 $0 1 $198,000 0 $0
Aggregated Statistics For Year 2000(Based on 5 full and 12 partial tracts) A) Conventional B) Refinancings C) Non-occupant Loans on Number Average Value Number Average Value Number Average Value
LOANS ORIGINATED 93 $194,640 20 $152,484 3 $198,347 APPLICATIONS APPROVED, NOT ACCEPTED 20 $176,588 7 $170,314 0 $0 APPLICATIONS DENIED 7 $194,029 1 $208,000 0 $0 APPLICATIONS WITHDRAWN 3 $210,153 0 $0 0 $0 FILES CLOSED FOR INCOMPLETENESS 2 $180,000 0 $0 0 $0
Aggregated Statistics For Year 1999(Based on 5 full and 7 partial tracts) A) Conventional B) Refinancings Number Average Value Number Average Value
LOANS ORIGINATED 55 $165,301 32 $149,196 APPLICATIONS APPROVED, NOT ACCEPTED 8 $175,042 5 $138,480 APPLICATIONS DENIED 11 $169,193 4 $148,650 APPLICATIONS WITHDRAWN 1 $147,920 1 $93,950 FILES CLOSED FOR INCOMPLETENESS 1 $225,000 1 $278,780
2007 - 2018 National Fire Incident Reporting System (NFIRS) incidents See full 2006 National Fire Incident Reporting System statistics for zip code 11429, New York
Most common first names in zip code 11429 among deceased individuals Name Count Lived (average)
Mary 172 80.5 years John 166 75.0 years William 135 74.5 years Joseph 116 74.6 years James 115 73.0 years Anna 75 84.7 years Frank 71 74.1 years Margaret 71 80.4 years Charles 70 73.5 years George 70 75.1 years
Most common last names in zip code 11429 among deceased individuals Last name Count Lived (average)
Williams 56 67.7 years Brown 46 72.5 years Smith 44 72.6 years Jones 41 60.8 years Johnson 40 73.0 years Thomas 33 71.6 years Davis 26 70.3 years Kelly 23 77.7 years Jackson 19 67.8 years Anderson 17 67.7 years
Businesses in zip code 11429
Name Count Name Count
Baskin-Robbins 1 MasterBrand Cabinets 2 CVS 1 Rite Aid 1 Dunkin Donuts 1 Walgreens 2 GNC 1 White Castle 1 Little Caesars Pizza 1

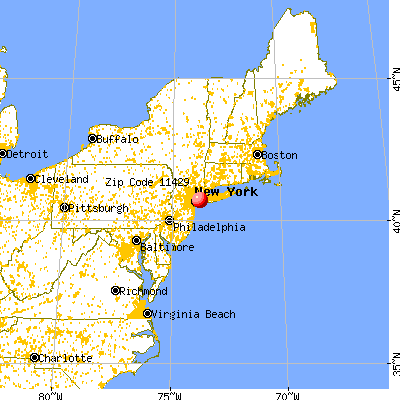


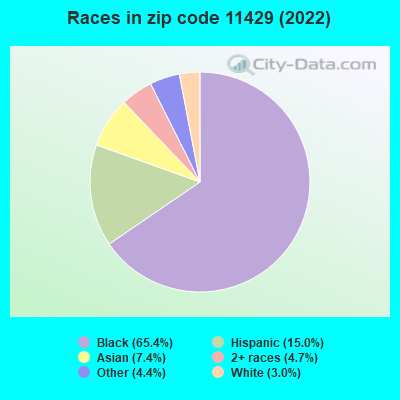


 Nearest zip codes: 11428, 11411, 11427, 11412, 11423, 11426.
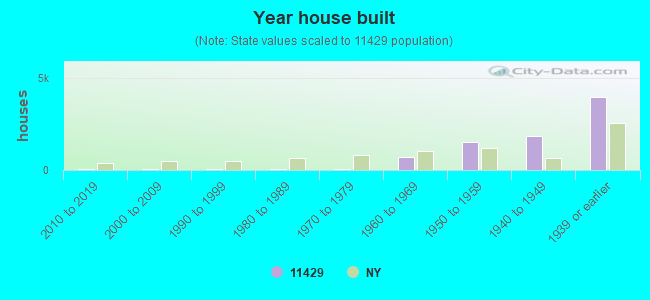

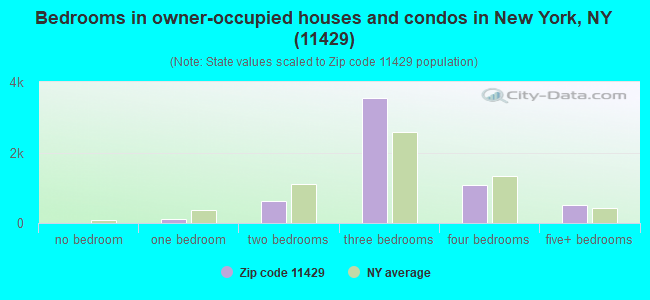
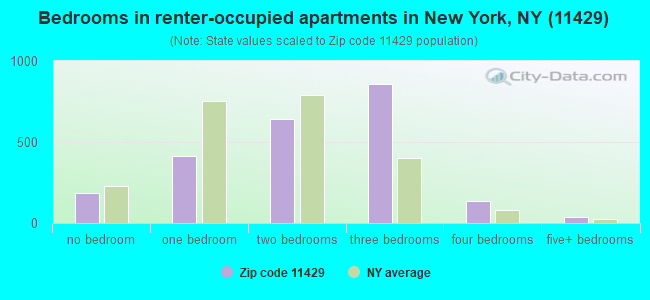
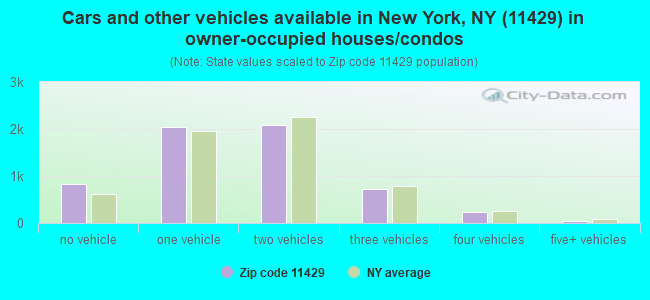
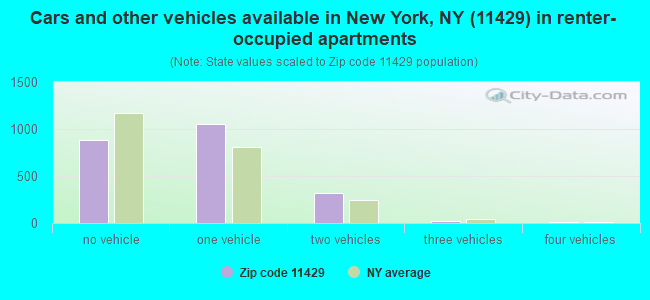


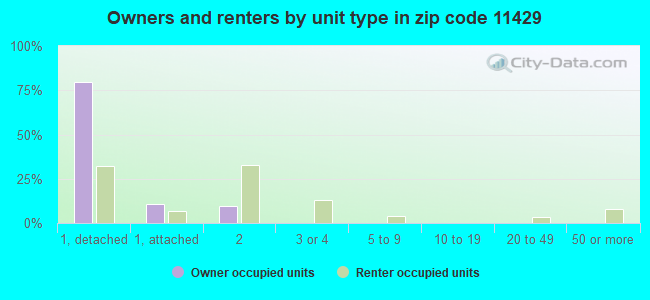
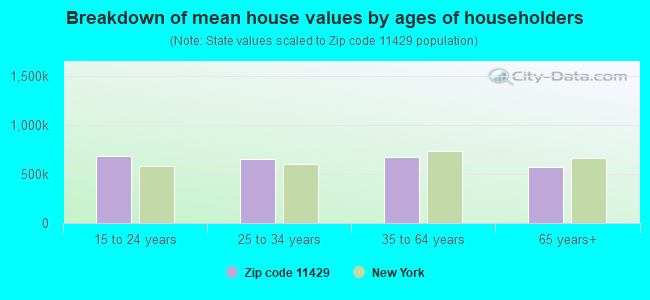


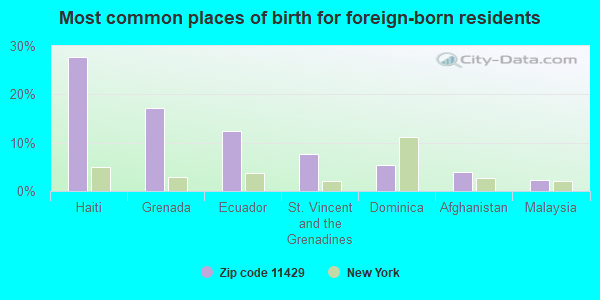
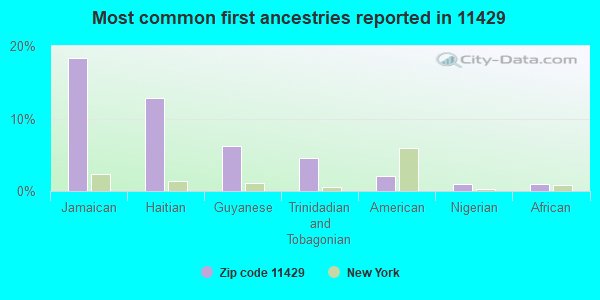
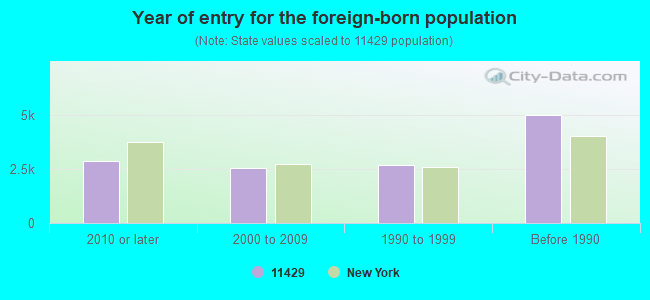


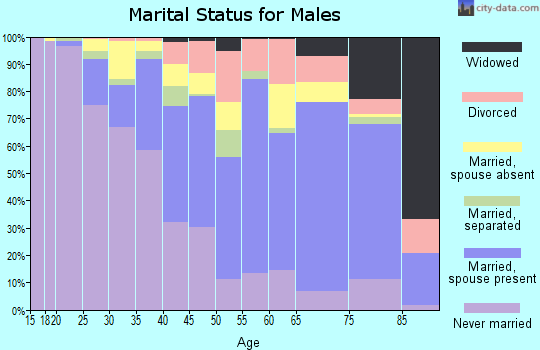
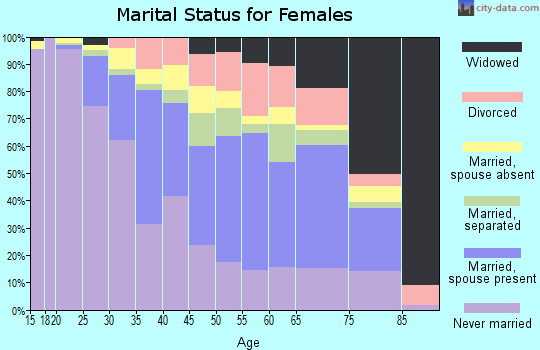
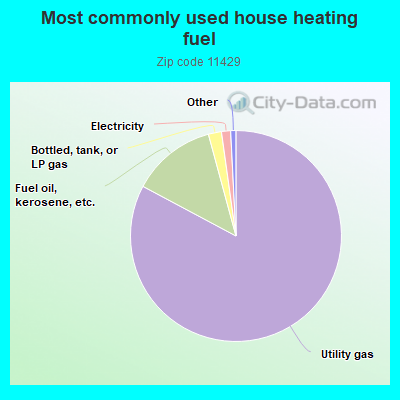
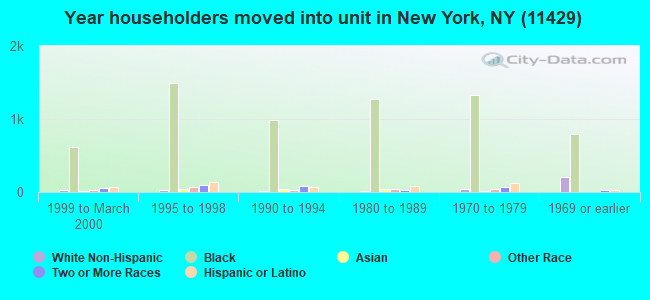
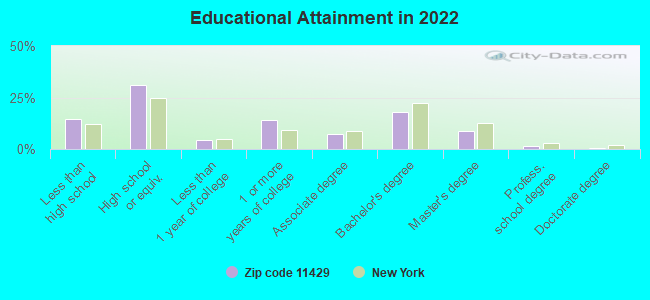
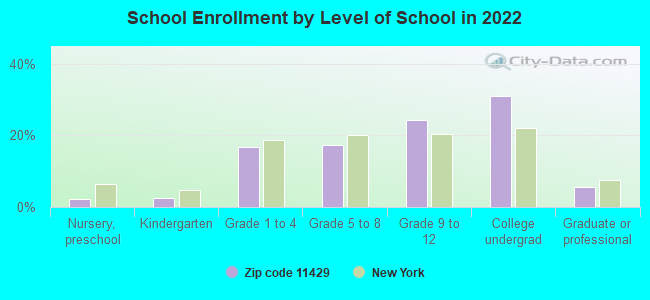
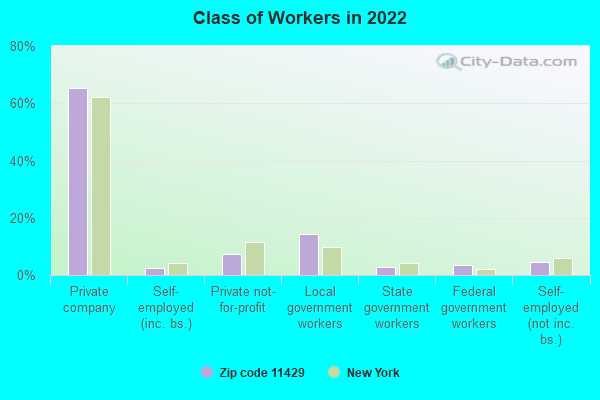
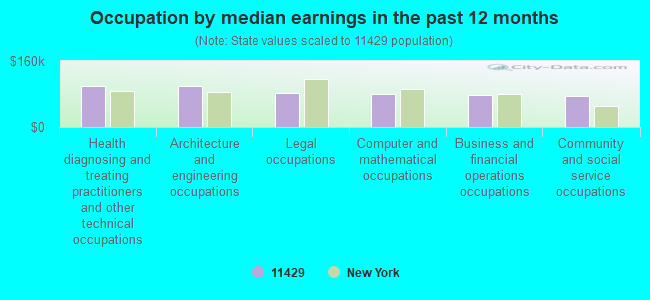
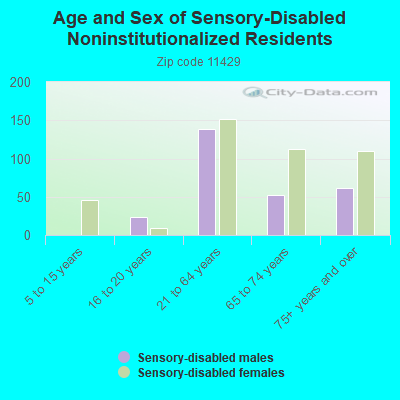
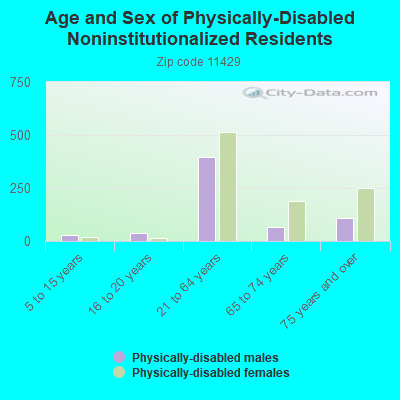
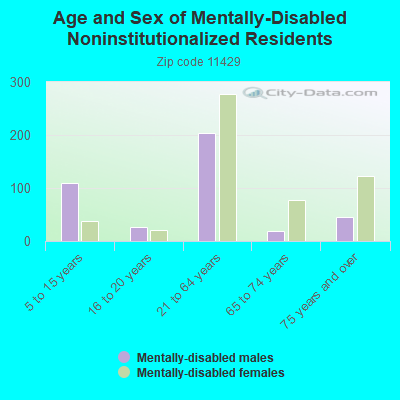
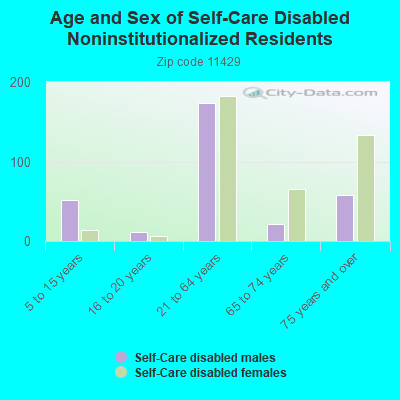
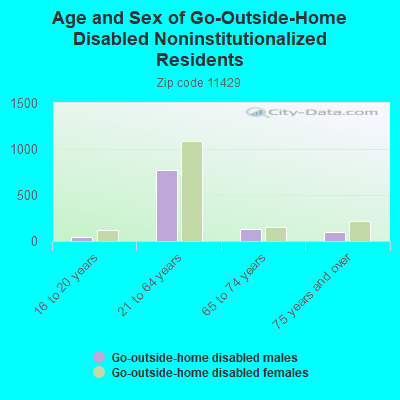
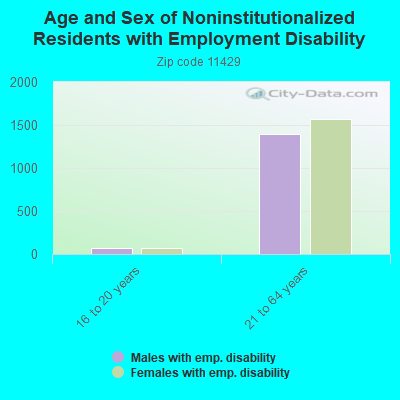
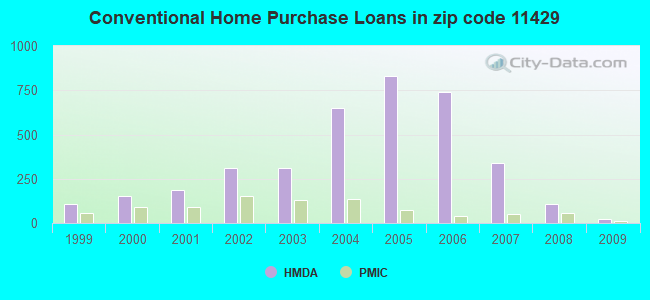
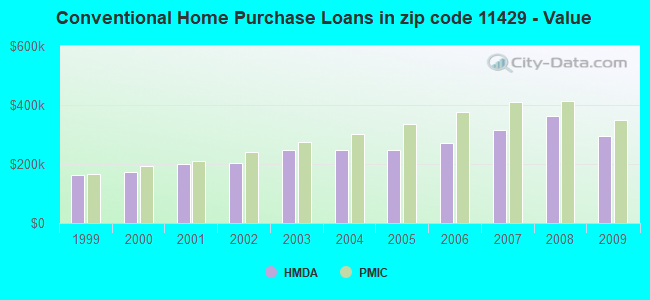
 According to the data from the years 2007 - 2018 the average number of fire incidents per year is 114. The highest number of reported fires - 142 took place in 2015, and the least - 66 in 2007. The data has a rising trend.
 When looking into fire subcategories, the most incidents belonged to: Structure Fires (76.4%), and Outside Fires (10.7%).