Estimated zip code population in 2022: 20,990
Zip code population in 2010: 18,556
Zip code population in 2000: 21,282
Houses and condos: 6,931
Renter-occupied apartments: 952
% of renters here:
14%State:
46%
March 2022 cost of living index in zip code 11411: 145.0
(very high, U.S. average is 100)
Land area: 1.2
sq. mi.
Water area: 0.0
sq. mi.
Population density: 17,954 people per square mile (very high).
OSM Map
General Map
Google Map
MSN Map
OSM Map
General Map
Google Map
MSN Map
OSM Map
General Map
Google Map
MSN Map
OSM Map
General Map
Google Map
MSN Map
Please wait while loading the map...
Real estate property taxes paid for housing units in 2022:
This zip code:
0.8% ($5,193)New York:
1.5% ($6,180)
Median real estate property taxes paid for housing units with mortgages in 2022: $4,966 (0.8%)
Median real estate property taxes paid for housing units with no mortgage in 2022: $5,506 (0.9%)
Profiles of local businesses
Business Search - 14 Million verified businesses
Males: 9,630 Females: 11,359
For population 25 years and over in 11411:
High school or higher: 92.2%Bachelor's degree or higher: 33.5%Graduate or professional degree: 14.8%Unemployed: 4.8%Mean travel time to work (commute): 49.2 minutes
For population 15 years and over in 11411:
Never married: 38.9%Now married: 42.3%Separated: 3.9%Widowed: 5.6%Divorced: 9.2%
Zip code 11411 compared to state average:
Median house value above state average. Black race population percentage significantly above state average. Hispanic race population percentage significantly below state average. Median age above state average. Foreign-born population percentage above state average. Renting percentage significantly below state average. Length of stay since moving in significantly above state average. Number of rooms per house above state average. 18,223 86.8% Black 1,402 6.7% Hispanic or Latino 454 2.2% Two or more races 419 2.0% White 308 1.5% Asian 183 0.9% Some other race
Data:
Median household income ($)
Median household income (% change since 2000)
Household income diversity
Ratio of average income to average house value (%)
Ratio of average income to average rent
Median household income ($) - White
Median household income ($) - Black or African American
Median household income ($) - Asian
Median household income ($) - Hispanic or Latino
Median household income ($) - American Indian and Alaska Native
Median household income ($) - Multirace
Median household income ($) - Other Race
Median household income for houses/condos with a mortgage ($)
Median household income for apartments without a mortgage ($)
Races - White alone (%)
Races - White alone (% change since 2000)
Races - Black alone (%)
Races - Black alone (% change since 2000)
Races - American Indian alone (%)
Races - American Indian alone (% change since 2000)
Races - Asian alone (%)
Races - Asian alone (% change since 2000)
Races - Hispanic (%)
Races - Hispanic (% change since 2000)
Races - Native Hawaiian and Other Pacific Islander alone (%)
Races - Native Hawaiian and Other Pacific Islander alone (% change since 2000)
Races - Two or more races (%)
Races - Two or more races (% change since 2000)
Races - Other race alone (%)
Races - Other race alone (% change since 2000)
Racial diversity
Unemployment (%)
Unemployment (% change since 2000)
Unemployment (%) - White
Unemployment (%) - Black or African American
Unemployment (%) - Asian
Unemployment (%) - Hispanic or Latino
Unemployment (%) - American Indian and Alaska Native
Unemployment (%) - Multirace
Unemployment (%) - Other Race
Population density (people per square mile)
Population - Males (%)
Population - Females (%)
Population - Males (%) - White
Population - Males (%) - Black or African American
Population - Males (%) - Asian
Population - Males (%) - Hispanic or Latino
Population - Males (%) - American Indian and Alaska Native
Population - Males (%) - Multirace
Population - Males (%) - Other Race
Population - Females (%) - White
Population - Females (%) - Black or African American
Population - Females (%) - Asian
Population - Females (%) - Hispanic or Latino
Population - Females (%) - American Indian and Alaska Native
Population - Females (%) - Multirace
Population - Females (%) - Other Race
Coronavirus confirmed cases (Apr 27, 2024)
Deaths caused by coronavirus (Apr 27, 2024)
Coronavirus confirmed cases (per 100k population) (Apr 27, 2024)
Deaths caused by coronavirus (per 100k population) (Apr 27, 2024)
Daily increase in number of cases (Apr 27, 2024)
Weekly increase in number of cases (Apr 27, 2024)
Cases doubled (in days) (Apr 27, 2024)
Hospitalized patients (Apr 18, 2022)
Negative test results (Apr 18, 2022)
Total test results (Apr 18, 2022)
COVID Vaccine doses distributed (per 100k population) (Sep 19, 2023)
COVID Vaccine doses administered (per 100k population) (Sep 19, 2023)
COVID Vaccine doses distributed (Sep 19, 2023)
COVID Vaccine doses administered (Sep 19, 2023)
Likely homosexual households (%)
Likely homosexual households (% change since 2000)
Likely homosexual households - Lesbian couples (%)
Likely homosexual households - Lesbian couples (% change since 2000)
Likely homosexual households - Gay men (%)
Likely homosexual households - Gay men (% change since 2000)
Cost of living index
Median gross rent ($)
Median contract rent ($)
Median monthly housing costs ($)
Median house or condo value ($)
Median house or condo value ($ change since 2000)
Mean house or condo value by units in structure - 1, detached ($)
Mean house or condo value by units in structure - 1, attached ($)
Mean house or condo value by units in structure - 2 ($)
Mean house or condo value by units in structure by units in structure - 3 or 4 ($)
Mean house or condo value by units in structure - 5 or more ($)
Mean house or condo value by units in structure - Boat, RV, van, etc. ($)
Mean house or condo value by units in structure - Mobile home ($)
Median house or condo value ($) - White
Median house or condo value ($) - Black or African American
Median house or condo value ($) - Asian
Median house or condo value ($) - Hispanic or Latino
Median house or condo value ($) - American Indian and Alaska Native
Median house or condo value ($) - Multirace
Median house or condo value ($) - Other Race
Median resident age
Resident age diversity
Median resident age - Males
Median resident age - Females
Median resident age - White
Median resident age - Black or African American
Median resident age - Asian
Median resident age - Hispanic or Latino
Median resident age - American Indian and Alaska Native
Median resident age - Multirace
Median resident age - Other Race
Median resident age - Males - White
Median resident age - Males - Black or African American
Median resident age - Males - Asian
Median resident age - Males - Hispanic or Latino
Median resident age - Males - American Indian and Alaska Native
Median resident age - Males - Multirace
Median resident age - Males - Other Race
Median resident age - Females - White
Median resident age - Females - Black or African American
Median resident age - Females - Asian
Median resident age - Females - Hispanic or Latino
Median resident age - Females - American Indian and Alaska Native
Median resident age - Females - Multirace
Median resident age - Females - Other Race
Commute - mean travel time to work (minutes)
Travel time to work - Less than 5 minutes (%)
Travel time to work - Less than 5 minutes (% change since 2000)
Travel time to work - 5 to 9 minutes (%)
Travel time to work - 5 to 9 minutes (% change since 2000)
Travel time to work - 10 to 19 minutes (%)
Travel time to work - 10 to 19 minutes (% change since 2000)
Travel time to work - 20 to 29 minutes (%)
Travel time to work - 20 to 29 minutes (% change since 2000)
Travel time to work - 30 to 39 minutes (%)
Travel time to work - 30 to 39 minutes (% change since 2000)
Travel time to work - 40 to 59 minutes (%)
Travel time to work - 40 to 59 minutes (% change since 2000)
Travel time to work - 60 to 89 minutes (%)
Travel time to work - 60 to 89 minutes (% change since 2000)
Travel time to work - 90 or more minutes (%)
Travel time to work - 90 or more minutes (% change since 2000)
Marital status - Never married (%)
Marital status - Now married (%)
Marital status - Separated (%)
Marital status - Widowed (%)
Marital status - Divorced (%)
Median family income ($)
Median family income (% change since 2000)
Median non-family income ($)
Median non-family income (% change since 2000)
Median per capita income ($)
Median per capita income (% change since 2000)
Median family income ($) - White
Median family income ($) - Black or African American
Median family income ($) - Asian
Median family income ($) - Hispanic or Latino
Median family income ($) - American Indian and Alaska Native
Median family income ($) - Multirace
Median family income ($) - Other Race
Median year house/condo built
Median year apartment built
Year house built - Built 2005 or later (%)
Year house built - Built 2000 to 2004 (%)
Year house built - Built 1990 to 1999 (%)
Year house built - Built 1980 to 1989 (%)
Year house built - Built 1970 to 1979 (%)
Year house built - Built 1960 to 1969 (%)
Year house built - Built 1950 to 1959 (%)
Year house built - Built 1940 to 1949 (%)
Year house built - Built 1939 or earlier (%)
Average household size
Household density (households per square mile)
Average household size - White
Average household size - Black or African American
Average household size - Asian
Average household size - Hispanic or Latino
Average household size - American Indian and Alaska Native
Average household size - Multirace
Average household size - Other Race
Occupied housing units (%)
Vacant housing units (%)
Owner occupied housing units (%)
Renter occupied housing units (%)
Vacancy status - For rent (%)
Vacancy status - For sale only (%)
Vacancy status - Rented or sold, not occupied (%)
Vacancy status - For seasonal, recreational, or occasional use (%)
Vacancy status - For migrant workers (%)
Vacancy status - Other vacant (%)
Residents with income below the poverty level (%)
Residents with income below 50% of the poverty level (%)
Children below poverty level (%)
Poor families by family type - Married-couple family (%)
Poor families by family type - Male, no wife present (%)
Poor families by family type - Female, no husband present (%)
Poverty status for native-born residents (%)
Poverty status for foreign-born residents (%)
Poverty among high school graduates not in families (%)
Poverty among people who did not graduate high school not in families (%)
Residents with income below the poverty level (%) - White
Residents with income below the poverty level (%) - Black or African American
Residents with income below the poverty level (%) - Asian
Residents with income below the poverty level (%) - Hispanic or Latino
Residents with income below the poverty level (%) - American Indian and Alaska Native
Residents with income below the poverty level (%) - Multirace
Residents with income below the poverty level (%) - Other Race
Air pollution - Air Quality Index (AQI)
Air pollution - CO
Air pollution - NO2
Air pollution - SO2
Air pollution - Ozone
Air pollution - PM10
Air pollution - PM25
Air pollution - Pb
Crime - Murders per 100,000 population
Crime - Rapes per 100,000 population
Crime - Robberies per 100,000 population
Crime - Assaults per 100,000 population
Crime - Burglaries per 100,000 population
Crime - Thefts per 100,000 population
Crime - Auto thefts per 100,000 population
Crime - Arson per 100,000 population
Crime - City-data.com crime index
Crime - Violent crime index
Crime - Property crime index
Crime - Murders per 100,000 population (5 year average)
Crime - Rapes per 100,000 population (5 year average)
Crime - Robberies per 100,000 population (5 year average)
Crime - Assaults per 100,000 population (5 year average)
Crime - Burglaries per 100,000 population (5 year average)
Crime - Thefts per 100,000 population (5 year average)
Crime - Auto thefts per 100,000 population (5 year average)
Crime - Arson per 100,000 population (5 year average)
Crime - City-data.com crime index (5 year average)
Crime - Violent crime index (5 year average)
Crime - Property crime index (5 year average)
1996 Presidential Elections Results (%) - Democratic Party (Clinton)
1996 Presidential Elections Results (%) - Republican Party (Dole)
1996 Presidential Elections Results (%) - Other
2000 Presidential Elections Results (%) - Democratic Party (Gore)
2000 Presidential Elections Results (%) - Republican Party (Bush)
2000 Presidential Elections Results (%) - Other
2004 Presidential Elections Results (%) - Democratic Party (Kerry)
2004 Presidential Elections Results (%) - Republican Party (Bush)
2004 Presidential Elections Results (%) - Other
2008 Presidential Elections Results (%) - Democratic Party (Obama)
2008 Presidential Elections Results (%) - Republican Party (McCain)
2008 Presidential Elections Results (%) - Other
2012 Presidential Elections Results (%) - Democratic Party (Obama)
2012 Presidential Elections Results (%) - Republican Party (Romney)
2012 Presidential Elections Results (%) - Other
2016 Presidential Elections Results (%) - Democratic Party (Clinton)
2016 Presidential Elections Results (%) - Republican Party (Trump)
2016 Presidential Elections Results (%) - Other
2020 Presidential Elections Results (%) - Democratic Party (Biden)
2020 Presidential Elections Results (%) - Republican Party (Trump)
2020 Presidential Elections Results (%) - Other
Ancestries Reported - Arab (%)
Ancestries Reported - Czech (%)
Ancestries Reported - Danish (%)
Ancestries Reported - Dutch (%)
Ancestries Reported - English (%)
Ancestries Reported - French (%)
Ancestries Reported - French Canadian (%)
Ancestries Reported - German (%)
Ancestries Reported - Greek (%)
Ancestries Reported - Hungarian (%)
Ancestries Reported - Irish (%)
Ancestries Reported - Italian (%)
Ancestries Reported - Lithuanian (%)
Ancestries Reported - Norwegian (%)
Ancestries Reported - Polish (%)
Ancestries Reported - Portuguese (%)
Ancestries Reported - Russian (%)
Ancestries Reported - Scotch-Irish (%)
Ancestries Reported - Scottish (%)
Ancestries Reported - Slovak (%)
Ancestries Reported - Subsaharan African (%)
Ancestries Reported - Swedish (%)
Ancestries Reported - Swiss (%)
Ancestries Reported - Ukrainian (%)
Ancestries Reported - United States (%)
Ancestries Reported - Welsh (%)
Ancestries Reported - West Indian (%)
Ancestries Reported - Other (%)
Educational Attainment - No schooling completed (%)
Educational Attainment - Less than high school (%)
Educational Attainment - High school or equivalent (%)
Educational Attainment - Less than 1 year of college (%)
Educational Attainment - 1 or more years of college (%)
Educational Attainment - Associate degree (%)
Educational Attainment - Bachelor's degree (%)
Educational Attainment - Master's degree (%)
Educational Attainment - Professional school degree (%)
Educational Attainment - Doctorate degree (%)
School Enrollment - Nursery, preschool (%)
School Enrollment - Kindergarten (%)
School Enrollment - Grade 1 to 4 (%)
School Enrollment - Grade 5 to 8 (%)
School Enrollment - Grade 9 to 12 (%)
School Enrollment - College undergrad (%)
School Enrollment - Graduate or professional (%)
School Enrollment - Not enrolled in school (%)
School enrollment - Public schools (%)
School enrollment - Private schools (%)
School enrollment - Not enrolled (%)
Median number of rooms in houses and condos
Median number of rooms in apartments
Housing units lacking complete plumbing facilities (%)
Housing units lacking complete kitchen facilities (%)
Density of houses
Urban houses (%)
Rural houses (%)
Households with people 60 years and over (%)
Households with people 65 years and over (%)
Households with people 75 years and over (%)
Households with one or more nonrelatives (%)
Households with no nonrelatives (%)
Population in households (%)
Family households (%)
Nonfamily households (%)
Population in families (%)
Family households with own children (%)
Median number of bedrooms in owner occupied houses
Mean number of bedrooms in owner occupied houses
Median number of bedrooms in renter occupied houses
Mean number of bedrooms in renter occupied houses
Median number of vehichles in owner occupied houses
Mean number of vehichles in owner occupied houses
Median number of vehichles in renter occupied houses
Mean number of vehichles in renter occupied houses
Mortgage status - with mortgage (%)
Mortgage status - with second mortgage (%)
Mortgage status - with home equity loan (%)
Mortgage status - with both second mortgage and home equity loan (%)
Mortgage status - without a mortgage (%)
Average family size
Average family size - White
Average family size - Black or African American
Average family size - Asian
Average family size - Hispanic or Latino
Average family size - American Indian and Alaska Native
Average family size - Multirace
Average family size - Other Race
Geographical mobility - Same house 1 year ago (%)
Geographical mobility - Moved within same county (%)
Geographical mobility - Moved from different county within same state (%)
Geographical mobility - Moved from different state (%)
Geographical mobility - Moved from abroad (%)
Place of birth - Born in state of residence (%)
Place of birth - Born in other state (%)
Place of birth - Native, outside of US (%)
Place of birth - Foreign born (%)
Housing units in structures - 1, detached (%)
Housing units in structures - 1, attached (%)
Housing units in structures - 2 (%)
Housing units in structures - 3 or 4 (%)
Housing units in structures - 5 to 9 (%)
Housing units in structures - 10 to 19 (%)
Housing units in structures - 20 to 49 (%)
Housing units in structures - 50 or more (%)
Housing units in structures - Mobile home (%)
Housing units in structures - Boat, RV, van, etc. (%)
House/condo owner moved in on average (years ago)
Renter moved in on average (years ago)
Year householder moved into unit - Moved in 1999 to March 2000 (%)
Year householder moved into unit - Moved in 1995 to 1998 (%)
Year householder moved into unit - Moved in 1990 to 1994 (%)
Year householder moved into unit - Moved in 1980 to 1989 (%)
Year householder moved into unit - Moved in 1970 to 1979 (%)
Year householder moved into unit - Moved in 1969 or earlier (%)
Means of transportation to work - Drove car alone (%)
Means of transportation to work - Carpooled (%)
Means of transportation to work - Public transportation (%)
Means of transportation to work - Bus or trolley bus (%)
Means of transportation to work - Streetcar or trolley car (%)
Means of transportation to work - Subway or elevated (%)
Means of transportation to work - Railroad (%)
Means of transportation to work - Ferryboat (%)
Means of transportation to work - Taxicab (%)
Means of transportation to work - Motorcycle (%)
Means of transportation to work - Bicycle (%)
Means of transportation to work - Walked (%)
Means of transportation to work - Other means (%)
Working at home (%)
Industry diversity
Most Common Industries - Agriculture, forestry, fishing and hunting, and mining (%)
Most Common Industries - Agriculture, forestry, fishing and hunting (%)
Most Common Industries - Mining, quarrying, and oil and gas extraction (%)
Most Common Industries - Construction (%)
Most Common Industries - Manufacturing (%)
Most Common Industries - Wholesale trade (%)
Most Common Industries - Retail trade (%)
Most Common Industries - Transportation and warehousing, and utilities (%)
Most Common Industries - Transportation and warehousing (%)
Most Common Industries - Utilities (%)
Most Common Industries - Information (%)
Most Common Industries - Finance and insurance, and real estate and rental and leasing (%)
Most Common Industries - Finance and insurance (%)
Most Common Industries - Real estate and rental and leasing (%)
Most Common Industries - Professional, scientific, and management, and administrative and waste management services (%)
Most Common Industries - Professional, scientific, and technical services (%)
Most Common Industries - Management of companies and enterprises (%)
Most Common Industries - Administrative and support and waste management services (%)
Most Common Industries - Educational services, and health care and social assistance (%)
Most Common Industries - Educational services (%)
Most Common Industries - Health care and social assistance (%)
Most Common Industries - Arts, entertainment, and recreation, and accommodation and food services (%)
Most Common Industries - Arts, entertainment, and recreation (%)
Most Common Industries - Accommodation and food services (%)
Most Common Industries - Other services, except public administration (%)
Most Common Industries - Public administration (%)
Occupation diversity
Most Common Occupations - Management, business, science, and arts occupations (%)
Most Common Occupations - Management, business, and financial occupations (%)
Most Common Occupations - Management occupations (%)
Most Common Occupations - Business and financial operations occupations (%)
Most Common Occupations - Computer, engineering, and science occupations (%)
Most Common Occupations - Computer and mathematical occupations (%)
Most Common Occupations - Architecture and engineering occupations (%)
Most Common Occupations - Life, physical, and social science occupations (%)
Most Common Occupations - Education, legal, community service, arts, and media occupations (%)
Most Common Occupations - Community and social service occupations (%)
Most Common Occupations - Legal occupations (%)
Most Common Occupations - Education, training, and library occupations (%)
Most Common Occupations - Arts, design, entertainment, sports, and media occupations (%)
Most Common Occupations - Healthcare practitioners and technical occupations (%)
Most Common Occupations - Health diagnosing and treating practitioners and other technical occupations (%)
Most Common Occupations - Health technologists and technicians (%)
Most Common Occupations - Service occupations (%)
Most Common Occupations - Healthcare support occupations (%)
Most Common Occupations - Protective service occupations (%)
Most Common Occupations - Fire fighting and prevention, and other protective service workers including supervisors (%)
Most Common Occupations - Law enforcement workers including supervisors (%)
Most Common Occupations - Food preparation and serving related occupations (%)
Most Common Occupations - Building and grounds cleaning and maintenance occupations (%)
Most Common Occupations - Personal care and service occupations (%)
Most Common Occupations - Sales and office occupations (%)
Most Common Occupations - Sales and related occupations (%)
Most Common Occupations - Office and administrative support occupations (%)
Most Common Occupations - Natural resources, construction, and maintenance occupations (%)
Most Common Occupations - Farming, fishing, and forestry occupations (%)
Most Common Occupations - Construction and extraction occupations (%)
Most Common Occupations - Installation, maintenance, and repair occupations (%)
Most Common Occupations - Production, transportation, and material moving occupations (%)
Most Common Occupations - Production occupations (%)
Most Common Occupations - Transportation occupations (%)
Most Common Occupations - Material moving occupations (%)
People in Group quarters - Institutionalized population (%)
People in Group quarters - Correctional institutions (%)
People in Group quarters - Federal prisons and detention centers (%)
People in Group quarters - Halfway houses (%)
People in Group quarters - Local jails and other confinement facilities (including police lockups) (%)
People in Group quarters - Military disciplinary barracks (%)
People in Group quarters - State prisons (%)
People in Group quarters - Other types of correctional institutions (%)
People in Group quarters - Nursing homes (%)
People in Group quarters - Hospitals/wards, hospices, and schools for the handicapped (%)
People in Group quarters - Hospitals/wards and hospices for chronically ill (%)
People in Group quarters - Hospices or homes for chronically ill (%)
People in Group quarters - Military hospitals or wards for chronically ill (%)
People in Group quarters - Other hospitals or wards for chronically ill (%)
People in Group quarters - Hospitals or wards for drug/alcohol abuse (%)
People in Group quarters - Mental (Psychiatric) hospitals or wards (%)
People in Group quarters - Schools, hospitals, or wards for the mentally retarded (%)
People in Group quarters - Schools, hospitals, or wards for the physically handicapped (%)
People in Group quarters - Institutions for the deaf (%)
People in Group quarters - Institutions for the blind (%)
People in Group quarters - Orthopedic wards and institutions for the physically handicapped (%)
People in Group quarters - Wards in general hospitals for patients who have no usual home elsewhere (%)
People in Group quarters - Wards in military hospitals for patients who have no usual home elsewhere (%)
People in Group quarters - Juvenile institutions (%)
People in Group quarters - Long-term care (%)
People in Group quarters - Homes for abused, dependent, and neglected children (%)
People in Group quarters - Residential treatment centers for emotionally disturbed children (%)
People in Group quarters - Training schools for juvenile delinquents (%)
People in Group quarters - Short-term care, detention or diagnostic centers for delinquent children (%)
People in Group quarters - Type of juvenile institution unknown (%)
People in Group quarters - Noninstitutionalized population (%)
People in Group quarters - College dormitories (includes college quarters off campus) (%)
People in Group quarters - Military quarters (%)
People in Group quarters - On base (%)
People in Group quarters - Barracks, unaccompanied personnel housing (UPH), (Enlisted/Officer), ;and similar group living quarters for military personnel (%)
People in Group quarters - Transient quarters for temporary residents (%)
People in Group quarters - Military ships (%)
People in Group quarters - Group homes (%)
People in Group quarters - Homes or halfway houses for drug/alcohol abuse (%)
People in Group quarters - Homes for the mentally ill (%)
People in Group quarters - Homes for the mentally retarded (%)
People in Group quarters - Homes for the physically handicapped (%)
People in Group quarters - Other group homes (%)
People in Group quarters - Religious group quarters (%)
People in Group quarters - Dormitories (%)
People in Group quarters - Agriculture workers' dormitories on farms (%)
People in Group quarters - Job Corps and vocational training facilities (%)
People in Group quarters - Other workers' dormitories (%)
People in Group quarters - Crews of maritime vessels (%)
People in Group quarters - Other nonhousehold living situations (%)
People in Group quarters - Other noninstitutional group quarters (%)
Residents speaking English at home (%)
Residents speaking English at home - Born in the United States (%)
Residents speaking English at home - Native, born elsewhere (%)
Residents speaking English at home - Foreign born (%)
Residents speaking Spanish at home (%)
Residents speaking Spanish at home - Born in the United States (%)
Residents speaking Spanish at home - Native, born elsewhere (%)
Residents speaking Spanish at home - Foreign born (%)
Residents speaking other language at home (%)
Residents speaking other language at home - Born in the United States (%)
Residents speaking other language at home - Native, born elsewhere (%)
Residents speaking other language at home - Foreign born (%)
Class of Workers - Employee of private company (%)
Class of Workers - Self-employed in own incorporated business (%)
Class of Workers - Private not-for-profit wage and salary workers (%)
Class of Workers - Local government workers (%)
Class of Workers - State government workers (%)
Class of Workers - Federal government workers (%)
Class of Workers - Self-employed workers in own not incorporated business and Unpaid family workers (%)
House heating fuel used in houses and condos - Utility gas (%)
House heating fuel used in houses and condos - Bottled, tank, or LP gas (%)
House heating fuel used in houses and condos - Electricity (%)
House heating fuel used in houses and condos - Fuel oil, kerosene, etc. (%)
House heating fuel used in houses and condos - Coal or coke (%)
House heating fuel used in houses and condos - Wood (%)
House heating fuel used in houses and condos - Solar energy (%)
House heating fuel used in houses and condos - Other fuel (%)
House heating fuel used in houses and condos - No fuel used (%)
House heating fuel used in apartments - Utility gas (%)
House heating fuel used in apartments - Bottled, tank, or LP gas (%)
House heating fuel used in apartments - Electricity (%)
House heating fuel used in apartments - Fuel oil, kerosene, etc. (%)
House heating fuel used in apartments - Coal or coke (%)
House heating fuel used in apartments - Wood (%)
House heating fuel used in apartments - Solar energy (%)
House heating fuel used in apartments - Other fuel (%)
House heating fuel used in apartments - No fuel used (%)
Armed forces status - In Armed Forces (%)
Armed forces status - Civilian (%)
Armed forces status - Civilian - Veteran (%)
Armed forces status - Civilian - Nonveteran (%)
Fatal accidents locations in years 2005-2021
Fatal accidents locations in 2005
Fatal accidents locations in 2006
Fatal accidents locations in 2007
Fatal accidents locations in 2008
Fatal accidents locations in 2009
Fatal accidents locations in 2010
Fatal accidents locations in 2011
Fatal accidents locations in 2012
Fatal accidents locations in 2013
Fatal accidents locations in 2014
Fatal accidents locations in 2015
Fatal accidents locations in 2016
Fatal accidents locations in 2017
Fatal accidents locations in 2018
Fatal accidents locations in 2019
Fatal accidents locations in 2020
Fatal accidents locations in 2021
Alcohol use - People drinking some alcohol every month (%)
Alcohol use - People not drinking at all (%)
Alcohol use - Average days/month drinking alcohol
Alcohol use - Average drinks/week
Alcohol use - Average days/year people drink much
Audiometry - Average condition of hearing (%)
Audiometry - People that can hear a whisper from across a quiet room (%)
Audiometry - People that can hear normal voice from across a quiet room (%)
Audiometry - Ears ringing, roaring, buzzing (%)
Audiometry - Had a job exposure to loud noise (%)
Audiometry - Had off-work exposure to loud noise (%)
Blood Pressure & Cholesterol - Has high blood pressure (%)
Blood Pressure & Cholesterol - Checking blood pressure at home (%)
Blood Pressure & Cholesterol - Frequently checking blood cholesterol (%)
Blood Pressure & Cholesterol - Has high cholesterol level (%)
Consumer Behavior - Money monthly spent on food at supermarket/grocery store
Consumer Behavior - Money monthly spent on food at other stores
Consumer Behavior - Money monthly spent on eating out
Consumer Behavior - Money monthly spent on carryout/delivered foods
Consumer Behavior - Income spent on food at supermarket/grocery store (%)
Consumer Behavior - Income spent on food at other stores (%)
Consumer Behavior - Income spent on eating out (%)
Consumer Behavior - Income spent on carryout/delivered foods (%)
Current Health Status - General health condition (%)
Current Health Status - Blood donors (%)
Current Health Status - Has blood ever tested for HIV virus (%)
Current Health Status - Left-handed people (%)
Dermatology - People using sunscreen (%)
Diabetes - Diabetics (%)
Diabetes - Had a blood test for high blood sugar (%)
Diabetes - People taking insulin (%)
Diet Behavior & Nutrition - Diet health (%)
Diet Behavior & Nutrition - Milk product consumption (# of products/month)
Diet Behavior & Nutrition - Meals not home prepared (#/week)
Diet Behavior & Nutrition - Meals from fast food or pizza place (#/week)
Diet Behavior & Nutrition - Ready-to-eat foods (#/month)
Diet Behavior & Nutrition - Frozen meals/pizza (#/month)
Drug Use - People that ever used marijuana or hashish (%)
Drug Use - Ever used hard drugs (%)
Drug Use - Ever used any form of cocaine (%)
Drug Use - Ever used heroin (%)
Drug Use - Ever used methamphetamine (%)
Health Insurance - People covered by health insurance (%)
Kidney Conditions-Urology - Avg. # of times urinating at night
Medical Conditions - People with asthma (%)
Medical Conditions - People with anemia (%)
Medical Conditions - People with psoriasis (%)
Medical Conditions - People with overweight (%)
Medical Conditions - Elderly people having difficulties in thinking or remembering (%)
Medical Conditions - People who ever received blood transfusion (%)
Medical Conditions - People having trouble seeing even with glass/contacts (%)
Medical Conditions - People with arthritis (%)
Medical Conditions - People with gout (%)
Medical Conditions - People with congestive heart failure (%)
Medical Conditions - People with coronary heart disease (%)
Medical Conditions - People with angina pectoris (%)
Medical Conditions - People who ever had heart attack (%)
Medical Conditions - People who ever had stroke (%)
Medical Conditions - People with emphysema (%)
Medical Conditions - People with thyroid problem (%)
Medical Conditions - People with chronic bronchitis (%)
Medical Conditions - People with any liver condition (%)
Medical Conditions - People who ever had cancer or malignancy (%)
Mental Health - People who have little interest in doing things (%)
Mental Health - People feeling down, depressed, or hopeless (%)
Mental Health - People who have trouble sleeping or sleeping too much (%)
Mental Health - People feeling tired or having little energy (%)
Mental Health - People with poor appetite or overeating (%)
Mental Health - People feeling bad about themself (%)
Mental Health - People who have trouble concentrating on things (%)
Mental Health - People moving or speaking slowly or too fast (%)
Mental Health - People having thoughts they would be better off dead (%)
Oral Health - Average years since last visit a dentist
Oral Health - People embarrassed because of mouth (%)
Oral Health - People with gum disease (%)
Oral Health - General health of teeth and gums (%)
Oral Health - Average days a week using dental floss/device
Oral Health - Average days a week using mouthwash for dental problem
Oral Health - Average number of teeth
Pesticide Use - Households using pesticides to control insects (%)
Pesticide Use - Households using pesticides to kill weeds (%)
Physical Activity - People doing vigorous-intensity work activities (%)
Physical Activity - People doing moderate-intensity work activities (%)
Physical Activity - People walking or bicycling (%)
Physical Activity - People doing vigorous-intensity recreational activities (%)
Physical Activity - People doing moderate-intensity recreational activities (%)
Physical Activity - Average hours a day doing sedentary activities
Physical Activity - Average hours a day watching TV or videos
Physical Activity - Average hours a day using computer
Physical Functioning - People having limitations keeping them from working (%)
Physical Functioning - People limited in amount of work they can do (%)
Physical Functioning - People that need special equipment to walk (%)
Physical Functioning - People experiencing confusion/memory problems (%)
Physical Functioning - People requiring special healthcare equipment (%)
Prescription Medications - Average number of prescription medicines taking
Preventive Aspirin Use - Adults 40+ taking low-dose aspirin (%)
Reproductive Health - Vaginal deliveries (%)
Reproductive Health - Cesarean deliveries (%)
Reproductive Health - Deliveries resulted in a live birth (%)
Reproductive Health - Pregnancies resulted in a delivery (%)
Reproductive Health - Women breastfeeding newborns (%)
Reproductive Health - Women that had a hysterectomy (%)
Reproductive Health - Women that had both ovaries removed (%)
Reproductive Health - Women that have ever taken birth control pills (%)
Reproductive Health - Women taking birth control pills (%)
Reproductive Health - Women that have ever used Depo-Provera or injectables (%)
Reproductive Health - Women that have ever used female hormones (%)
Sexual Behavior - People 18+ that ever had sex (vaginal, anal, or oral) (%)
Sexual Behavior - Males 18+ that ever had vaginal sex with a woman (%)
Sexual Behavior - Males 18+ that ever performed oral sex on a woman (%)
Sexual Behavior - Males 18+ that ever had anal sex with a woman (%)
Sexual Behavior - Males 18+ that ever had any sex with a man (%)
Sexual Behavior - Females 18+ that ever had vaginal sex with a man (%)
Sexual Behavior - Females 18+ that ever performed oral sex on a man (%)
Sexual Behavior - Females 18+ that ever had anal sex with a man (%)
Sexual Behavior - Females 18+ that ever had any kind of sex with a woman (%)
Sexual Behavior - Average age people first had sex
Sexual Behavior - Average number of female sex partners in lifetime (males 18+)
Sexual Behavior - Average number of female vaginal sex partners in lifetime (males 18+)
Sexual Behavior - Average age people first performed oral sex on a woman (18+)
Sexual Behavior - Average number of woman performed oral sex on in lifetime (18+)
Sexual Behavior - Average number of male sex partners in lifetime (males 18+)
Sexual Behavior - Average number of male anal sex partners in lifetime (males 18+)
Sexual Behavior - Average age people first performed oral sex on a man (18+)
Sexual Behavior - Average number of male oral sex partners in lifetime (18+)
Sexual Behavior - People using protection when performing oral sex (%)
Sexual Behavior - Average number of times people have vaginal or anal sex a year
Sexual Behavior - People having sex without condom (%)
Sexual Behavior - Average number of male sex partners in lifetime (females 18+)
Sexual Behavior - Average number of male vaginal sex partners in lifetime (females 18+)
Sexual Behavior - Average number of female sex partners in lifetime (females 18+)
Sexual Behavior - Circumcised males 18+ (%)
Sleep Disorders - Average hours sleeping at night
Sleep Disorders - People that has trouble sleeping (%)
Smoking-Cigarette Use - People smoking cigarettes (%)
Taste & Smell - People 40+ having problems with smell (%)
Taste & Smell - People 40+ having problems with taste (%)
Taste & Smell - People 40+ that ever had wisdom teeth removed (%)
Taste & Smell - People 40+ that ever had tonsils teeth removed (%)
Taste & Smell - People 40+ that ever had a loss of consciousness because of a head injury (%)
Taste & Smell - People 40+ that ever had a broken nose or other serious injury to face or skull (%)
Taste & Smell - People 40+ that ever had two or more sinus infections (%)
Weight - Average height (inches)
Weight - Average weight (pounds)
Weight - Average BMI
Weight - People that are obese (%)
Weight - People that ever were obese (%)
Weight - People trying to lose weight (%)
100%
urban population.
Estimated median house/condo value in 2022: $616,497
11411:
$616,497New York:
$400,400
According to our research of New York and other state lists, there were 18 registered sex offenders living in 11411 zip code as of April 27, 2024 . The ratio of all residents to sex offenders in zip code 11411 is 1,088 to 1.The ratio of registered sex offenders to all residents in this zip code is near the state average.
Median resident age: This zip code:
47.3 yearsNew York median age:
40.0 years
Average household size: This zip code:
3.1 peopleNew York:
2.5 people
Averages for the 2020 tax year for zip code 11411, filed in 2021:
Average Adjusted Gross Income (AGI) in 2020: $56,306 (Individual Income Tax Returns) Here:
$56,306State:
$90,930
Salary/wage: $53,795 (reported on 81.0% of returns )Here:
$53,795State:
$72,104
(% of AGI for various income ranges: 998.5% for AGIs below $25k , 3616.0% for AGIs $25k-50k , 6571.9% for AGIs $50k-75k , 9935.3% for AGIs $75k-100k , 18223.7% for AGIs $100k-200k , 59310.0% for AGIs over 200k ) Taxable interest for individuals: $359 (reported on 27.9% of returns )This zip code:
$359New York:
$3,075
(% of AGI for various income ranges: 6.8% for AGIs below $25k , 7.8% for AGIs $25k-50k , 14.7% for AGIs $50k-75k , 19.3% for AGIs $75k-100k , 38.1% for AGIs $100k-200k , 100.0% for AGIs over 200k ) Ordinary dividends: $1,105 (reported on 10.1% of returns )(% of AGI for various income ranges: 4.8% for AGIs below $25k , 7.1% for AGIs $25k-50k , 11.2% for AGIs $50k-75k , 32.6% for AGIs $75k-100k , 52.1% for AGIs $100k-200k , 123.3% for AGIs over 200k ) Net capital gain/loss in AGI: +$2,107 (reported on 9.1% of returns )Here:
+$2,107State:
+$44,925
(% of AGI for various income ranges: 2.4% for AGIs below $25k , 5.6% for AGIs $25k-50k , 5.2% for AGIs $50k-75k , 25.2% for AGIs $75k-100k , 99.8% for AGIs $100k-200k , 1325.0% for AGIs over 200k ) Profit/loss from business: +$3,402 (reported on 15.7% of returns )Here:
+$3,402State:
+$14,940
(% of AGI for various income ranges: 128.4% for AGIs below $25k , 34.6% for AGIs $25k-50k , 9.9% for AGIs $50k-75k , 31.3% for AGIs $75k-100k , 170.5% for AGIs $100k-200k , 560.0% for AGIs over 200k ) Taxable individual retirement arrangement distribution: $13,331 (reported on 4.6% of returns )11411:
$13,331New York:
$19,609
(% of AGI for various income ranges: 27.9% for AGIs below $25k , 49.3% for AGIs $25k-50k , 73.0% for AGIs $50k-75k , 142.4% for AGIs $75k-100k , 317.4% for AGIs $100k-200k ) Total itemized deductions: $26,988 (reported on 18.9% of returns )Here:
$26,988State:
$39,326
(% of AGI for various income ranges: 84.5% for AGIs below $25k , 264.0% for AGIs $25k-50k , 733.5% for AGIs $50k-75k , 1424.2% for AGIs $75k-100k , 2448.6% for AGIs $100k-200k , 6963.3% for AGIs over 200k ) Charity contributions: $6,184 (reported on 16.0% of returns )(% of AGI for various income ranges: 8.4% for AGIs below $25k , 35.1% for AGIs $25k-50k , 114.7% for AGIs $50k-75k , 268.5% for AGIs $75k-100k , 548.6% for AGIs $100k-200k , 2021.7% for AGIs over 200k ) Taxes paid: $8,796 (reported on 18.8% of returns )(% of AGI for various income ranges: 21.9% for AGIs below $25k , 77.2% for AGIs $25k-50k , 237.9% for AGIs $50k-75k , 493.4% for AGIs $75k-100k , 823.7% for AGIs $100k-200k , 1915.0% for AGIs over 200k ) Earned income credit: $1,745 (reported on 14.0% of returns )(% of AGI for various income ranges: 72.7% for AGIs below $25k , 47.2% for AGIs $25k-50k ) Percentage of individuals using paid preparers for their 2020 taxes: 93.8%(% for various income ranges: 91.4% for AGIs below $25k , 94.8% for AGIs $25k-50k , 95.0% for AGIs $50k-75k , 95.2% for AGIs $75k-100k , 93.9% for AGIs $100k-200k , 94.7% for AGIs over 200k )
Averages for the 2012 tax year for zip code 11411, filed in 2013:
Average Adjusted Gross Income (AGI) in 2012: $47,370 (Individual Income Tax Returns) Here:
$47,370State:
$77,088
Salary/wage: $44,864 (reported on 83.6% of returns )Here:
$44,864State:
$60,593
(% of AGI for various income ranges: 68.1% for AGIs below $25k , 82.7% for AGIs $25k-50k , 80.5% for AGIs $50k-75k , 79.9% for AGIs $75k-100k , 79.8% for AGIs $100k-200k , 71.9% for AGIs over 200k ) Taxable interest for individuals: $333 (reported on 31.1% of returns )This zip code:
$333New York:
$3,125
(% of AGI for various income ranges: 0.5% for AGIs below $25k , 0.2% for AGIs $25k-50k , 0.2% for AGIs $50k-75k , 0.2% for AGIs $75k-100k , 0.2% for AGIs $100k-200k , 0.2% for AGIs over 200k ) Ordinary dividends: $915 (reported on 10.7% of returns )(% of AGI for various income ranges: 0.4% for AGIs below $25k , 0.2% for AGIs $25k-50k , 0.2% for AGIs $50k-75k , 0.1% for AGIs $75k-100k , 0.2% for AGIs $100k-200k , 0.2% for AGIs over 200k ) Net capital gain/loss in AGI: +$1,078 (reported on 6.1% of returns )Here:
+$1,078State:
+$42,474
(% of AGI for various income ranges: 5.2% for AGIs over 200k ) Profit/loss from business: +$5,652 (reported on 13.3% of returns )Here:
+$5,652State:
+$16,168
(% of AGI for various income ranges: 10.8% for AGIs below $25k , 0.9% for AGIs $25k-50k , 0.3% for AGIs $50k-75k , 0.6% for AGIs $75k-100k , 0.6% for AGIs $100k-200k ) Taxable individual retirement arrangement distribution: $11,625 (reported on 5.8% of returns )11411:
$11,625New York:
$17,621
(% of AGI for various income ranges: 1.6% for AGIs below $25k , 1.3% for AGIs $25k-50k , 1.3% for AGIs $50k-75k , 1.3% for AGIs $75k-100k , 1.9% for AGIs $100k-200k ) Total itemized deductions: $22,665 (31% of AGI, reported on 46.7% of returns )Here:
$22,665State:
$34,985
Here:
31.2% of AGIState:
21.3% of AGI
(% of AGI for various income ranges: 12.6% for AGIs below $25k , 19.8% for AGIs $25k-50k , 24.2% for AGIs $50k-75k , 25.9% for AGIs $75k-100k , 24.6% for AGIs $100k-200k , 18.8% for AGIs over 200k ) Charity contributions: $3,772 (reported on 40.8% of returns )(% of AGI for various income ranges: 1.2% for AGIs below $25k , 3.0% for AGIs $25k-50k , 3.7% for AGIs $50k-75k , 3.8% for AGIs $75k-100k , 3.5% for AGIs $100k-200k , 3.0% for AGIs over 200k ) Taxes paid: $7,821 (reported on 46.5% of returns )11411:
$7,821State:
$18,656
(% of AGI for various income ranges: 2.6% for AGIs below $25k , 5.2% for AGIs $25k-50k , 8.1% for AGIs $50k-75k , 9.5% for AGIs $75k-100k , 9.8% for AGIs $100k-200k , 9.3% for AGIs over 200k ) Earned income credit: $1,984 (reported on 19.2% of returns )(% of AGI for various income ranges: 6.6% for AGIs below $25k , 0.8% for AGIs $25k-50k ) Percentage of individuals using paid preparers for their 2012 taxes: 69.6%(% for various income ranges: 66.8% for AGIs below $25k , 69.8% for AGIs $25k-50k , 72.7% for AGIs $50k-75k , 73.3% for AGIs $75k-100k , 70.4% for AGIs $100k-200k , 75.0% for AGIs over 200k )
Averages for the 2004 tax year for zip code 11411, filed in 2005:
Average Adjusted Gross Income (AGI) in 2004: $41,141 (Individual Income Tax Returns) Here:
$41,141State:
$59,519
Salary/wage: $40,145 (reported on 86.2% of returns )Here:
$40,145State:
$50,673
(% of AGI for various income ranges: 81.5% for AGIs below $10k , 77.1% for AGIs $10k-25k , 87.1% for AGIs $25k-50k , 86.0% for AGIs $50k-75k , 84.9% for AGIs $75k-100k , 80.4% for AGIs over 100k ) Taxable interest for individuals: $511 (reported on 44.1% of returns )This zip code:
$511New York:
$2,377
(% of AGI for various income ranges: 2.1% for AGIs below $10k , 0.9% for AGIs $10k-25k , 0.5% for AGIs $25k-50k , 0.5% for AGIs $50k-75k , 0.4% for AGIs $75k-100k , 0.5% for AGIs over 100k ) Taxable dividends: $569 (reported on 14.5% of returns )(% of AGI for various income ranges: 0.6% for AGIs below $10k , 0.4% for AGIs $10k-25k , 0.2% for AGIs $25k-50k , 0.1% for AGIs $50k-75k , 0.2% for AGIs $75k-100k , 0.2% for AGIs over 100k ) Net capital gain/loss: +$1,710 (reported on 7.8% of returns )Here:
+$1,710State:
+$23,581
(% of AGI for various income ranges: -0.7% for AGIs below $10k , -0.2% for AGIs $10k-25k , 0.1% for AGIs $25k-50k , -0.1% for AGIs $50k-75k , 0.4% for AGIs $75k-100k , 1.4% for AGIs over 100k ) Profit/loss from business: +$4,917 (reported on 10.9% of returns )Here:
+$4,917State:
+$13,809
(% of AGI for various income ranges: 16.4% for AGIs below $10k , 4.7% for AGIs $10k-25k , 0.5% for AGIs $25k-50k , 0.5% for AGIs $50k-75k , 0.7% for AGIs $75k-100k , 1.0% for AGIs over 100k ) IRA payment deduction: $2,220 (reported on 1.6% of returns )11411:
$2,220New York:
$3,115
(% of AGI for various income ranges: 0.2% for AGIs $10k-25k , 0.1% for AGIs $25k-50k , 0.1% for AGIs $50k-75k , 0.1% for AGIs over 100k ) Self-employed pension: $4,636 (reported on 0.1% of returns )Here:
$4,636New York:
$19,016
Total itemized deductions: $20,614 (35% of AGI, reported on 52.5% of returns )Here:
$20,614State:
$25,864
Here:
34.7% of AGIState:
21.9% of AGI
(% of AGI for various income ranges: 12.4% for AGIs below $10k , 17.8% for AGIs $10k-25k , 26.3% for AGIs $25k-50k , 29.7% for AGIs $50k-75k , 29.4% for AGIs $75k-100k , 24.7% for AGIs over 100k ) Charity contributions deductions: $3,880 (6% of AGI, reported on 49.1% of returns )Here:
6.4% of AGIState:
3.6% of AGI
(% of AGI for various income ranges: 0.8% for AGIs below $10k , 2.7% for AGIs $10k-25k , 4.7% for AGIs $25k-50k , 5.4% for AGIs $50k-75k , 5.0% for AGIs $75k-100k , 4.6% for AGIs over 100k ) Total tax: $4,508 (reported on 73.8% of returns )11411:
$4,508State:
$11,730
(% of AGI for various income ranges: 3.3% for AGIs below $10k , 3.2% for AGIs $10k-25k , 5.3% for AGIs $25k-50k , 8.1% for AGIs $50k-75k , 9.6% for AGIs $75k-100k , 13.7% for AGIs over 100k ) Earned income credit: $1,558 (reported on 16.6% of returns )Percentage of individuals using paid preparers for their 2004 taxes: 67.6%(% for various income ranges: 60.2% for AGIs below $10k , 69.3% for AGIs $10k-25k , 68.5% for AGIs $25k-50k , 68.9% for AGIs $50k-75k , 69.7% for AGIs $75k-100k , 68.9% for AGIs over 100k )
Estimated median household income in 2022: This zip code:
$114,388New York:
$79,557
Nearest zip codes: 11429 ,
11412 ,
11428 ,
11413 ,
11003 ,
11422 .
New York Zip Code Map
Percentage of family households: This zip code:
37.5%New York:
41.3%
Percentage of households with unmarried partners: This zip code:
2.5%New York:
42.3%
Likely homosexual households (counted as self-reported same-sex unmarried-partner households)
Lesbian couples: 0.3% of all households Gay men: 0.0% of all households
Household received Food Stamps/SNAP in the past 12 months: 709Household did not receive Food Stamps/SNAP in the past 12 months: 5,993
Women who had a birth in the past 12 months: 126 (99 now married , 26 unmarried) Women who did not have a birth in the past 12 months: 4,477 (1,306 now married , 3,185 unmarried)
Housing units in zip code 11411 with a mortgage: 3,866 (245
second mortgage , 189
both second mortgage and home equity loan )
Houses without a mortgage: 67
Median monthly owner costs for units with a mortgage: $2,884
Median monthly owner costs for units without a mortgage: $996
Residents with income below the poverty level in 2022:
This zip code:
5.4%Whole state:
14.3%
Residents with income below 50% of the poverty level in 2022:
This zip code:
2.8%Whole state:
6.8%
Median number of rooms in houses and condos: Median number of rooms in apartments: Notable locations in this zip code not listed on our city pages
Click to draw/clear zip code borders Notable location: (A) . Display/hide its location on the map
Churches in zip code 11411 include: (A) , Sacred Heart Church (B) , Prince of Peace Lutheran Church (C) , Holy Trinity Parish Church (D) , Cambria Heights Community Church (E) , Revealed Word Christian Center (F) , Deliverance Baptist Church (G) , First Assembly of God Haitian Church (H) , Praise And Worship Outreach (I) . Display/hide their locations on the map
Parks in zip code 11411 include: (1) , Frederick Cabbell Park (2) , Delphin H Greene Playground (3) . Display/hide their locations on the map
Year house built (houses)
0 2020 or later30 2010 to 201935 2000 to 2009117 1990 to 199946 1980 to 1989258 1970 to 1979525 1960 to 19691,664 1950 to 19592,466 1940 to 19491,692 1939 or earlier
Zip code 11411 household income distribution in 2022 252 Less than $10,00099 $10,000 to $14,999131 $15,000 to $19,99982 $20,000 to $24,999189 $25,000 to $29,999149 $30,000 to $34,999191 $35,000 to $39,99986 $40,000 to $44,999169 $45,000 to $49,999230 $50,000 to $59,999518 $60,000 to $74,999735 $75,000 to $99,999782 $100,000 to $124,999870 $125,000 to $149,999823 $150,000 to $199,9991,386 $200,000 or moreEstimate of home value of owner-occupied houses/condos in 2022 in zip code 11411 33 Less than $10,0005 $20,000 to $24,99949 $40,000 to $49,99918 $50,000 to $59,99924 $60,000 to $69,99928 $70,000 to $79,9992 $80,000 to $89,99942 $125,000 to $149,99917 $150,000 to $174,9993 $175,000 to $199,9999 $200,000 to $249,99980 $250,000 to $299,999324 $300,000 to $399,999898 $400,000 to $499,9993,876 $500,000 to $749,999553 $750,000 to $999,99970 $1,000,000 to $1,499,99942 $2,000,000 or moreRent paid by renters in 2022 in zip code 11411 2 $200 to $24913 $250 to $29915 $300 to $34923 $600 to $6492 $650 to $69932 $750 to $79937 $800 to $899120 $900 to $99976 $1,000 to $1,249169 $1,250 to $1,499265 $1,500 to $1,999108 $2,000 to $2,49928 $2,500 to $2,99941 No cash rent
Median gross rent in 2022: $1,641.
Median price asked for vacant for-sale houses and condos in 2022: $711,889.
Estimated median house (or condo) value in 2022 for: White Non-Hispanic householders: $564,375Black or African American householders: $614,505American Indian or Alaska Native householders: $622,472Asian householders: $585,290Some other race householders: $673,598Two or more races householders: $610,853Hispanic or Latino householders: $646,707Estimated median house or condo value in 2022: $616,497
11411:
$616,497New York:
$400,400
Lower value quartile - upper value quartile: $519,127 - $705,894
Mean price in 2022: Detached houses: $888,942Here:
$888,942State:
$476,719
Townhouses or other attached units: $905,612Here:
$905,612State:
$699,270
In 2-unit structures: $921,787Here:
$921,787State:
$713,077
In 3-to-4-unit structures: $1,024,741Here:
$1,024,741State:
$764,568
In 5-or-more-unit structures: $1,061,560Here:
$1,061,560State:
$912,009
Mobile homes: $264,539Here:
$264,539State:
$88,925
Occupied boats, RVs, vans, etc.: $811,842Here:
$811,842State:
$480,795
Housing units in structures:
One, detached: 4,559One, attached: 1,038Two: 9183 or 4: 2615 to 9: 1410 to 19: 1220 to 49: 2650 or more: 12Mobile homes: 22Unemployment : 4.8%
Means of transportation to work in zip code 11411 52.1% 5,481 Drove a car alone5.3% 562 Carpooled16.9% 1,778 Bus or trolley bus12.0% 1,267 Streetcar or trolley car1.4% 149 Subway or elevated0.2% 21 Railroad0.1% 13 Taxi0.7% 76 Bicycle1.4% 144 Walked0.5% 52 Other means7.8% 826 Worked at homeTravel time to work (commute) in zip code 11411 142 Less than 5 minutes166 5 to 9 minutes325 10 to 14 minutes628 15 to 19 minutes862 20 to 24 minutes357 25 to 29 minutes1,732 30 to 34 minutes126 35 to 39 minutes478 40 to 44 minutes1,082 45 to 59 minutes1,817 60 to 89 minutes1,821 90 or more minutes
Neighborhoods in zip code 11411: Percentage of zip code residents living and working in this county: 48.6%
Household type by relationship:
Households: 20,990
Male householders: 3,052 (626 living alone ), Female householders: 3,701 (734 living alone )3,014 spouses (2,994 opposite-sex spouses ), 198 unmarried partners , (198 opposite-sex unmarried partners ), 6,180 children (5,767 natural , 254 adopted , 152 stepchildren ), 1,338 grandchildren , 460 brothers or sisters , 336 parents , 40 foster children , 1,536 other relatives , 818 non-relatives In group quarters: 23 (-1 institutionalized population )
Size of family households: 1,512 2-persons , 1,304 3-persons , 1,110 4-persons , 709 5-persons , 191 6-persons , 266 7-or-more-persons
Size of nonfamily households: 1,359 1-person , 174 2-persons , 26 3-persons , 4 5-persons
1,677 married couples with children. single-parent households (83 men , 367 women ).
79.9% of residents of 11411 zip code speak English at home. of residents speak Spanish at home (59% very well, 19% well, 18% not well, 4% not at all ).of residents speak other Indo-European language at home (71% very well, 19% well, 9% not well, 1% not at all ).of residents speak Asian or Pacific Island language at home (99% very well, 1% well ).of residents speak other language at home (88% very well, 5% well, 7% not well ).
Foreign born population: 8,573 (40.8%)
(75.8%
of them are naturalized citizens )
This zip code:
40.8%Whole state:
22.7%
35% Haiti 17% Grenada 12% Ecuador 7% St. Vincent and the Grenadines 3% Dominica 2% Cabo Verde 2% Uruguay 22% Jamaican 12% Haitian 5% Guyanese 4% Trinidadian and Tobagonian 3% West Indian 3% American 2% Ghanaian
Year of entry for the foreign-born population
1,479 2010 or later 1,333 2000 to 2009 1,565 1990 to 1999 4,308 Before 1990
Facilities with environmental interests located in this zip code:
HARRY'S SERVICE STATION (222-19 LINDEN BOULEVARD in QUEENS, NY)
(Integrated Compliance Information System) - ICIS-02-2005-7916, FORMAL ENFORCEMENT ACTION, ENFORCEMENT/COMPLIANCE ACTIVITY (Integrated Compliance Information System) - ICIS-02-2005-7916, FORMAL ENFORCEMENT ACTION, ENFORCEMENT/COMPLIANCE ACTIVITY
AMCO CLEANERS (219-16 LINDEN BLVD in CAMBRIA HEIGHTS, NY)
AIR MINOR (AIRS/AFS) STATE MASTER (New York facility tracking) - AIR PROGRAM, HAZARDOUS WASTE PROGRAM Small Quantity Generators, between 100 kg and 1000 kg of hazardous waste/month (Resource Conservation and Recovery Act (tracking hazardous waste)) - notification Business SIC classification: DRYCLEANING PLANTS, EXCEPT RUG CLEANINGBusiness NAICS classification: DRYCLEANING AND LAUNDRY SERVICES (EXCEPT COIN-OPERATED).Organizations: LUMAL CLEANERS INC (CONTACT/OWNER)
HUMANITIES & THE ARTS MAGNET HS ( in CAMBRIA HEIGHTS, NY)
(National Center for Education Statistics) - STATE ID-347800010498 Organizations: NEW YORK CITY PUBLIC SCHOOLS (SCHOOL DISTRICT)
CITGO GAS STATION (117-01 SPRINGFIELD BLVD in CAMBRIA HEIGHTS, NY)
(Integrated Compliance Information System) - ICIS-02-2001-0004, FORMAL ENFORCEMENT ACTION ENFORCEMENT/COMPLIANCE ACTIVITY (Integrated Compliance Information System) Business SIC classification: GASOLINE SERVICE STATIONSAlternative names: CITYGAS CORP
ANDREW JACKSON HIGH SCHOOL (207-01 116TH AVE in CAMBRIA HEIGHTS, NY)
(Resource Conservation and Recovery Act (tracking hazardous waste)) Alternative names: ANDREW JACKSON H S
Housing units lacking complete plumbing facilities: 0.5%
Housing units lacking complete kitchen facilities: 1.0%
80.3% Utility gas 15.0% Fuel oil, kerosene, etc. 2.8% Bottled, tank, or LP gas 1.4% Electricity
Population in 1990: 20,094. Population change in the 1990s: +1,188 (+5.9%).
Place of birth for U.S.-born residents:
This state: 10,384Northeast: 198Midwest: 146South: 1,243West: 139
76% of the 11411 zip code residents lived in the same house 5 years ago.
Out of people who lived in different houses, 58% lived in this county.
Out of people who lived in different counties, 50% lived in New York.
96% of the 11411 zip code residents lived in the same house 1 year ago.
Out of people who lived in different houses, 60% moved from this county.
Out of people who lived in different houses, 28% moved from different county within same state.
Out of people who lived in different houses, 9% moved from abroad.
Private vs. public school enrollment:
Students in private schools in grades 1 to 8 (elementary and middle school): 167
Students in private schools in grades 9 to 12 (high school): 104
Students in private undergraduate colleges: 278
Occupation by median earnings in the past 12 months ($)
109,007 Law enforcement workers including supervisors 102,509 Health diagnosing and treating practitioners and other technical occupations 99,858 Life, physical, and social science occupations 93,058 Computer and mathematical occupations 89,519 Architecture and engineering occupations 83,896 Management occupations
Companies with federal contracts located in this zip code:
LORED CONSTRUCTION CO (115-62 218TH ST in JAMAICA, NY; small business) in 34 contracts from 1999 to 2002
Contracts for Custodial Janitorial Services by Army, NavySigned by year: 2000: $30,190; 2001: $0; 2002: -$5,536; 2003: $0; 2004: $0; 2005: $0; 2006: $0.
Biggest contracts: with Army for Custodial Janitorial Services. Signed on 1999-12-03. Completion date: 2000-05-31.
with Navy for Custodial Janitorial Services. Signed on 2000-10-31. Completion date: 2001-09-30.
with Army for Custodial Janitorial Services. Taking place in ME. Signed on 2002-11-13. Completion date: 2003-01-31.
with Army for Custodial Janitorial Services. Taking place in MA. Signed on 2002-11-05. Completion date: 2002-02-28.
Top industries in this zip code by the number of employees in 2005:
Health Care and Social Assistance: Services for the Elderly and Persons with Disabilities (250-499 employees: 1 establishment)Accommodation and Food Services: Limited-Service Restaurants (50-99: 1, 20-49: 1, 1-4: 6)Other Services (except Public Administration): Religious Organizations (50-99: 1, 10-19: 1, 5-9: 3, 1-4: 3)Construction: Plumbing, Heating, and Air-Conditioning Contractors (50-99: 1, 20-49: 1, 1-4: 1)Educational Services: Elementary and Secondary Schools (20-49: 2, 10-19: 1)Health Care and Social Assistance: Vocational Rehabilitation Services (20-49: 2)Health Care and Social Assistance: Offices of Physicians (except Mental Health Specialists) (10-19: 1, 5-9: 4, 1-4: 5)Health Care and Social Assistance: Child Day Care Services (10-19: 1, 5-9: 3, 1-4: 2)Health Care and Social Assistance: Offices of Dentists (20-49: 1, 1-4: 1)
People in group quarters in 2010:
13 people in residential treatment centers for adults
4 people in other noninstitutional facilities
People in group quarters in 2000:
12 people in religious group quarters
Fatal accident statistics in 2014:
Fatal accident count: 1Vehicles involved in fatal accidents: 2Fatal accidents caused by drunken drivers: 0Fatalities: 1Persons involved in fatal accidents: 2Pedestrians involved in fatal accidents: 1
Fatal accident statistics in 2013:
Fatal accident count: 2Vehicles involved in fatal accidents: 2Fatal accidents caused by drunken drivers: 0Fatalities: 2Persons involved in fatal accidents: 2Pedestrians involved in fatal accidents: 0
Home Mortgage Disclosure Act Aggregated Statistics For Year 2009(Based on 16 full and 6 partial tracts) A) FHA, FSA/RHS & VA B) Conventional C) Refinancings D) Home Improvement Loans E) Loans on Dwellings For 5+ Families F) Non-occupant Loans on G) Loans On Manufactured Number Average Value Number Average Value Number Average Value Number Average Value Number Average Value Number Average Value Number Average Value
LOANS ORIGINATED 64 $373,501 22 $272,634 177 $274,974 13 $85,558 0 $0 2 $466,500 1 $279,000 APPLICATIONS APPROVED, NOT ACCEPTED 9 $312,941 5 $400,640 41 $253,084 16 $14,718 0 $0 0 $0 0 $0 APPLICATIONS DENIED 20 $368,169 25 $314,346 177 $282,135 33 $39,715 0 $0 13 $373,808 0 $0 APPLICATIONS WITHDRAWN 29 $375,807 10 $274,474 75 $313,531 6 $208,955 2 $551,000 2 $346,070 0 $0 FILES CLOSED FOR INCOMPLETENESS 4 $353,302 4 $272,250 33 $338,843 3 $234,000 0 $0 0 $0 0 $0
Aggregated Statistics For Year 2008(Based on 16 full and 6 partial tracts) A) FHA, FSA/RHS & VA B) Conventional C) Refinancings D) Home Improvement Loans E) Loans on Dwellings For 5+ Families F) Non-occupant Loans on G) Loans On Manufactured Number Average Value Number Average Value Number Average Value Number Average Value Number Average Value Number Average Value Number Average Value
LOANS ORIGINATED 31 $380,229 60 $377,244 206 $265,964 81 $67,733 1 $1,200,000 12 $301,867 0 $0 APPLICATIONS APPROVED, NOT ACCEPTED 2 $313,500 29 $347,808 70 $292,148 31 $48,901 0 $0 5 $269,234 0 $0 APPLICATIONS DENIED 11 $392,787 70 $388,778 231 $325,436 86 $49,273 1 $485,000 16 $390,101 0 $0 APPLICATIONS WITHDRAWN 12 $399,303 13 $403,639 80 $310,269 2 $100,000 2 $550,000 2 $259,820 1 $349,340 FILES CLOSED FOR INCOMPLETENESS 1 $360,000 14 $320,431 48 $310,491 3 $189,837 0 $0 1 $130,000 0 $0
Aggregated Statistics For Year 2007(Based on 16 full and 6 partial tracts) A) FHA, FSA/RHS & VA B) Conventional C) Refinancings D) Home Improvement Loans F) Non-occupant Loans on G) Loans On Manufactured Number Average Value Number Average Value Number Average Value Number Average Value Number Average Value Number Average Value
LOANS ORIGINATED 3 $345,020 225 $314,747 471 $290,237 94 $81,357 33 $290,452 1 $6,540 APPLICATIONS APPROVED, NOT ACCEPTED 3 $296,667 89 $289,745 142 $302,776 37 $86,359 10 $239,377 0 $0 APPLICATIONS DENIED 1 $368,000 268 $347,332 479 $310,973 123 $94,005 28 $269,033 1 $6,000 APPLICATIONS WITHDRAWN 0 $0 64 $317,026 168 $326,192 19 $137,496 11 $273,345 0 $0 FILES CLOSED FOR INCOMPLETENESS 2 $353,235 37 $338,972 57 $331,273 11 $182,952 2 $359,000 0 $0
Aggregated Statistics For Year 2006(Based on 16 full and 6 partial tracts) A) FHA, FSA/RHS & VA B) Conventional C) Refinancings D) Home Improvement Loans E) Loans on Dwellings For 5+ Families F) Non-occupant Loans on G) Loans On Manufactured Number Average Value Number Average Value Number Average Value Number Average Value Number Average Value Number Average Value Number Average Value
LOANS ORIGINATED 4 $299,888 529 $258,931 749 $279,702 129 $142,743 1 $7,000 40 $311,414 1 $228,970 APPLICATIONS APPROVED, NOT ACCEPTED 0 $0 110 $251,111 200 $264,185 38 $60,576 1 $6,000 11 $264,392 0 $0 APPLICATIONS DENIED 2 $263,000 328 $288,751 612 $294,456 149 $128,811 0 $0 31 $296,460 0 $0 APPLICATIONS WITHDRAWN 0 $0 182 $263,531 346 $264,883 23 $197,193 0 $0 29 $243,349 0 $0 FILES CLOSED FOR INCOMPLETENESS 0 $0 39 $295,747 123 $294,729 10 $104,112 0 $0 7 $361,931 0 $0
Aggregated Statistics For Year 2005(Based on 16 full and 6 partial tracts) A) FHA, FSA/RHS & VA B) Conventional C) Refinancings D) Home Improvement Loans E) Loans on Dwellings For 5+ Families F) Non-occupant Loans on G) Loans On Manufactured Number Average Value Number Average Value Number Average Value Number Average Value Number Average Value Number Average Value Number Average Value
LOANS ORIGINATED 4 $299,985 486 $240,157 808 $246,389 122 $134,460 1 $885,810 55 $248,832 2 $98,320 APPLICATIONS APPROVED, NOT ACCEPTED 0 $0 97 $242,546 141 $246,261 23 $49,787 0 $0 10 $280,813 0 $0 APPLICATIONS DENIED 1 $195,000 189 $232,564 517 $254,394 110 $101,115 0 $0 28 $234,132 1 $56,000 APPLICATIONS WITHDRAWN 4 $294,372 158 $260,582 427 $236,724 47 $136,253 2 $530,000 23 $255,498 2 $241,500 FILES CLOSED FOR INCOMPLETENESS 0 $0 43 $238,864 199 $271,967 2 $60,000 0 $0 2 $224,580 0 $0
Aggregated Statistics For Year 2004(Based on 16 full and 6 partial tracts) A) FHA, FSA/RHS & VA B) Conventional C) Refinancings D) Home Improvement Loans F) Non-occupant Loans on G) Loans On Manufactured Number Average Value Number Average Value Number Average Value Number Average Value Number Average Value Number Average Value
LOANS ORIGINATED 17 $274,251 401 $241,488 782 $215,157 130 $95,051 53 $228,589 2 $40,115 APPLICATIONS APPROVED, NOT ACCEPTED 2 $287,065 84 $281,333 146 $213,680 27 $114,703 11 $218,959 0 $0 APPLICATIONS DENIED 0 $0 136 $244,566 462 $236,878 152 $59,821 28 $197,531 1 $36,000 APPLICATIONS WITHDRAWN 2 $356,700 86 $251,066 471 $214,760 39 $95,913 23 $231,423 0 $0 FILES CLOSED FOR INCOMPLETENESS 2 $248,000 30 $257,453 121 $230,574 7 $117,061 5 $197,400 0 $0
Aggregated Statistics For Year 2003(Based on 16 full and 6 partial tracts) A) FHA, FSA/RHS & VA B) Conventional C) Refinancings D) Home Improvement Loans E) Loans on Dwellings For 5+ Families F) Non-occupant Loans on Number Average Value Number Average Value Number Average Value Number Average Value Number Average Value Number Average Value
LOANS ORIGINATED 75 $228,943 233 $240,278 1,127 $181,096 80 $47,506 0 $0 65 $184,690 APPLICATIONS APPROVED, NOT ACCEPTED 4 $198,845 52 $232,337 242 $181,412 38 $55,233 0 $0 19 $227,058 APPLICATIONS DENIED 9 $261,667 62 $234,156 541 $185,323 110 $40,021 1 $210,000 31 $149,818 APPLICATIONS WITHDRAWN 16 $233,996 50 $243,397 405 $186,500 24 $36,082 0 $0 5 $156,896 FILES CLOSED FOR INCOMPLETENESS 5 $269,210 10 $244,434 62 $182,785 2 $29,000 0 $0 0 $0
Aggregated Statistics For Year 2002(Based on 16 full and 6 partial tracts) A) FHA, FSA/RHS & VA B) Conventional C) Refinancings D) Home Improvement Loans F) Non-occupant Loans on Number Average Value Number Average Value Number Average Value Number Average Value Number Average Value
LOANS ORIGINATED 62 $228,775 165 $199,407 651 $157,202 70 $36,578 24 $152,734 APPLICATIONS APPROVED, NOT ACCEPTED 5 $246,984 26 $215,907 198 $147,883 35 $34,430 7 $98,724 APPLICATIONS DENIED 10 $256,954 38 $204,558 415 $146,926 84 $22,599 33 $101,434 APPLICATIONS WITHDRAWN 22 $232,408 48 $209,121 290 $160,127 46 $50,696 13 $168,639 FILES CLOSED FOR INCOMPLETENESS 3 $250,897 16 $225,585 124 $145,687 3 $20,333 7 $162,504
Aggregated Statistics For Year 2001(Based on 16 full and 6 partial tracts) A) FHA, FSA/RHS & VA B) Conventional C) Refinancings D) Home Improvement Loans E) Loans on Dwellings For 5+ Families F) Non-occupant Loans on Number Average Value Number Average Value Number Average Value Number Average Value Number Average Value Number Average Value
LOANS ORIGINATED 110 $208,795 153 $191,102 503 $149,848 57 $37,699 1 $88,970 22 $150,075 APPLICATIONS APPROVED, NOT ACCEPTED 3 $169,473 17 $173,929 163 $128,091 33 $38,906 0 $0 11 $110,386 APPLICATIONS DENIED 24 $220,912 61 $204,522 376 $127,650 153 $31,322 0 $0 27 $128,076 APPLICATIONS WITHDRAWN 30 $222,655 32 $163,415 354 $137,534 47 $32,204 0 $0 9 $94,943 FILES CLOSED FOR INCOMPLETENESS 2 $175,010 6 $141,218 74 $142,740 8 $28,702 0 $0 0 $0
Aggregated Statistics For Year 2000(Based on 16 full and 6 partial tracts) A) FHA, FSA/RHS & VA B) Conventional C) Refinancings D) Home Improvement Loans E) Loans on Dwellings For 5+ Families F) Non-occupant Loans on Number Average Value Number Average Value Number Average Value Number Average Value Number Average Value Number Average Value
LOANS ORIGINATED 109 $194,237 164 $170,543 215 $113,833 87 $18,108 1 $895,000 11 $141,839 APPLICATIONS APPROVED, NOT ACCEPTED 6 $209,998 30 $1,909,043 81 $122,512 71 $19,676 0 $0 5 $78,646 APPLICATIONS DENIED 16 $179,736 99 $151,675 291 $110,771 173 $21,993 0 $0 16 $99,358 APPLICATIONS WITHDRAWN 40 $191,369 31 $1,871,688 332 $100,571 16 $18,689 0 $0 6 $75,417 FILES CLOSED FOR INCOMPLETENESS 2 $218,950 6 $130,362 84 $130,782 5 $46,510 0 $0 0 $0
Aggregated Statistics For Year 1999(Based on 10 full and 7 partial tracts) A) FHA, FSA/RHS & VA B) Conventional C) Refinancings D) Home Improvement Loans E) Loans on Dwellings For 5+ Families F) Non-occupant Loans on Number Average Value Number Average Value Number Average Value Number Average Value Number Average Value Number Average Value
LOANS ORIGINATED 71 $180,501 80 $164,485 276 $112,672 103 $12,727 1 $98,840 12 $118,587 APPLICATIONS APPROVED, NOT ACCEPTED 5 $145,076 14 $129,422 204 $117,080 30 $25,838 0 $0 6 $118,137 APPLICATIONS DENIED 15 $191,269 43 $151,760 272 $111,736 80 $19,104 2 $400,780 12 $125,322 APPLICATIONS WITHDRAWN 21 $187,411 22 $146,583 205 $98,844 11 $25,623 0 $0 5 $139,006 FILES CLOSED FOR INCOMPLETENESS 3 $193,380 7 $182,534 100 $118,630 4 $68,600 0 $0 3 $97,700
Private Mortgage Insurance Companies Aggregated Statistics For Year 2009(Based on 13 full and 2 partial tracts) A) Conventional B) Refinancings Number Average Value Number Average Value
LOANS ORIGINATED 5 $345,708 5 $326,374 APPLICATIONS APPROVED, NOT ACCEPTED 7 $432,274 1 $347,000 APPLICATIONS DENIED 0 $0 0 $0 APPLICATIONS WITHDRAWN 0 $0 0 $0 FILES CLOSED FOR INCOMPLETENESS 0 $0 2 $332,800
Aggregated Statistics For Year 2008(Based on 16 full and 6 partial tracts) A) Conventional B) Refinancings C) Non-occupant Loans on Number Average Value Number Average Value Number Average Value
LOANS ORIGINATED 53 $414,399 21 $373,284 0 $0 APPLICATIONS APPROVED, NOT ACCEPTED 55 $422,309 27 $411,610 0 $0 APPLICATIONS DENIED 17 $383,425 6 $410,335 4 $360,155 APPLICATIONS WITHDRAWN 4 $512,105 3 $409,000 0 $0 FILES CLOSED FOR INCOMPLETENESS 0 $0 2 $417,000 0 $0
Aggregated Statistics For Year 2007(Based on 16 full and 6 partial tracts) A) Conventional B) Refinancings Number Average Value Number Average Value
LOANS ORIGINATED 43 $403,307 28 $412,425 APPLICATIONS APPROVED, NOT ACCEPTED 8 $390,166 12 $425,203 APPLICATIONS DENIED 3 $430,667 4 $514,487 APPLICATIONS WITHDRAWN 11 $410,763 8 $390,086 FILES CLOSED FOR INCOMPLETENESS 1 $594,000 0 $0
Aggregated Statistics For Year 2006(Based on 15 full and 6 partial tracts) A) Conventional B) Refinancings C) Non-occupant Loans on Number Average Value Number Average Value Number Average Value
LOANS ORIGINATED 20 $404,184 11 $400,755 0 $0 APPLICATIONS APPROVED, NOT ACCEPTED 8 $369,692 5 $349,782 2 $353,950 APPLICATIONS DENIED 0 $0 0 $0 0 $0 APPLICATIONS WITHDRAWN 1 $400,000 0 $0 0 $0 FILES CLOSED FOR INCOMPLETENESS 0 $0 0 $0 0 $0
Aggregated Statistics For Year 2005(Based on 16 full and 4 partial tracts) A) Conventional B) Refinancings C) Non-occupant Loans on Number Average Value Number Average Value Number Average Value
LOANS ORIGINATED 41 $328,917 12 $354,302 1 $252,000 APPLICATIONS APPROVED, NOT ACCEPTED 12 $335,406 9 $307,261 0 $0 APPLICATIONS DENIED 1 $323,000 0 $0 0 $0 APPLICATIONS WITHDRAWN 9 $338,737 1 $412,280 0 $0 FILES CLOSED FOR INCOMPLETENESS 2 $340,000 0 $0 0 $0
Aggregated Statistics For Year 2004(Based on 16 full and 6 partial tracts) A) Conventional B) Refinancings C) Non-occupant Loans on Number Average Value Number Average Value Number Average Value
LOANS ORIGINATED 84 $299,442 29 $255,881 2 $314,625 APPLICATIONS APPROVED, NOT ACCEPTED 30 $288,121 17 $277,111 0 $0 APPLICATIONS DENIED 4 $288,280 0 $0 1 $175,120 APPLICATIONS WITHDRAWN 9 $276,327 9 $277,182 0 $0 FILES CLOSED FOR INCOMPLETENESS 2 $325,000 4 $269,398 0 $0
Aggregated Statistics For Year 2003(Based on 16 full and 6 partial tracts) A) Conventional B) Refinancings C) Non-occupant Loans on Number Average Value Number Average Value Number Average Value
LOANS ORIGINATED 106 $270,934 49 $253,833 1 $168,130 APPLICATIONS APPROVED, NOT ACCEPTED 46 $256,752 22 $224,690 0 $0 APPLICATIONS DENIED 3 $318,873 0 $0 2 $314,310 APPLICATIONS WITHDRAWN 15 $293,313 7 $218,794 1 $188,410 FILES CLOSED FOR INCOMPLETENESS 0 $0 0 $0 0 $0
Aggregated Statistics For Year 2002(Based on 16 full and 6 partial tracts) A) Conventional B) Refinancings C) Non-occupant Loans on Number Average Value Number Average Value Number Average Value
LOANS ORIGINATED 103 $231,602 49 $213,945 0 $0 APPLICATIONS APPROVED, NOT ACCEPTED 49 $233,339 24 $195,397 0 $0 APPLICATIONS DENIED 7 $238,860 4 $235,352 1 $242,000 APPLICATIONS WITHDRAWN 11 $236,799 6 $202,838 2 $136,000 FILES CLOSED FOR INCOMPLETENESS 6 $191,150 1 $284,000 2 $218,950
Aggregated Statistics For Year 2001(Based on 16 full and 6 partial tracts) A) Conventional B) Refinancings C) Non-occupant Loans on Number Average Value Number Average Value Number Average Value
LOANS ORIGINATED 93 $216,021 30 $198,589 1 $178,000 APPLICATIONS APPROVED, NOT ACCEPTED 34 $204,066 20 $197,684 0 $0 APPLICATIONS DENIED 4 $232,785 1 $290,610 2 $232,570 APPLICATIONS WITHDRAWN 2 $229,500 1 $277,800 0 $0 FILES CLOSED FOR INCOMPLETENESS 0 $0 0 $0 0 $0
Aggregated Statistics For Year 2000(Based on 16 full and 6 partial tracts) A) Conventional B) Refinancings C) Non-occupant Loans on Number Average Value Number Average Value Number Average Value
LOANS ORIGINATED 92 $186,101 11 $179,567 1 $127,000 APPLICATIONS APPROVED, NOT ACCEPTED 15 $183,250 4 $134,320 0 $0 APPLICATIONS DENIED 5 $194,200 2 $194,675 0 $0 APPLICATIONS WITHDRAWN 2 $160,040 0 $0 0 $0 FILES CLOSED FOR INCOMPLETENESS 0 $0 0 $0 0 $0
Aggregated Statistics For Year 1999(Based on 10 full and 7 partial tracts) A) Conventional B) Refinancings C) Non-occupant Loans on Number Average Value Number Average Value Number Average Value
LOANS ORIGINATED 47 $172,633 23 $154,899 1 $158,000 APPLICATIONS APPROVED, NOT ACCEPTED 6 $163,155 2 $169,490 0 $0 APPLICATIONS DENIED 3 $154,887 2 $140,610 0 $0 APPLICATIONS WITHDRAWN 2 $184,040 1 $210,170 0 $0 FILES CLOSED FOR INCOMPLETENESS 0 $0 1 $199,000 0 $0
2007 - 2018 National Fire Incident Reporting System (NFIRS) incidents See full 2006 National Fire Incident Reporting System statistics for zip code 11411, New York
Most common first names in zip code 11411 among deceased individuals Name Count Lived (average)
William 103 74.3 years John 96 71.6 years Mary 94 77.7 years James 93 69.9 years Joseph 88 74.5 years George 66 73.6 years Charles 58 72.8 years Robert 51 67.9 years Anna 48 81.5 years Thomas 42 71.8 years
Most common last names in zip code 11411 among deceased individuals Last name Count Lived (average)
Williams 42 70.3 years Brown 37 70.9 years Jones 37 69.3 years Smith 34 70.7 years Johnson 30 72.6 years Robinson 26 69.7 years Jackson 24 67.8 years Wilson 23 71.7 years Green 23 72.3 years Davis 21 64.7 years
Businesses in zip code 11411
Name Count Name Count
Circle K 1 McDonald's 1 FedEx 1 Nike 2 GNC 1 Rite Aid 1 KFC 1

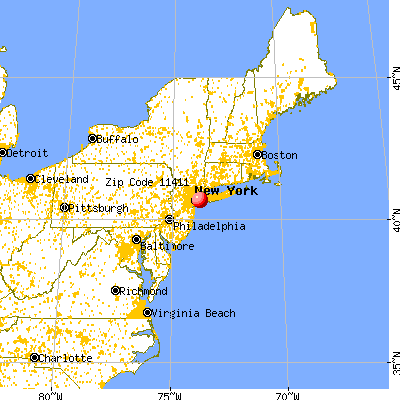


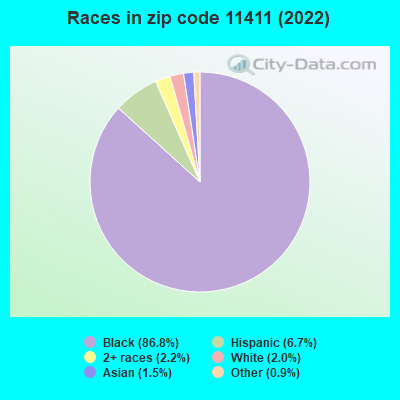


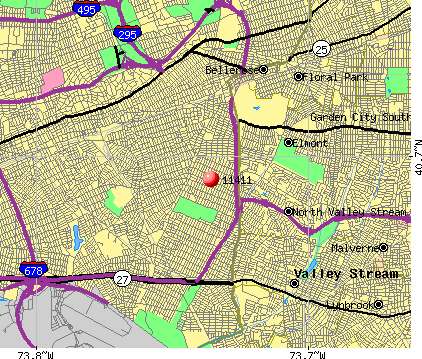 Nearest zip codes: 11429, 11412, 11428, 11413, 11003, 11422.
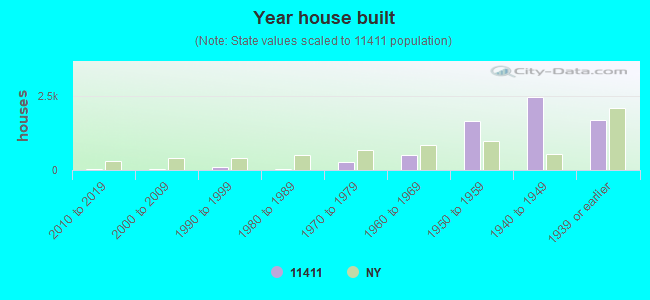

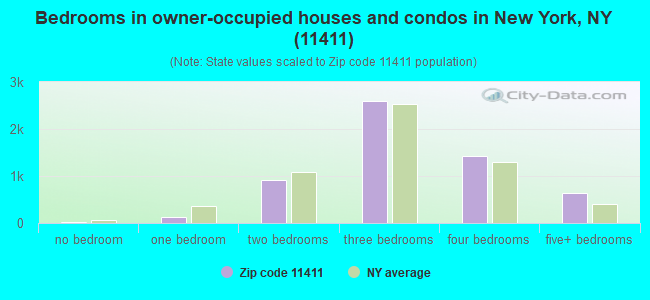
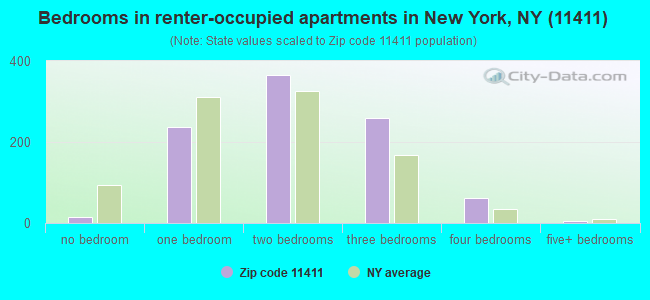
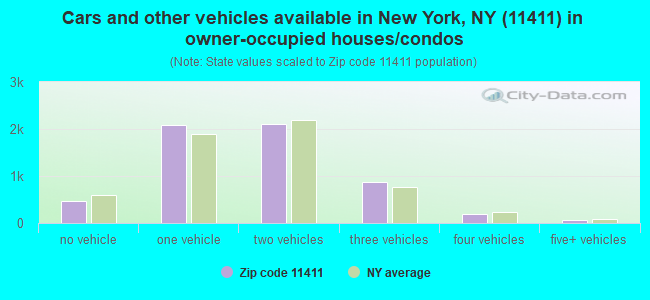
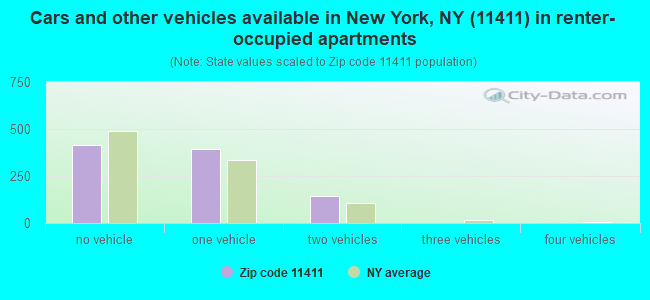


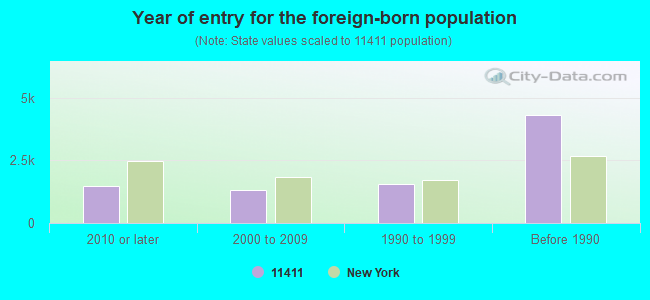


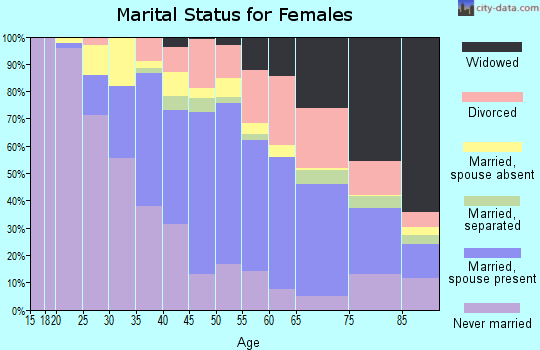
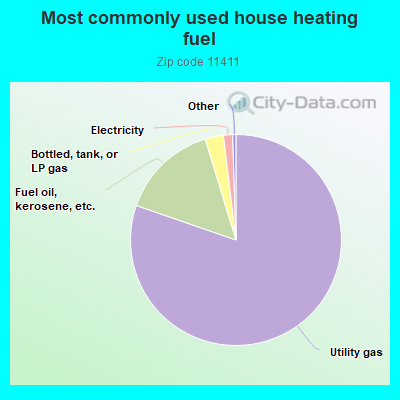
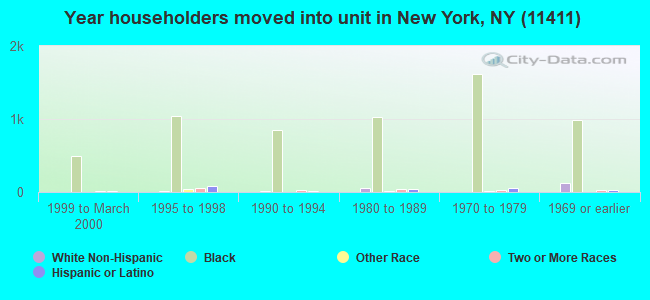
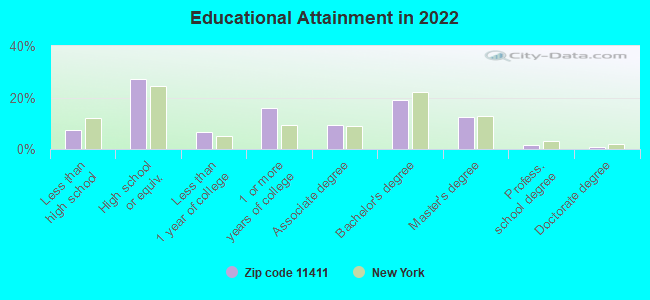
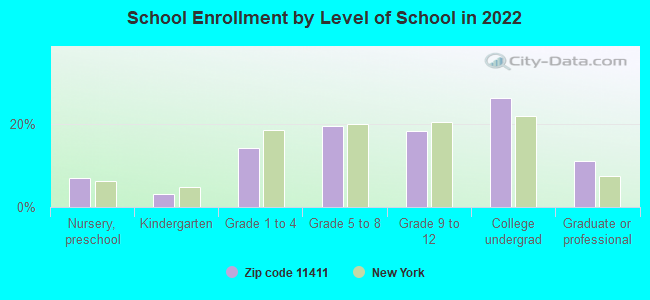
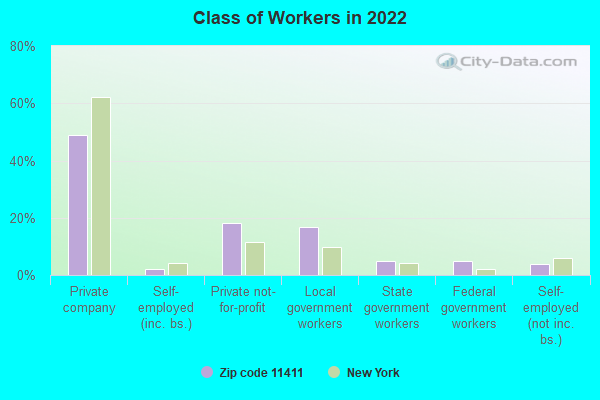
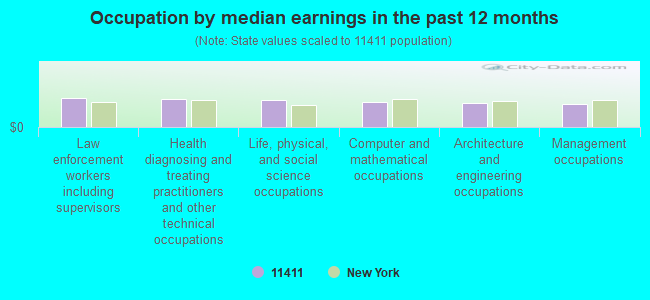
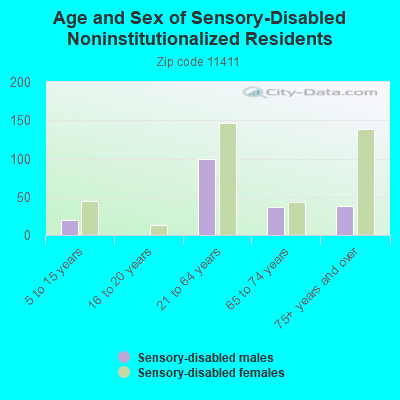
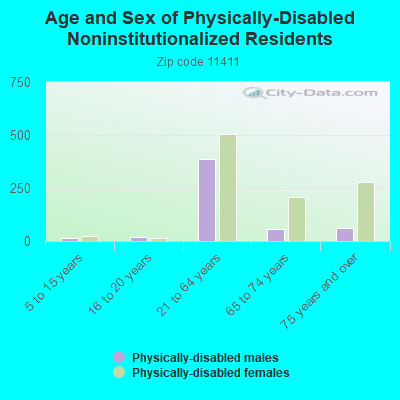
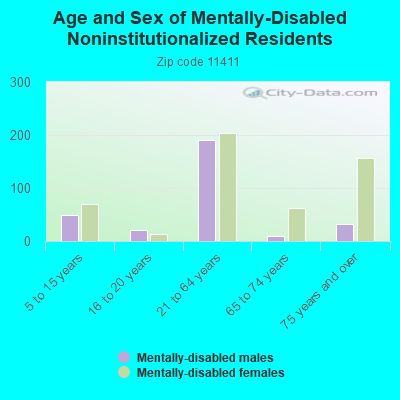
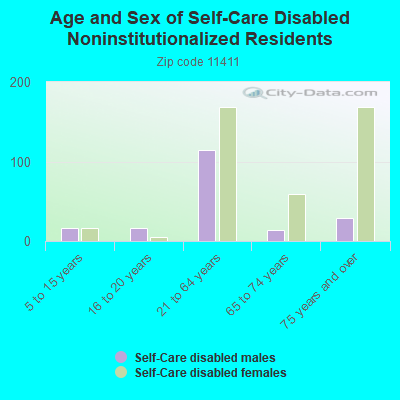
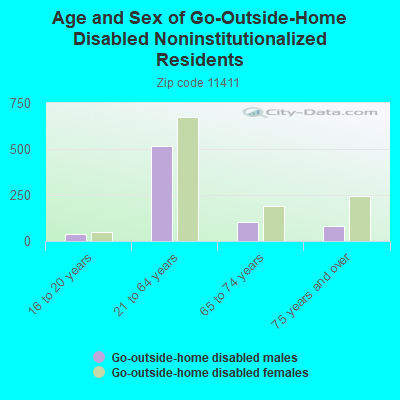
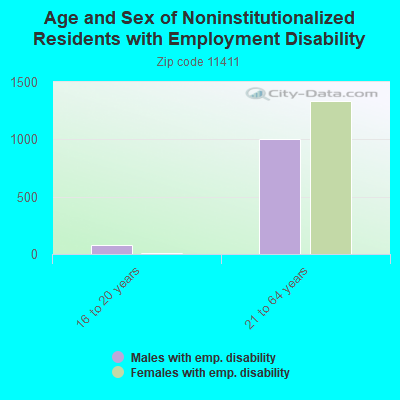
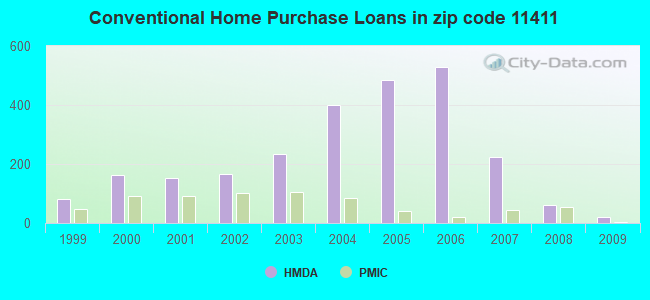
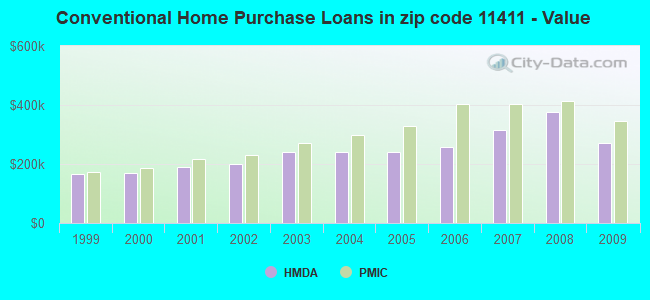
 According to the data from the years 2007 - 2018 the average number of fire incidents per year is 98. The highest number of reported fires - 126 took place in 2015, and the least - 61 in 2007. The data has an increasing trend.
 When looking into fire subcategories, the most reports belonged to: Structure Fires (79.1%), and Mobile Property/Vehicle Fires (9.5%).