Estimated zip code population in 2022: 46,761 Zip code population in 2010: 41,356 Zip code population in 2000: 40,507
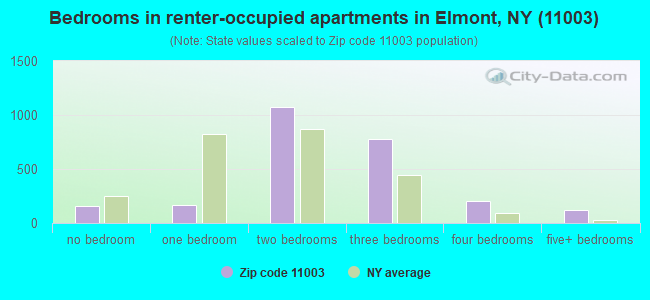
Houses and condos: 13,259 Renter-occupied apartments: 2,534
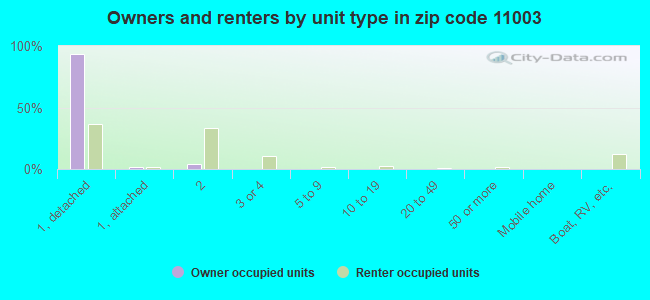
% of renters here:
20%
State:
46%
March 2022 cost of living index in zip code 11003: 150.2 (very high, U.S. average is 100)
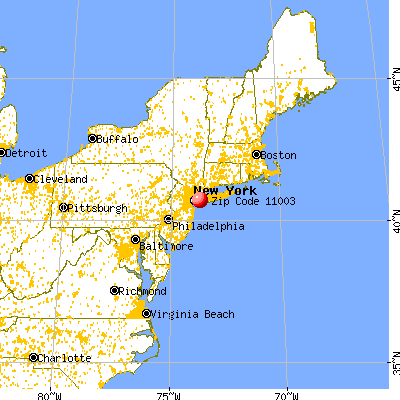
Land area: 4.1 sq. mi. Water area: 0.0 sq. mi.
Population density: 11,286 people per square mile
(high).
OSM Map
General Map
Google Map
MSN Map
OSM Map
General Map
Google Map
MSN Map
OSM Map
General Map
Google Map
MSN Map
OSM Map
General Map
Google Map
MSN Map
Please wait while loading the map...
Real estate property taxes paid for housing units in 2022:
This zip code:
1.8% ($9,805)
New York:
1.5% ($6,180)
Median real estate property taxes paid for housing units with mortgages in 2022: $9,858 (1.7%) Median real estate property taxes paid for housing units with no mortgage in 2022: $9,755 (1.9%)
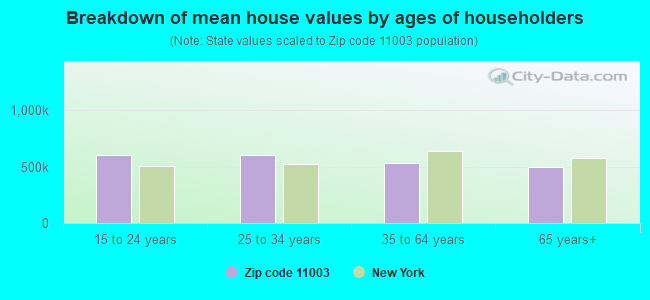
Estimated median house/condo value in 2022: $558,329
11003:
$558,329
New York:
$400,400
According to our research of New York and other state lists, there were 8 registered sex offenders living in 11003 zip code as of April 27, 2024. The ratio of all residents to sex offenders in zip code 11003 is 5,767 to 1. The ratio of registered sex offenders to all residents in this zip code is much lower than the state average.
Median resident age:
This zip code:
39.5 years
New York median age:
40.0 years
Average household size:
This zip code:
3.6 people
New York:
2.5 people
Averages for the 2020 tax year for zip code 11003, filed in 2021:
Average Adjusted Gross Income (AGI) in 2020: $58,599 (Individual Income Tax Returns)
Here:
$58,599
State:
$90,930
Salary/wage: $55,360 (reported on 83.6% of returns)
Here:
$55,360
State:
$72,104
(% of AGI for various income ranges: 1151.3% for AGIs below $25k, 3762.2% for AGIs $25k-50k, 7031.4% for AGIs $50k-75k, 10530.9% for AGIs $75k-100k, 19185.2% for AGIs $100k-200k, 68747.1% for AGIs over 200k)
Taxable interest for individuals: $622 (reported on 28.3% of returns)
This zip code:
$622
New York:
$3,075
(% of AGI for various income ranges: 8.4% for AGIs below $25k, 12.9% for AGIs $25k-50k, 17.3% for AGIs $50k-75k, 40.6% for AGIs $75k-100k, 69.1% for AGIs $100k-200k, 404.7% for AGIs over 200k)
Ordinary dividends: $1,931 (reported on 10.3% of returns)
Here:
$1,931
State:
$11,095
(% of AGI for various income ranges: 7.2% for AGIs below $25k, 9.3% for AGIs $25k-50k, 16.3% for AGIs $50k-75k, 38.9% for AGIs $75k-100k, 91.8% for AGIs $100k-200k, 648.2% for AGIs over 200k)
Net capital gain/loss in AGI: +$3,839 (reported on 10.7% of returns)
Here:
+$3,839
State:
+$44,925
(% of AGI for various income ranges: 7.4% for AGIs $25k-50k, 18.6% for AGIs $50k-75k, 58.3% for AGIs $75k-100k, 171.4% for AGIs $100k-200k, 2969.4% for AGIs over 200k)
Profit/loss from business: +$6,546 (reported on 19.0% of returns)
Here:
+$6,546
State:
+$14,940
(% of AGI for various income ranges: 204.5% for AGIs below $25k, 118.5% for AGIs $25k-50k, 88.8% for AGIs $50k-75k, 68.8% for AGIs $75k-100k, 198.6% for AGIs $100k-200k, 3962.9% for AGIs over 200k)
Taxable individual retirement arrangement distribution: $14,767 (reported on 3.8% of returns)
11003:
$14,767
New York:
$19,609
(% of AGI for various income ranges: 26.3% for AGIs below $25k, 32.9% for AGIs $25k-50k, 62.1% for AGIs $50k-75k, 136.7% for AGIs $75k-100k, 232.0% for AGIs $100k-200k, 1209.4% for AGIs over 200k)
Self-employed (Keogh) retirement plans: $20,550 (reported on 0.1% of returns)
11003:
$20,550
New York:
$32,497
(% of AGI for various income ranges: 7.7% for AGIs $25k-50k)
Total itemized deductions: $26,948 (reported on 15.9% of returns)
Here:
$26,948
State:
$39,326
(% of AGI for various income ranges: 91.7% for AGIs below $25k, 227.3% for AGIs $25k-50k, 604.8% for AGIs $50k-75k, 1165.7% for AGIs $75k-100k, 2106.6% for AGIs $100k-200k, 5509.4% for AGIs over 200k)
Charity contributions: $5,769 (reported on 13.1% of returns)
Here:
$5,769
State:
$15,420
(% of AGI for various income ranges: 5.3% for AGIs below $25k, 23.4% for AGIs $25k-50k, 80.3% for AGIs $50k-75k, 172.4% for AGIs $75k-100k, 438.8% for AGIs $100k-200k, 1864.1% for AGIs over 200k)
Taxes paid: $9,682 (reported on 15.8% of returns)
11003:
$9,682
State:
$9,183
(% of AGI for various income ranges: 37.4% for AGIs below $25k, 84.3% for AGIs $25k-50k, 230.5% for AGIs $50k-75k, 421.7% for AGIs $75k-100k, 741.7% for AGIs $100k-200k, 1551.8% for AGIs over 200k)
Earned income credit: $1,974 (reported on 15.3% of returns)
Here:
$1,974
State:
$2,138
(% of AGI for various income ranges: 88.4% for AGIs below $25k, 59.3% for AGIs $25k-50k, 0.7% for AGIs $50k-75k)
Percentage of individuals using paid preparers for their 2020 taxes: 94.1%
Here:
94%
State:
95%
(% for various income ranges: 91.6% for AGIs below $25k, 95.3% for AGIs $25k-50k, 94.9% for AGIs $50k-75k, 94.9% for AGIs $75k-100k, 95.5% for AGIs $100k-200k, 94.5% for AGIs over 200k)
Averages for the 2012 tax year for zip code 11003, filed in 2013:
Average Adjusted Gross Income (AGI) in 2012: $48,667 (Individual Income Tax Returns)
Here:
$48,667
State:
$77,088
Salary/wage: $47,710 (reported on 86.4% of returns)
Here:
$47,710
State:
$60,593
(% of AGI for various income ranges: 74.7% for AGIs below $25k, 88.1% for AGIs $25k-50k, 86.6% for AGIs $50k-75k, 87.0% for AGIs $75k-100k, 85.6% for AGIs $100k-200k, 73.8% for AGIs over 200k)
Taxable interest for individuals: $493 (reported on 31.0% of returns)
This zip code:
$493
New York:
$3,125
(% of AGI for various income ranges: 0.7% for AGIs below $25k, 0.3% for AGIs $25k-50k, 0.4% for AGIs $50k-75k, 0.2% for AGIs $75k-100k, 0.2% for AGIs $100k-200k, 0.3% for AGIs over 200k)
Ordinary dividends: $1,825 (reported on 10.5% of returns)
Here:
$1,825
State:
$10,299
(% of AGI for various income ranges: 0.6% for AGIs below $25k, 0.3% for AGIs $25k-50k, 0.3% for AGIs $50k-75k, 0.3% for AGIs $75k-100k, 0.4% for AGIs $100k-200k, 0.7% for AGIs over 200k)
Net capital gain/loss in AGI: +$935 (reported on 7.2% of returns)
Here:
+$935
State:
+$42,474
(% of AGI for various income ranges: 3.7% for AGIs over 200k)
Profit/loss from business: +$8,046 (reported on 15.8% of returns)
Here:
+$8,046
State:
+$16,168
(% of AGI for various income ranges: 13.5% for AGIs below $25k, 2.4% for AGIs $25k-50k, 1.3% for AGIs $50k-75k, 0.8% for AGIs $75k-100k, 1.0% for AGIs $100k-200k, 2.8% for AGIs over 200k)
Taxable individual retirement arrangement distribution: $11,802 (reported on 5.0% of returns)
11003:
$11,802
New York:
$17,621
(% of AGI for various income ranges: 1.4% for AGIs below $25k, 0.9% for AGIs $25k-50k, 1.3% for AGIs $50k-75k, 1.2% for AGIs $75k-100k, 1.3% for AGIs $100k-200k, 1.4% for AGIs over 200k)
Self-employment retirement plans: $7,767 (reported on 0.1% of returns)
11003:
$7,767
New York:
$27,330
Total itemized deductions: $24,239 (31% of AGI, reported on 43.1% of returns)
Here:
$24,239
State:
$34,985
Here:
30.8% of AGI
State:
21.3% of AGI
(% of AGI for various income ranges: 11.5% for AGIs below $25k, 18.9% for AGIs $25k-50k, 23.3% for AGIs $50k-75k, 24.8% for AGIs $75k-100k, 23.9% for AGIs $100k-200k, 18.6% for AGIs over 200k)
Charity contributions: $3,177 (reported on 37.1% of returns)
Here:
$3,177
State:
$5,572
(% of AGI for various income ranges: 0.7% for AGIs below $25k, 2.0% for AGIs $25k-50k, 2.8% for AGIs $50k-75k, 2.7% for AGIs $75k-100k, 2.9% for AGIs $100k-200k, 2.1% for AGIs over 200k)
Taxes paid: $9,793 (reported on 43.0% of returns)
11003:
$9,793
State:
$18,656
(% of AGI for various income ranges: 4.0% for AGIs below $25k, 6.4% for AGIs $25k-50k, 8.9% for AGIs $50k-75k, 10.2% for AGIs $75k-100k, 10.5% for AGIs $100k-200k, 9.3% for AGIs over 200k)
Earned income credit: $2,158 (reported on 20.2% of returns)
Here:
$2,158
State:
$2,230
(% of AGI for various income ranges: 7.1% for AGIs below $25k, 1.0% for AGIs $25k-50k)
Percentage of individuals using paid preparers for their 2012 taxes: 72.9%
Here:
73%
State:
66%
(% for various income ranges: 70.3% for AGIs below $25k, 71.9% for AGIs $25k-50k, 75.3% for AGIs $50k-75k, 76.4% for AGIs $75k-100k, 77.6% for AGIs $100k-200k, 79.2% for AGIs over 200k)
Averages for the 2004 tax year for zip code 11003, filed in 2005:
Average Adjusted Gross Income (AGI) in 2004: $42,628 (Individual Income Tax Returns)
Here:
$42,628
State:
$59,519
Salary/wage: $42,675 (reported on 87.4% of returns)
Here:
$42,675
State:
$50,673
(% of AGI for various income ranges: 90.3% for AGIs below $10k, 78.9% for AGIs $10k-25k, 90.0% for AGIs $25k-50k, 89.1% for AGIs $50k-75k, 89.3% for AGIs $75k-100k, 85.4% for AGIs over 100k)
Taxable interest for individuals: $845 (reported on 47.4% of returns)
This zip code:
$845
New York:
$2,377
(% of AGI for various income ranges: 4.1% for AGIs below $10k, 1.9% for AGIs $10k-25k, 0.9% for AGIs $25k-50k, 0.8% for AGIs $50k-75k, 0.7% for AGIs $75k-100k, 0.7% for AGIs over 100k)
Taxable dividends: $1,372 (reported on 16.5% of returns)
Here:
$1,372
State:
$5,394
(% of AGI for various income ranges: 1.8% for AGIs below $10k, 0.8% for AGIs $10k-25k, 0.4% for AGIs $25k-50k, 0.4% for AGIs $50k-75k, 0.3% for AGIs $75k-100k, 0.7% for AGIs over 100k)
Net capital gain/loss: +$3,710 (reported on 11.6% of returns)
Here:
+$3,710
State:
+$23,581
(% of AGI for various income ranges: -1.4% for AGIs below $10k, -0.0% for AGIs $10k-25k, 0.2% for AGIs $25k-50k, 0.2% for AGIs $50k-75k, 0.3% for AGIs $75k-100k, 3.4% for AGIs over 100k)
Profit/loss from business: +$7,855 (reported on 13.0% of returns)
Here:
+$7,855
State:
+$13,809
(% of AGI for various income ranges: 17.9% for AGIs below $10k, 8.1% for AGIs $10k-25k, 2.1% for AGIs $25k-50k, 1.2% for AGIs $50k-75k, 1.3% for AGIs $75k-100k, 1.4% for AGIs over 100k)
IRA payment deduction: $2,976 (reported on 2.3% of returns)
11003:
$2,976
New York:
$3,115
(% of AGI for various income ranges: 0.2% for AGIs below $10k, 0.2% for AGIs $10k-25k, 0.2% for AGIs $25k-50k, 0.1% for AGIs $50k-75k, 0.2% for AGIs $75k-100k, 0.1% for AGIs over 100k)
Self-employed pension: $7,295 (reported on 0.2% of returns)
Here:
$7,295
New York:
$19,016
(% of AGI for various income ranges: 0.1% for AGIs $10k-25k, 0.0% for AGIs $50k-75k, 0.1% for AGIs over 100k)
Total itemized deductions: $22,129 (35% of AGI, reported on 50.0% of returns)
Here:
$22,129
State:
$25,864
Here:
34.7% of AGI
State:
21.9% of AGI
(% of AGI for various income ranges: 14.8% for AGIs below $10k, 18.2% for AGIs $10k-25k, 27.1% for AGIs $25k-50k, 30.1% for AGIs $50k-75k, 28.0% for AGIs $75k-100k, 23.6% for AGIs over 100k)
Charity contributions deductions: $3,104 (5% of AGI, reported on 45.9% of returns)
Here:
$3,104
State:
$4,439
Here:
4.7% of AGI
State:
3.6% of AGI
(% of AGI for various income ranges: 0.7% for AGIs below $10k, 1.7% for AGIs $10k-25k, 3.3% for AGIs $25k-50k, 3.9% for AGIs $50k-75k, 3.7% for AGIs $75k-100k, 3.4% for AGIs over 100k)
Total tax: $4,926 (reported on 73.1% of returns)
11003:
$4,926
State:
$11,730
(% of AGI for various income ranges: 3.7% for AGIs below $10k, 3.6% for AGIs $10k-25k, 5.5% for AGIs $25k-50k, 7.5% for AGIs $50k-75k, 9.0% for AGIs $75k-100k, 13.8% for AGIs over 100k)
Earned income credit: $1,611 (reported on 15.9% of returns)
Here:
$1,611
State:
$1,757
Percentage of individuals using paid preparers for their 2004 taxes: 70.9%
Here:
71%
State:
67%
(% for various income ranges: 65.4% for AGIs below $10k, 70.2% for AGIs $10k-25k, 70.7% for AGIs $25k-50k, 73.3% for AGIs $50k-75k, 75.1% for AGIs $75k-100k, 76.3% for AGIs over 100k)
Likely homosexual households (counted as self-reported same-sex unmarried-partner households)
Lesbian couples: 0.2% of all households
Gay men: 0.1% of all households
Household received Food Stamps/SNAP in the past 12 months: 937 Household did not receive Food Stamps/SNAP in the past 12 months: 11,815
Women who had a birth in the past 12 months: 840 (769 now married, 61 unmarried) Women who did not have a birth in the past 12 months: 10,355 (3,541 now married, 6,824 unmarried)
Housing units in zip code 11003 with a mortgage: 7,358 (967 second mortgage, 45 home equity loan, 601 both second mortgage and home equity loan) Houses without a mortgage: 206
Median monthly owner costs for units with a mortgage: $3,276 Median monthly owner costs for units without a mortgage: $1,343
Residents with income below the poverty level in 2022:
This zip code:
5.0%
Whole state:
14.3%
Residents with income below 50% of the poverty level in 2022:
This zip code:
2.3%
Whole state:
6.8%
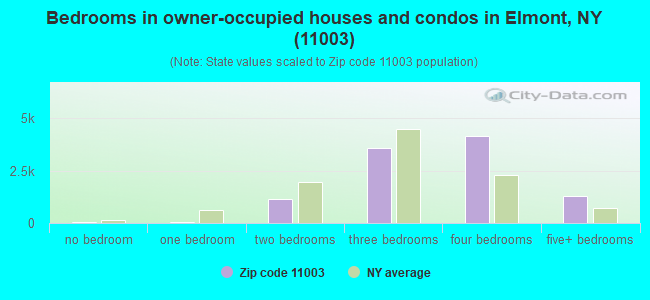
Median number of rooms in houses and condos:
Here:
6.6
State:
6.3
Median number of rooms in apartments:
Here:
4.9
State:
3.8
Notable locations in this zip code not listed on our city pages
Churches in zip code 11003 include: Church of Saint Matthew (A), India Gospel Assembly Church (B), Korean Church of Greater New York (C), Saint Basil Orthodox Church (D), Brooklyn Church of God (E), Gospel Faith Mission International (F), Trinity Baptist Church French Ministry (G), Muhammadi Masjid Mosque (H), Salem Assembly of God (I). Display/hide their locations on the map
5,174 married couples with children.
1,216 single-parent households (399 men, 817 women).
54.9% of residents of 11003 zip code speak English at home.
17.2% of residents speak Spanish at home (55% very well, 18% well, 19% not well, 8% not at all).
17.5% of residents speak other Indo-European language at home (68% very well, 20% well, 10% not well, 2% not at all).
8.5% of residents speak Asian or Pacific Island language at home (48% very well, 20% well, 19% not well, 12% not at all).
1.8% of residents speak other language at home (91% very well, 2% well, 7% not well).
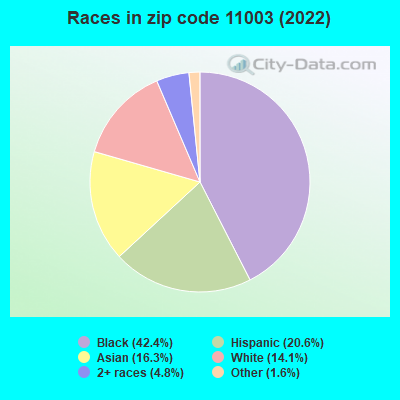
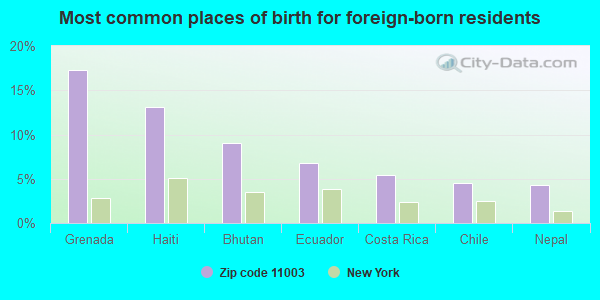
Foreign born population: 20,447 (43.7%) (74.1% of them are naturalized citizens)
Major facilities with environmental interests located in this zip code:
BELMONT PARK (2150 HEMPSTEAD TURNPIKE in ELMONT, NY)
STATE MASTER (New York facility tracking) - National Pollutant Discharge Elimination System Permit ENFORCEMENT/COMPLIANCE ACTIVITY (Integrated Compliance Information System) - ICIS-02-2003-7930, FORMAL ENFORCEMENT ACTION (Integrated Compliance Information System) - ICIS-02-2003-7930, FORMAL ENFORCEMENT ACTION National Pollutant Discharge Elimination System NON-MAJOR (Tracking pollutant discharge elimination systems) - permit (Resource Conservation and Recovery Act (tracking hazardous waste)) Business SIC classification: RACING, INCLUDING TRACK OPERATION Organizations: THE NEW YORK RACING ASSOCIATION INC Alternative names: NEW YORK RACING ASSOCIATION, NY RACING ASSOCIATION BELMONT PARK
GOTHAM AVE SCHOOL ( in ELMONT, NY)
(Geographic Names Information System) (National Center for Education Statistics) - STATE ID-280216020006 Organizations: ELMONT UFSD (SCHOOL DISTRICT)
COVERT AVE SCHOOL ( in ELMONT, NY)
(Geographic Names Information System) (National Center for Education Statistics) - STATE ID-280216020003 Organizations: ELMONT UFSD (SCHOOL DISTRICT)
CLARA H. CARLSON SCHOOL ( in ELMONT, NY)
(National Center for Education Statistics) - STATE ID-280216020002 Organizations: ELMONT UFSD (SCHOOL DISTRICT)
Small Quantity Generators, between 100 kg and 1000 kg of hazardous waste/month (Resource Conservation and Recovery Act (tracking hazardous waste)) Organizations: CUMBERLAND FARMS INC (CONTACT/OPERATOR)
, TOSCO (CONTACT/OWNER)
Alternative names: EXXON CO USA 37478, TOSCO #34782
AMOCO SERVICE STATION (724 ELMONT RD in ELMONT, NY)
(Resource Conservation and Recovery Act (tracking hazardous waste))
GETTY PETROLEUM CORP (1616 DUTCH BROADWAY in ELMONT, NY)
(Resource Conservation and Recovery Act (tracking hazardous waste))
GETTY PETROLEUM CORP (200 ELMONT RD in ELMONT, NY)
(Resource Conservation and Recovery Act (tracking hazardous waste))
GETTY SERVICE STATION (1641 HEMPSTEAD TNPK in ELMONT, NY)
Conditionally Exempt Small Quantity Generators, less than 100 kg/month of hazardous waste (Resource Conservation and Recovery Act (tracking hazardous waste)) - notification Organizations: GETTY PETROLEUM (CONTACT/OPERATOR)
GETTY SERVICE STATION (821 HEMPSTEAD TNPK in ELMONT, NY)
(Resource Conservation and Recovery Act (tracking hazardous waste)) Alternative names: GETTY PETROLEUM CORPORATION
HESS STATION 32494 (1740 HEMPSTEAD TNPK in ELMONT, NY)
(Resource Conservation and Recovery Act (tracking hazardous waste))
HOME DEPOT USA INC HD1208 (600 HEMPSTEAD TNPK in ELMONT, NY)
Small Quantity Generators, between 100 kg and 1000 kg of hazardous waste/month (Resource Conservation and Recovery Act (tracking hazardous waste)) Alternative names: HOME DEPOT THE 1208
J J & B AUTO BODY INC (581 HEMPSTEAD TNPK in ELMONT, NY)
(Resource Conservation and Recovery Act (tracking hazardous waste))
Housing units lacking complete plumbing facilities: 0.9% Housing units lacking complete kitchen facilities: 0.8%
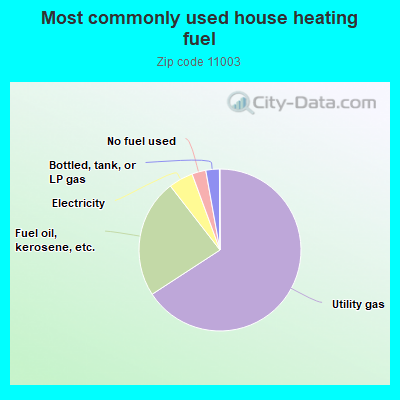
65.8%Utility gas
23.7%Fuel oil, kerosene, etc.
4.9%Electricity
2.8%No fuel used
2.7%Bottled, tank, or LP gas
Population in 1990: 34,741. Population change in the 1990s: +5,766 (+16.6%).
Place of birth for U.S.-born residents:
This state: 24,136
Northeast: 439
Midwest: 244
South: 731
West: 71
70% of the 11003 zip code residents lived in the same house 5 years ago. Out of people who lived in different houses, 40% lived in this county. Out of people who lived in different counties, 50% lived in New York.
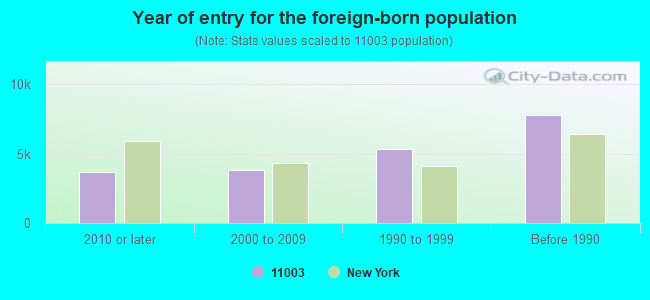
95% of the 11003 zip code residents lived in the same house 1 year ago. Out of people who lived in different houses, 33% moved from this county. Out of people who lived in different houses, 47% moved from different county within same state. Out of people who lived in different houses, 14% moved from different state. Out of people who lived in different houses, 7% moved from abroad.
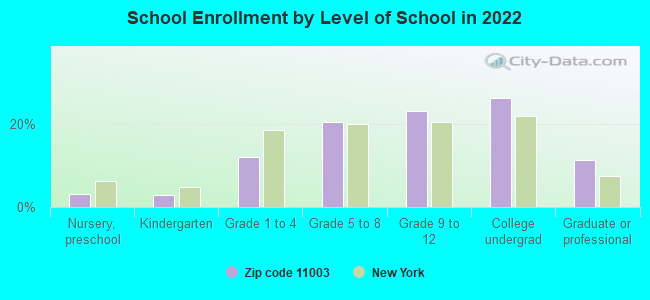
Private vs. public school enrollment:
Students in private schools in grades 1 to 8 (elementary and middle school): 286
Here:
8.4%
New York:
15.6%
Students in private schools in grades 9 to 12 (high school): 296
Here:
12.2%
New York:
15.0%
Students in private undergraduate colleges: 655
Here:
24.1%
New York:
39.2%
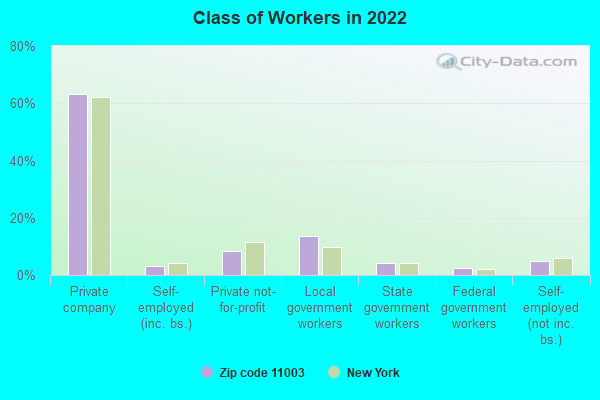
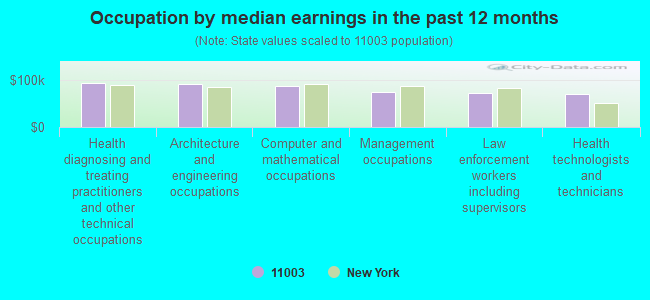
Occupation by median earnings in the past 12 months ($)
94,196Health diagnosing and treating practitioners and other technical occupations
92,901Architecture and engineering occupations
86,798Computer and mathematical occupations
74,261Management occupations
73,254Law enforcement workers including supervisors
71,389Health technologists and technicians
Companies with federal contracts located in this zip code:
EXCALIBUR SYSTEMS, INC (311 MEACHAM AVE in ELMONT, NY; small business) : $594,215 in 27 contractsfrom 2000 to 2006
Contracts for Electrical and Electronic Properties Measuring and Testing Instruments, Flight Instruments, Miscellaneous Aircraft Accessories and Components, Electrical and Electronic assemblies, Boards, Cards, and Associated Hardware, and moreby Army, Navy, Air Force, Defense Logistics Agency, and others Signed by year:2000: $286,000; 2001: $32,335; 2002: $35,694; 2003: $12,380; 2004: $78,948; 2005: $142,963; 2006: $5,895.
Biggest contracts:
$98,000 with Army for Electrical and Electronic Properties Measuring and Testing Instruments. Signed on 2000-04-28. Completion date: 2000-07-28.
$63,000 with Navy for Flight Instruments. Taking place in MD. Signed on 2000-05-23. Completion date: 2000-09-30.
$63,000, same as above.Signed on 2000-05-16. Completion date: 2000-08-16.
$62,000 with Army for Miscellaneous Aircraft Accessories and Components. Taking place in VA. Signed on 2000-08-14. Completion date: 2000-10-27.
CHRISTINA NATALE INC (1537 ROSSER AVENUE in ELMONT, NY; small business) : $115,026 in 3 contractsfrom 2001 to 2003
$67,466 with Defense Logistics Agency for Outerwear, Women's. Signed on 2001-03-20. Completion date: 2002-02-02.
$42,340 with Air Force for Outerwear, Men's. Signed on 2002-11-14. Completion date: 2003-01-15.
$5,220, same as above.Signed on 2003-03-15. Completion date: 2003-06-10.
AVIATION SAFETY FACILITATORS C (30 AMETHYST STREET in ELMONT, NY; small business)
$99,934 with Air Force for Defense Aircraft -- Management and Support (R&D). Signed on 2004-03-10. Completion date: 2004-12-15.
Top industries in this zip code by the number of employees in 2005:
2003 - 2018 National Fire Incident Reporting System (NFIRS) incidents
According to the data from the years 2003 - 2018 the average number of fire incidents per year is 57. The highest number of reported fire incidents - 547 took place in 2006, and the least - 0 in 2014. The data has a declining trend.
When looking into fire subcategories, the most reports belonged to: Other (65.1%), and Structure Fires (30.1%).
Fire incident types reported to NFIRS in Zip Code 11003


 Nearest zip codes: 11001, 11580, 11411, 11010, 11429, 11426.


 According to the data from the years 2003 - 2018 the average number of fire incidents per year is 57. The highest number of reported fire incidents - 547 took place in 2006, and the least - 0 in 2014. The data has a declining trend.
 When looking into fire subcategories, the most reports belonged to: Other (65.1%), and Structure Fires (30.1%).