Estimated zip code population in 2022: 25,723 Zip code population in 2010: 26,883 Zip code population in 2000: 25,511
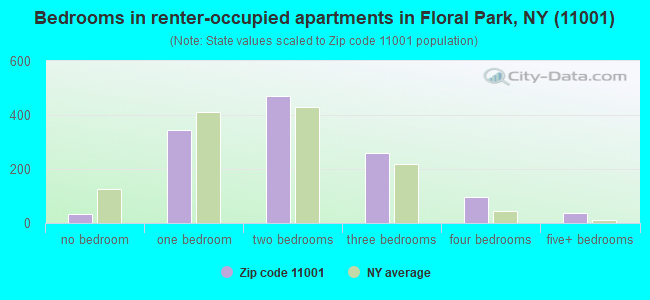
Houses and condos: 9,026 Renter-occupied apartments: 1,254
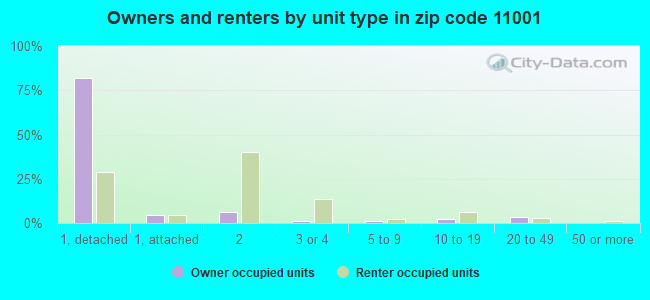
% of renters here:
14%
State:
46%
March 2022 cost of living index in zip code 11001: 149.9 (very high, U.S. average is 100)
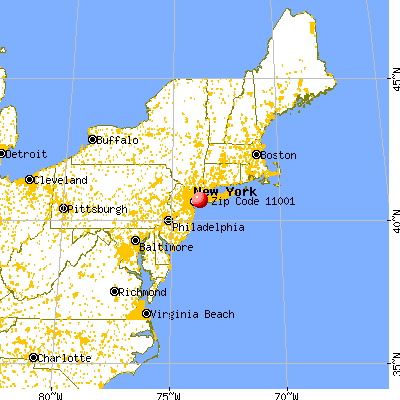
Land area: 2.2 sq. mi. Water area: 0.0 sq. mi.
Population density: 11,554 people per square mile
(high).
OSM Map
General Map
Google Map
MSN Map
OSM Map
General Map
Google Map
MSN Map
OSM Map
General Map
Google Map
MSN Map
OSM Map
General Map
Google Map
MSN Map
Please wait while loading the map...
Real estate property taxes paid for housing units in 2022:
This zip code:
1.4% ($9,805)
New York:
1.5% ($6,180)
Median real estate property taxes paid for housing units with mortgages in 2022: $9,858 (1.3%) Median real estate property taxes paid for housing units with no mortgage in 2022: $9,755 (1.4%)
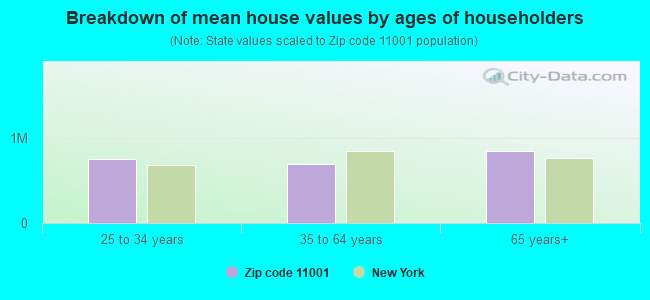
Estimated median house/condo value in 2022: $713,652
11001:
$713,652
New York:
$400,400
According to our research of New York and other state lists, there were 2 registered sex offenders living in 11001 zip code as of April 26, 2024. The ratio of all residents to sex offenders in zip code 11001 is 14,023 to 1. The ratio of registered sex offenders to all residents in this zip code is much lower than the state average.
Median resident age:
This zip code:
44.4 years
New York median age:
40.0 years
Average household size:
This zip code:
2.9 people
New York:
2.5 people
Averages for the 2020 tax year for zip code 11001, filed in 2021:
Average Adjusted Gross Income (AGI) in 2020: $95,483 (Individual Income Tax Returns)
Here:
$95,483
State:
$90,930
Salary/wage: $85,734 (reported on 80.4% of returns)
Here:
$85,734
State:
$72,104
(% of AGI for various income ranges: 1053.4% for AGIs below $25k, 3480.7% for AGIs $25k-50k, 6739.4% for AGIs $50k-75k, 9963.7% for AGIs $75k-100k, 19071.5% for AGIs $100k-200k, 68930.8% for AGIs over 200k)
Taxable interest for individuals: $1,501 (reported on 47.8% of returns)
This zip code:
$1,501
New York:
$3,075
(% of AGI for various income ranges: 33.1% for AGIs below $25k, 37.0% for AGIs $25k-50k, 64.8% for AGIs $50k-75k, 116.0% for AGIs $75k-100k, 187.6% for AGIs $100k-200k, 659.8% for AGIs over 200k)
Ordinary dividends: $6,242 (reported on 29.9% of returns)
Here:
$6,242
State:
$11,095
(% of AGI for various income ranges: 41.4% for AGIs below $25k, 65.1% for AGIs $25k-50k, 124.0% for AGIs $50k-75k, 166.6% for AGIs $75k-100k, 340.6% for AGIs $100k-200k, 2708.5% for AGIs over 200k)
Net capital gain/loss in AGI: +$11,649 (reported on 26.7% of returns)
Here:
+$11,649
State:
+$44,925
(% of AGI for various income ranges: 19.0% for AGIs below $25k, 37.9% for AGIs $25k-50k, 98.7% for AGIs $50k-75k, 166.1% for AGIs $75k-100k, 452.2% for AGIs $100k-200k, 5671.0% for AGIs over 200k)
Profit/loss from business: +$13,242 (reported on 16.9% of returns)
Here:
+$13,242
State:
+$14,940
(% of AGI for various income ranges: 206.9% for AGIs below $25k, 229.1% for AGIs $25k-50k, 188.2% for AGIs $50k-75k, 199.3% for AGIs $75k-100k, 432.9% for AGIs $100k-200k, 2042.5% for AGIs over 200k)
Taxable individual retirement arrangement distribution: $18,975 (reported on 9.5% of returns)
11001:
$18,975
New York:
$19,609
(% of AGI for various income ranges: 65.4% for AGIs below $25k, 106.1% for AGIs $25k-50k, 181.0% for AGIs $50k-75k, 363.0% for AGIs $75k-100k, 566.8% for AGIs $100k-200k, 1242.4% for AGIs over 200k)
Self-employed (Keogh) retirement plans: $30,300 (reported on 0.7% of returns)
11001:
$30,300
New York:
$32,497
(% of AGI for various income ranges: 24.6% for AGIs $100k-200k, 442.2% for AGIs over 200k)
Total itemized deductions: $28,822 (reported on 18.3% of returns)
Here:
$28,822
State:
$39,326
(% of AGI for various income ranges: 116.3% for AGIs below $25k, 257.1% for AGIs $25k-50k, 469.6% for AGIs $50k-75k, 977.0% for AGIs $75k-100k, 1629.4% for AGIs $100k-200k, 4479.8% for AGIs over 200k)
Charity contributions: $4,673 (reported on 16.2% of returns)
Here:
$4,673
State:
$15,420
(% of AGI for various income ranges: 6.7% for AGIs below $25k, 19.0% for AGIs $25k-50k, 58.2% for AGIs $50k-75k, 110.6% for AGIs $75k-100k, 221.6% for AGIs $100k-200k, 830.5% for AGIs over 200k)
Taxes paid: $9,676 (reported on 18.2% of returns)
11001:
$9,676
State:
$9,183
(% of AGI for various income ranges: 42.3% for AGIs below $25k, 93.9% for AGIs $25k-50k, 164.3% for AGIs $50k-75k, 349.7% for AGIs $75k-100k, 557.1% for AGIs $100k-200k, 1359.7% for AGIs over 200k)
Earned income credit: $1,793 (reported on 8.3% of returns)
Here:
$1,793
State:
$2,138
(% of AGI for various income ranges: 56.7% for AGIs below $25k, 49.4% for AGIs $25k-50k, 0.7% for AGIs $50k-75k)
Percentage of individuals using paid preparers for their 2020 taxes: 94.8%
Here:
95%
State:
95%
(% for various income ranges: 93.1% for AGIs below $25k, 94.8% for AGIs $25k-50k, 96.0% for AGIs $50k-75k, 94.2% for AGIs $75k-100k, 95.3% for AGIs $100k-200k, 97.0% for AGIs over 200k)
Averages for the 2012 tax year for zip code 11001, filed in 2013:
Average Adjusted Gross Income (AGI) in 2012: $80,565 (Individual Income Tax Returns)
Here:
$80,565
State:
$77,088
Salary/wage: $74,537 (reported on 82.3% of returns)
Here:
$74,537
State:
$60,593
(% of AGI for various income ranges: 65.3% for AGIs below $25k, 75.7% for AGIs $25k-50k, 75.9% for AGIs $50k-75k, 75.7% for AGIs $75k-100k, 79.8% for AGIs $100k-200k, 73.3% for AGIs over 200k)
Taxable interest for individuals: $1,198 (reported on 54.0% of returns)
This zip code:
$1,198
New York:
$3,125
(% of AGI for various income ranges: 2.2% for AGIs below $25k, 1.0% for AGIs $25k-50k, 1.0% for AGIs $50k-75k, 0.8% for AGIs $75k-100k, 0.6% for AGIs $100k-200k, 0.7% for AGIs over 200k)
Ordinary dividends: $3,765 (reported on 30.4% of returns)
Here:
$3,765
State:
$10,299
(% of AGI for various income ranges: 2.4% for AGIs below $25k, 1.6% for AGIs $25k-50k, 1.4% for AGIs $50k-75k, 1.4% for AGIs $75k-100k, 1.1% for AGIs $100k-200k, 1.7% for AGIs over 200k)
Net capital gain/loss in AGI: +$2,887 (reported on 23.1% of returns)
Here:
+$2,887
State:
+$42,474
(% of AGI for various income ranges: 0.2% for AGIs $25k-50k, 0.4% for AGIs $50k-75k, 0.3% for AGIs $75k-100k, 0.3% for AGIs $100k-200k, 2.2% for AGIs over 200k)
Profit/loss from business: +$13,995 (reported on 14.6% of returns)
Here:
+$13,995
State:
+$16,168
(% of AGI for various income ranges: 12.6% for AGIs below $25k, 4.5% for AGIs $25k-50k, 2.4% for AGIs $50k-75k, 2.0% for AGIs $75k-100k, 1.8% for AGIs $100k-200k, 1.7% for AGIs over 200k)
Taxable individual retirement arrangement distribution: $14,527 (reported on 11.3% of returns)
11001:
$14,527
New York:
$17,621
(% of AGI for various income ranges: 3.7% for AGIs below $25k, 3.0% for AGIs $25k-50k, 2.6% for AGIs $50k-75k, 2.8% for AGIs $75k-100k, 2.0% for AGIs $100k-200k, 1.1% for AGIs over 200k)
Self-employment retirement plans: $17,230 (reported on 0.7% of returns)
11001:
$17,230
New York:
$27,330
(% of AGI for various income ranges: 0.5% for AGIs below $25k, 0.1% for AGIs $100k-200k, 0.3% for AGIs over 200k)
Total itemized deductions: $29,427 (24% of AGI, reported on 53.5% of returns)
Here:
$29,427
State:
$34,985
Here:
23.7% of AGI
State:
21.3% of AGI
(% of AGI for various income ranges: 16.9% for AGIs below $25k, 18.2% for AGIs $25k-50k, 19.0% for AGIs $50k-75k, 21.6% for AGIs $75k-100k, 22.1% for AGIs $100k-200k, 16.3% for AGIs over 200k)
Charity contributions: $2,747 (reported on 49.3% of returns)
Here:
$2,747
State:
$5,572
(% of AGI for various income ranges: 1.0% for AGIs below $25k, 1.5% for AGIs $25k-50k, 1.8% for AGIs $50k-75k, 1.9% for AGIs $75k-100k, 1.9% for AGIs $100k-200k, 1.4% for AGIs over 200k)
Taxes paid: $15,537 (reported on 53.4% of returns)
11001:
$15,537
State:
$18,656
(% of AGI for various income ranges: 7.1% for AGIs below $25k, 6.8% for AGIs $25k-50k, 8.6% for AGIs $50k-75k, 10.7% for AGIs $75k-100k, 11.6% for AGIs $100k-200k, 10.6% for AGIs over 200k)
Earned income credit: $1,939 (reported on 9.0% of returns)
Here:
$1,939
State:
$2,230
(% of AGI for various income ranges: 4.0% for AGIs below $25k, 0.7% for AGIs $25k-50k)
Percentage of individuals using paid preparers for their 2012 taxes: 72.2%
Here:
72%
State:
66%
(% for various income ranges: 66.4% for AGIs below $25k, 71.0% for AGIs $25k-50k, 72.2% for AGIs $50k-75k, 76.4% for AGIs $75k-100k, 77.9% for AGIs $100k-200k, 75.6% for AGIs over 200k)
Averages for the 2004 tax year for zip code 11001, filed in 2005:
Average Adjusted Gross Income (AGI) in 2004: $64,641 (Individual Income Tax Returns)
Here:
$64,641
State:
$59,519
Salary/wage: $60,961 (reported on 81.6% of returns)
Here:
$60,961
State:
$50,673
(% of AGI for various income ranges: 114.2% for AGIs below $10k, 61.2% for AGIs $10k-25k, 77.9% for AGIs $25k-50k, 79.0% for AGIs $50k-75k, 80.5% for AGIs $75k-100k, 75.9% for AGIs over 100k)
Taxable interest for individuals: $1,450 (reported on 68.6% of returns)
This zip code:
$1,450
New York:
$2,377
(% of AGI for various income ranges: 10.4% for AGIs below $10k, 4.8% for AGIs $10k-25k, 2.2% for AGIs $25k-50k, 1.7% for AGIs $50k-75k, 1.4% for AGIs $75k-100k, 1.0% for AGIs over 100k)
Taxable dividends: $2,656 (reported on 38.7% of returns)
Here:
$2,656
State:
$5,394
(% of AGI for various income ranges: 7.7% for AGIs below $10k, 3.0% for AGIs $10k-25k, 1.5% for AGIs $25k-50k, 1.3% for AGIs $50k-75k, 1.1% for AGIs $75k-100k, 1.6% for AGIs over 100k)
Net capital gain/loss: +$6,602 (reported on 29.4% of returns)
Here:
+$6,602
State:
+$23,581
(% of AGI for various income ranges: -5.8% for AGIs below $10k, -0.2% for AGIs $10k-25k, -0.1% for AGIs $25k-50k, 0.2% for AGIs $50k-75k, 0.5% for AGIs $75k-100k, 5.6% for AGIs over 100k)
Profit/loss from business: +$14,009 (reported on 13.7% of returns)
Here:
+$14,009
State:
+$13,809
(% of AGI for various income ranges: 12.5% for AGIs below $10k, 9.4% for AGIs $10k-25k, 3.6% for AGIs $25k-50k, 2.2% for AGIs $50k-75k, 2.3% for AGIs $75k-100k, 2.6% for AGIs over 100k)
IRA payment deduction: $3,388 (reported on 3.8% of returns)
11001:
$3,388
New York:
$3,115
(% of AGI for various income ranges: 0.6% for AGIs below $10k, 0.3% for AGIs $10k-25k, 0.4% for AGIs $25k-50k, 0.2% for AGIs $50k-75k, 0.2% for AGIs $75k-100k, 0.1% for AGIs over 100k)
Self-employed pension: $13,311 (reported on 1.2% of returns)
Here:
$13,311
New York:
$19,016
(% of AGI for various income ranges: 0.2% for AGIs $10k-25k, 0.1% for AGIs $50k-75k, 0.1% for AGIs $75k-100k, 0.4% for AGIs over 100k)
Total itemized deductions: $23,577 (24% of AGI, reported on 54.7% of returns)
Here:
$23,577
State:
$25,864
Here:
23.9% of AGI
State:
21.9% of AGI
(% of AGI for various income ranges: 24.6% for AGIs below $10k, 19.6% for AGIs $10k-25k, 19.3% for AGIs $25k-50k, 22.4% for AGIs $50k-75k, 23.5% for AGIs $75k-100k, 18.4% for AGIs over 100k)
Charity contributions deductions: $2,854 (3% of AGI, reported on 52.3% of returns)
Here:
$2,854
State:
$4,439
Here:
2.8% of AGI
State:
3.6% of AGI
(% of AGI for various income ranges: 1.2% for AGIs below $10k, 1.8% for AGIs $10k-25k, 2.4% for AGIs $25k-50k, 2.8% for AGIs $50k-75k, 2.7% for AGIs $75k-100k, 2.1% for AGIs over 100k)
Total tax: $10,522 (reported on 81.3% of returns)
11001:
$10,522
State:
$11,730
(% of AGI for various income ranges: 4.3% for AGIs below $10k, 4.8% for AGIs $10k-25k, 7.5% for AGIs $25k-50k, 9.1% for AGIs $50k-75k, 9.7% for AGIs $75k-100k, 17.4% for AGIs over 100k)
Earned income credit: $1,401 (reported on 6.6% of returns)
Here:
$1,401
State:
$1,757
Percentage of individuals using paid preparers for their 2004 taxes: 70.3%
Here:
70%
State:
67%
(% for various income ranges: 62.2% for AGIs below $10k, 68.6% for AGIs $10k-25k, 69.7% for AGIs $25k-50k, 73.0% for AGIs $50k-75k, 75.2% for AGIs $75k-100k, 74.7% for AGIs over 100k)
Household received Food Stamps/SNAP in the past 12 months: 460 Household did not receive Food Stamps/SNAP in the past 12 months: 8,137
Women who had a birth in the past 12 months: 176 (150 now married, 24 unmarried) Women who did not have a birth in the past 12 months: 5,035 (2,300 now married, 2,711 unmarried)
Housing units in zip code 11001 with a mortgage: 4,473 (549 second mortgage, 31 home equity loan, 499 both second mortgage and home equity loan) Houses without a mortgage: 281
Median monthly owner costs for units with a mortgage: $3,676 Median monthly owner costs for units without a mortgage: $1,407
Residents with income below the poverty level in 2022:
This zip code:
3.7%
Whole state:
14.3%
Residents with income below 50% of the poverty level in 2022:
This zip code:
1.9%
Whole state:
6.8%
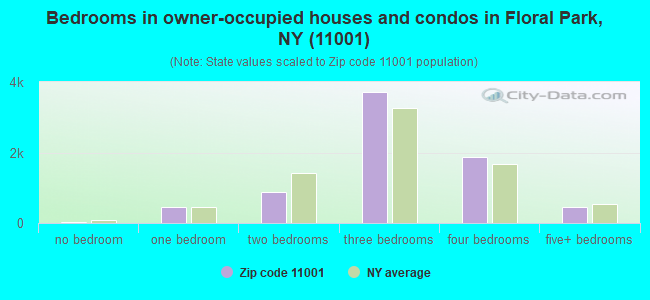
Median number of rooms in houses and condos:
Here:
6.6
State:
6.3
Median number of rooms in apartments:
Here:
4.5
State:
3.8
Notable locations in this zip code not listed on our city pages
Notable locations in zip code 11001: Bellerose Station (A), Floral Park Station (B), Floral Park Public Library (C), Floral Park Village Hall (D), Floral Park Fire Department Station 2 (E), Floral Park Fire Department Station 3 (F), Floral Park Fire Department Headquarters (G), Bellerose Village Hall (H). Display/hide their locations on the map
Churches in zip code 11001 include: Christ Lutheran Church (A), Saint Gregorio's Malankara Church (B), Saint Hedwig's Roman Catholic Church (C), New York Bible Assembly of God Church (D), Beginning Anew Christian Church (E), Floral Park United Methodist Church (F), Our Lady of Victory Church (G), Saint Elizabeth Church (H), Saint Thomas Episcopal Church (I). Display/hide their locations on the map
4,319 married couples with children.
493 single-parent households (136 men, 357 women).
64.3% of residents of 11001 zip code speak English at home.
11.1% of residents speak Spanish at home (69% very well, 17% well, 12% not well, 3% not at all).
15.9% of residents speak other Indo-European language at home (62% very well, 24% well, 11% not well, 3% not at all).
8.1% of residents speak Asian or Pacific Island language at home (58% very well, 23% well, 15% not well, 4% not at all).
0.4% of residents speak other language at home (81% very well, 8% well, 7% not well, 3% not at all).
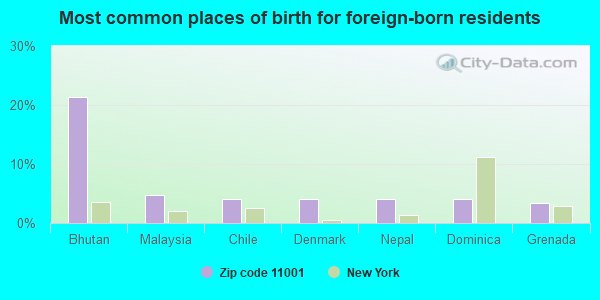
Foreign born population: 7,536 (29.3%) (77.4% of them are naturalized citizens)
This zip code:
29.3%
Whole state:
22.7%
21%Bhutan
5%Malaysia
4%Chile
4%Denmark
4%Nepal
4%Dominica
3%Grenada
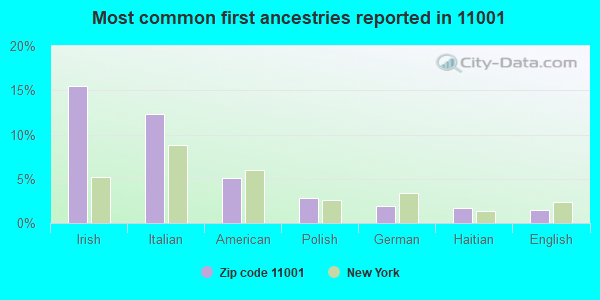
15%Irish
12%Italian
5%American
3%Polish
2%German
2%Haitian
1%English
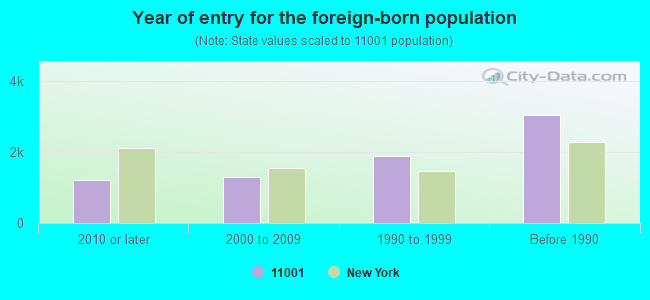
Year of entry for the foreign-born population
1,2272010 or later
1,2922000 to 2009
1,9001990 to 1999
3,052Before 1990
Facilities with environmental interests located in this zip code:
ANDALL S QUALITY DRY CLEANING (260 JERICHO TURNPIKE in FLORAL PARK, NY)
AIR MINOR (AIRS/AFS) STATE MASTER (New York facility tracking) - AIR PROGRAM, HAZARDOUS WASTE PROGRAM Conditionally Exempt Small Quantity Generators, less than 100 kg/month of hazardous waste (Resource Conservation and Recovery Act (tracking hazardous waste)) - notification Business SIC classification: DRYCLEANING PLANTS, EXCEPT RUG CLEANING Business NAICS classification: DRYCLEANING AND LAUNDRY SERVICES (EXCEPT COIN-OPERATED). Organizations: ANDREW ALLOCA (CONTACT/OWNER)
Alternative names: ANDALLS QUALITY DRY CLEANERS
COVERT CLEANERS INC (21 COVERT AVE in FLORAL PARK, NY)
AIR MINOR (AIRS/AFS) STATE MASTER (New York facility tracking) - AIR PROGRAM, HAZARDOUS WASTE PROGRAM Small Quantity Generators, between 100 kg and 1000 kg of hazardous waste/month (Resource Conservation and Recovery Act (tracking hazardous waste)) Business SIC classification: DRYCLEANING PLANTS, EXCEPT RUG CLEANING Business NAICS classification: DRYCLEANING AND LAUNDRY SERVICES (EXCEPT COIN-OPERATED). Organizations: CHUN & SUNG INC (LEGALLY RESPONSIBLE PARTY)
A & A FRENCH CLEANERS (255-07 HILLSIDE AVE in FLORAL PARK, NY)
AIR MINOR (AIRS/AFS) Conditionally Exempt Small Quantity Generators, less than 100 kg/month of hazardous waste (Resource Conservation and Recovery Act (tracking hazardous waste)) - notification Business SIC classification: DRYCLEANING PLANTS, EXCEPT RUG CLEANING Organizations: A & A FRENCH CLEANERS CO (CONTACT/OWNER)
GIFFORDS ENERGY CORP (58 S TYSON AVE in FLORAL PARK, NY)
(Resource Conservation and Recovery Act (tracking hazardous waste)) Organizations: WILLIAM GIFFORDS PROPERTIES (CONTACT/OWNER)
96 AUTO BODY CORP DBA C & N AUTO BODY (96 JERICHO TNPK in FLORAL PARK, NY)
(Resource Conservation and Recovery Act (tracking hazardous waste))
ADVANCED COLLISION INC (123 JERICHO TPKE in FLORAL PARK, NY)
(Resource Conservation and Recovery Act (tracking hazardous waste))
GETTY PETROLEUM CORP (2 JERICHO TNPK in FLORAL PARK, NY)
(Resource Conservation and Recovery Act (tracking hazardous waste))
CITRUS & ALLIED ESSENCES LTD (65 S TYSON AVE in FLORAL PARK, NY)
(Resource Conservation and Recovery Act (tracking hazardous waste)) Business NAICS classification: ALL OTHER MISCELLANEOUS CHEMICAL PRODUCT AND PREPARATION MANUFACTURING.
COACH AUTO COLLISION (40 CHERRY LANE in FLORAL PARK, NY)
Conditionally Exempt Small Quantity Generators, less than 100 kg/month of hazardous waste (Resource Conservation and Recovery Act (tracking hazardous waste)) - notification Organizations: RICH SCHLEGEL (CONTACT/OWNER)
AMERADA HESS STATION 32493 (250-26 JERICHO TNPK in FLORAL PARK, NY)
Conditionally Exempt Small Quantity Generators, less than 100 kg/month of hazardous waste (Resource Conservation and Recovery Act (tracking hazardous waste))
CROSS ISLAND COLLISION INC (226-12 JAMAICA AVE in FLORAL PARK, NY)
Small Quantity Generators, between 100 kg and 1000 kg of hazardous waste/month (Resource Conservation and Recovery Act (tracking hazardous waste))
Housing units lacking complete plumbing facilities: 0.2% Housing units lacking complete kitchen facilities: 0.5%
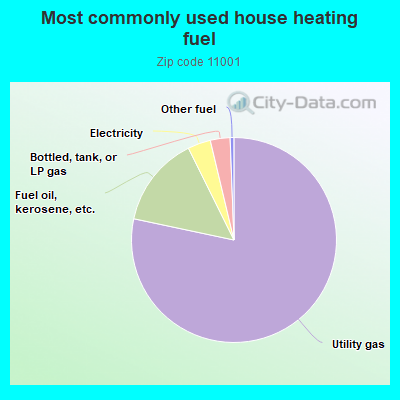
78.1%Utility gas
14.3%Fuel oil, kerosene, etc.
3.6%Electricity
3.1%Bottled, tank, or LP gas
0.6%Other fuel
Population in 1990: 26,498.
Place of birth for U.S.-born residents:
This state: 16,925
Northeast: 353
Midwest: 176
South: 393
West: 199
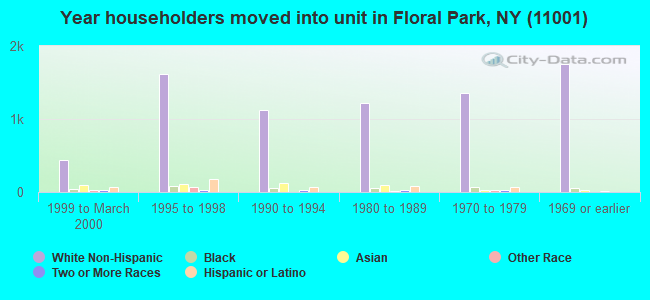
76% of the 11001 zip code residents lived in the same house 5 years ago. Out of people who lived in different houses, 54% lived in this county. Out of people who lived in different counties, 50% lived in New York.
93% of the 11001 zip code residents lived in the same house 1 year ago. Out of people who lived in different houses, 30% moved from this county. Out of people who lived in different houses, 62% moved from different county within same state. Out of people who lived in different houses, 5% moved from different state. Out of people who lived in different houses, 3% moved from abroad.
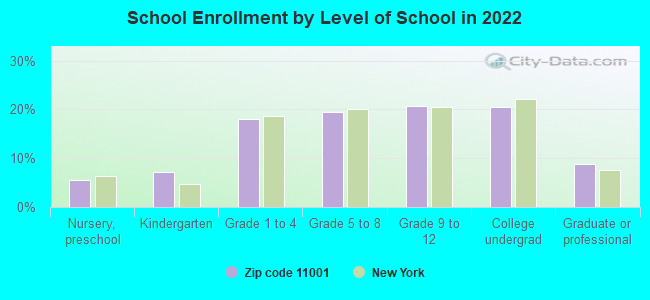
Private vs. public school enrollment:
Students in private schools in grades 1 to 8 (elementary and middle school): 302
Here:
12.1%
New York:
15.6%
Students in private schools in grades 9 to 12 (high school): 371
Here:
27.1%
New York:
15.0%
Students in private undergraduate colleges: 613
Here:
44.6%
New York:
39.2%
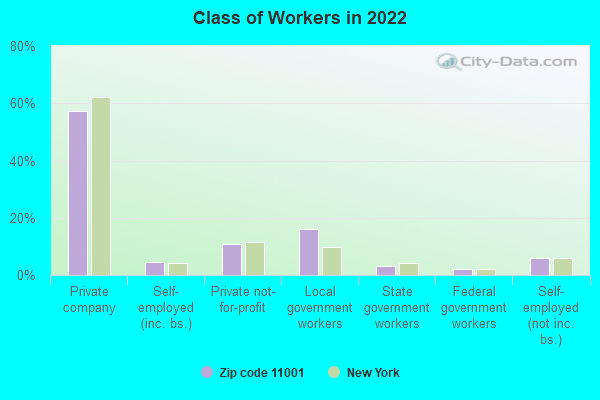
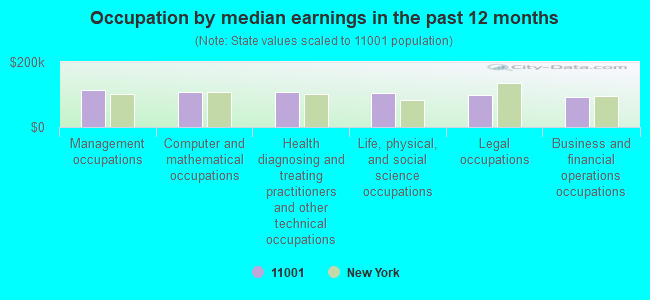
Occupation by median earnings in the past 12 months ($)
115,069Management occupations
109,852Computer and mathematical occupations
107,168Health diagnosing and treating practitioners and other technical occupations
106,065Life, physical, and social science occupations
97,507Legal occupations
92,671Business and financial operations occupations
Top industries in this zip code by the number of employees in 2005:
Administrative and Support and Waste Management and Remediation Services: Security Guards and Patrol Services (over 1000 employees: 1 establishment, 50-99 employees: 1 establishment)
2002 - 2018 National Fire Incident Reporting System (NFIRS) incidents
Based on the data from the years 2002 - 2018 the average number of fires per year is 46. The highest number of fires - 76 took place in 2003, and the least - 4 in 2011. The data has a dropping trend.
When looking into fire subcategories, the most incidents belonged to: Structure Fires (63.2%), and Outside Fires (21.4%).
Fire incident types reported to NFIRS in Zip Code 11001


 Nearest zip codes: 11426, 11004, 11003, 11040, 11005, 11042.


 Based on the data from the years 2002 - 2018 the average number of fires per year is 46. The highest number of fires - 76 took place in 2003, and the least - 4 in 2011. The data has a dropping trend.
 When looking into fire subcategories, the most incidents belonged to: Structure Fires (63.2%), and Outside Fires (21.4%).