Estimated zip code population in 2022: 41,471 Zip code population in 2010: 40,782 Zip code population in 2000: 39,157
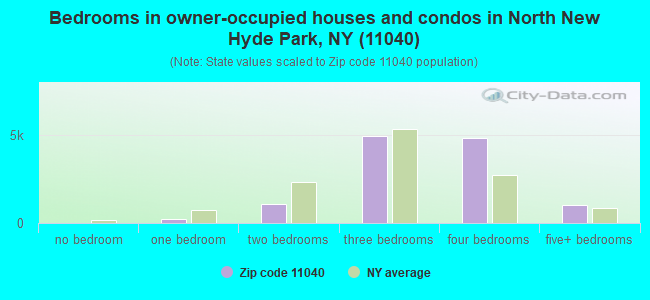
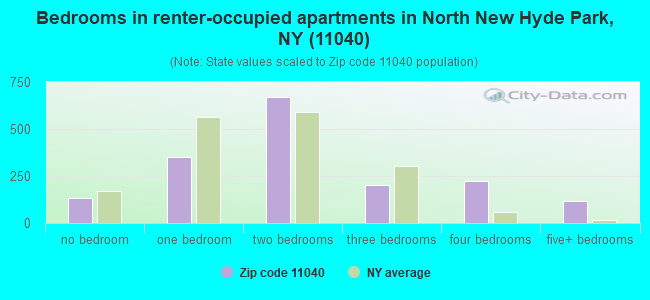
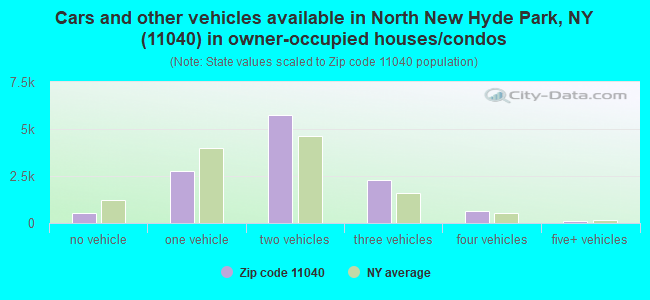
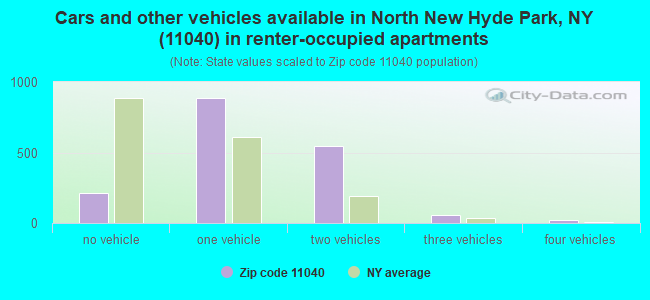
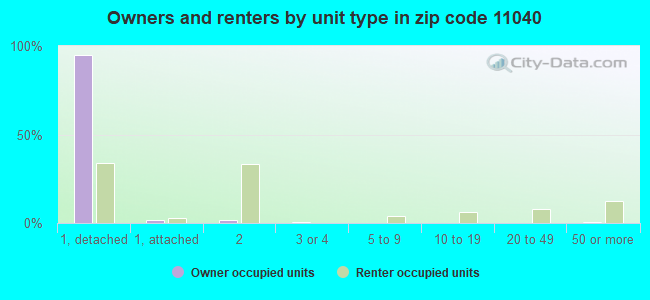
Houses and condos: 14,337 Renter-occupied apartments: 1,731
% of renters here:
12%
State:
46%
March 2022 cost of living index in zip code 11040: 152.5 (very high, U.S. average is 100)
Land area: 4.8 sq. mi. Water area: 0.0 sq. mi.
Population density: 8,671 people per square mile
(high).
OSM Map
General Map
Google Map
MSN Map
OSM Map
General Map
Google Map
MSN Map
OSM Map
General Map
Google Map
MSN Map
OSM Map
General Map
Google Map
MSN Map
Please wait while loading the map...
Real estate property taxes paid for housing units in 2022:
This zip code:
1.2% ($9,805)
New York:
1.5% ($6,180)
Median real estate property taxes paid for housing units with mortgages in 2022: $9,858 (1.2%) Median real estate property taxes paid for housing units with no mortgage in 2022: $9,755 (1.3%)
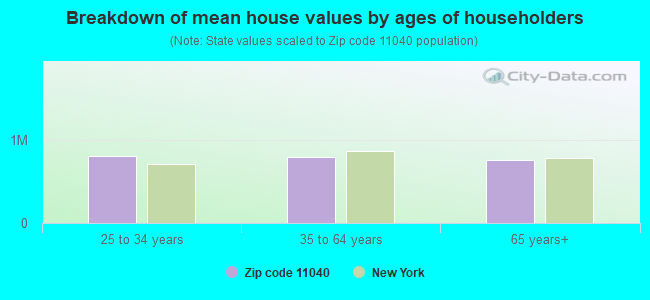
Estimated median house/condo value in 2022: $802,468
11040:
$802,468
New York:
$400,400
According to our research of New York and other state lists, there was 1 registered sex offender living in 11040 zip code as of April 27, 2024. The ratio of all residents to sex offenders in zip code 11040 is 41,974 to 1. The ratio of registered sex offenders to all residents in this zip code is much lower than the state average.
Median resident age:
This zip code:
44.3 years
New York median age:
40.0 years
Average household size:
This zip code:
3.0 people
New York:
2.5 people
Averages for the 2020 tax year for zip code 11040, filed in 2021:
Average Adjusted Gross Income (AGI) in 2020: $108,949 (Individual Income Tax Returns)
Here:
$108,949
State:
$90,930
Salary/wage: $94,342 (reported on 78.9% of returns)
Here:
$94,342
State:
$72,104
(% of AGI for various income ranges: 1112.1% for AGIs below $25k, 3622.5% for AGIs $25k-50k, 6733.1% for AGIs $50k-75k, 10652.7% for AGIs $75k-100k, 21166.5% for AGIs $100k-200k, 83637.3% for AGIs over 200k)
Taxable interest for individuals: $2,381 (reported on 54.9% of returns)
This zip code:
$2,381
New York:
$3,075
(% of AGI for various income ranges: 46.0% for AGIs below $25k, 67.9% for AGIs $25k-50k, 143.8% for AGIs $50k-75k, 184.1% for AGIs $75k-100k, 346.0% for AGIs $100k-200k, 1387.3% for AGIs over 200k)
Ordinary dividends: $6,637 (reported on 36.2% of returns)
Here:
$6,637
State:
$11,095
(% of AGI for various income ranges: 59.4% for AGIs below $25k, 105.6% for AGIs $25k-50k, 179.6% for AGIs $50k-75k, 315.3% for AGIs $75k-100k, 532.3% for AGIs $100k-200k, 3210.9% for AGIs over 200k)
Net capital gain/loss in AGI: +$17,989 (reported on 33.3% of returns)
Here:
+$17,989
State:
+$44,925
(% of AGI for various income ranges: 28.6% for AGIs below $25k, 83.1% for AGIs $25k-50k, 156.3% for AGIs $50k-75k, 316.4% for AGIs $75k-100k, 673.6% for AGIs $100k-200k, 12061.5% for AGIs over 200k)
Profit/loss from business: +$17,211 (reported on 16.5% of returns)
Here:
+$17,211
State:
+$14,940
(% of AGI for various income ranges: 220.5% for AGIs below $25k, 277.3% for AGIs $25k-50k, 190.8% for AGIs $50k-75k, 241.1% for AGIs $75k-100k, 469.2% for AGIs $100k-200k, 3522.5% for AGIs over 200k)
Taxable individual retirement arrangement distribution: $19,374 (reported on 10.4% of returns)
11040:
$19,374
New York:
$19,609
(% of AGI for various income ranges: 70.6% for AGIs below $25k, 131.5% for AGIs $25k-50k, 247.6% for AGIs $50k-75k, 358.8% for AGIs $75k-100k, 563.3% for AGIs $100k-200k, 1812.6% for AGIs over 200k)
Self-employed (Keogh) retirement plans: $30,876 (reported on 0.9% of returns)
11040:
$30,876
New York:
$32,497
(% of AGI for various income ranges: 20.9% for AGIs $50k-75k, 34.0% for AGIs $100k-200k, 586.6% for AGIs over 200k)
Total itemized deductions: $32,237 (reported on 19.9% of returns)
Here:
$32,237
State:
$39,326
(% of AGI for various income ranges: 139.2% for AGIs below $25k, 376.8% for AGIs $25k-50k, 575.6% for AGIs $50k-75k, 961.3% for AGIs $75k-100k, 1963.0% for AGIs $100k-200k, 6429.3% for AGIs over 200k)
Charity contributions: $7,343 (reported on 17.3% of returns)
Here:
$7,343
State:
$15,420
(% of AGI for various income ranges: 6.7% for AGIs below $25k, 28.8% for AGIs $25k-50k, 65.5% for AGIs $50k-75k, 104.5% for AGIs $75k-100k, 320.0% for AGIs $100k-200k, 1896.7% for AGIs over 200k)
Taxes paid: $9,583 (reported on 19.8% of returns)
11040:
$9,583
State:
$9,183
(% of AGI for various income ranges: 50.7% for AGIs below $25k, 125.1% for AGIs $25k-50k, 196.5% for AGIs $50k-75k, 338.9% for AGIs $75k-100k, 624.0% for AGIs $100k-200k, 1585.8% for AGIs over 200k)
Earned income credit: $1,705 (reported on 7.4% of returns)
Here:
$1,705
State:
$2,138
(% of AGI for various income ranges: 48.6% for AGIs below $25k, 55.4% for AGIs $25k-50k, 0.6% for AGIs $50k-75k)
Percentage of individuals using paid preparers for their 2020 taxes: 95.1%
Here:
95%
State:
95%
(% for various income ranges: 93.5% for AGIs below $25k, 95.2% for AGIs $25k-50k, 96.2% for AGIs $50k-75k, 95.1% for AGIs $75k-100k, 95.3% for AGIs $100k-200k, 96.3% for AGIs over 200k)
Averages for the 2012 tax year for zip code 11040, filed in 2013:
Average Adjusted Gross Income (AGI) in 2012: $90,225 (Individual Income Tax Returns)
Here:
$90,225
State:
$77,088
Salary/wage: $77,809 (reported on 80.4% of returns)
Here:
$77,809
State:
$60,593
(% of AGI for various income ranges: 66.5% for AGIs below $25k, 71.9% for AGIs $25k-50k, 72.1% for AGIs $50k-75k, 71.0% for AGIs $75k-100k, 79.1% for AGIs $100k-200k, 57.7% for AGIs over 200k)
Taxable interest for individuals: $2,048 (reported on 61.0% of returns)
This zip code:
$2,048
New York:
$3,125
(% of AGI for various income ranges: 3.3% for AGIs below $25k, 1.6% for AGIs $25k-50k, 1.4% for AGIs $50k-75k, 1.3% for AGIs $75k-100k, 1.0% for AGIs $100k-200k, 1.6% for AGIs over 200k)
Ordinary dividends: $4,711 (reported on 36.4% of returns)
Here:
$4,711
State:
$10,299
(% of AGI for various income ranges: 4.0% for AGIs below $25k, 2.4% for AGIs $25k-50k, 2.1% for AGIs $50k-75k, 2.1% for AGIs $75k-100k, 1.5% for AGIs $100k-200k, 1.9% for AGIs over 200k)
Net capital gain/loss in AGI: +$5,866 (reported on 28.6% of returns)
Here:
+$5,866
State:
+$42,474
(% of AGI for various income ranges: 0.5% for AGIs $75k-100k, 0.8% for AGIs $100k-200k, 4.5% for AGIs over 200k)
Profit/loss from business: +$19,596 (reported on 14.9% of returns)
Here:
+$19,596
State:
+$16,168
(% of AGI for various income ranges: 11.3% for AGIs below $25k, 5.6% for AGIs $25k-50k, 2.9% for AGIs $50k-75k, 2.0% for AGIs $75k-100k, 2.2% for AGIs $100k-200k, 3.5% for AGIs over 200k)
Taxable individual retirement arrangement distribution: $15,956 (reported on 13.2% of returns)
11040:
$15,956
New York:
$17,621
(% of AGI for various income ranges: 4.8% for AGIs below $25k, 3.3% for AGIs $25k-50k, 3.2% for AGIs $50k-75k, 3.1% for AGIs $75k-100k, 2.0% for AGIs $100k-200k, 1.8% for AGIs over 200k)
Self-employment retirement plans: $23,057 (reported on 1.1% of returns)
11040:
$23,057
New York:
$27,330
(% of AGI for various income ranges: 0.3% for AGIs $50k-75k, 0.2% for AGIs $100k-200k, 0.6% for AGIs over 200k)
Total itemized deductions: $31,789 (23% of AGI, reported on 56.9% of returns)
Here:
$31,789
State:
$34,985
Here:
23.3% of AGI
State:
21.3% of AGI
(% of AGI for various income ranges: 20.8% for AGIs below $25k, 20.1% for AGIs $25k-50k, 20.5% for AGIs $50k-75k, 22.0% for AGIs $75k-100k, 22.5% for AGIs $100k-200k, 16.6% for AGIs over 200k)
Charity contributions: $3,201 (reported on 51.4% of returns)
Here:
$3,201
State:
$5,572
(% of AGI for various income ranges: 1.1% for AGIs below $25k, 1.7% for AGIs $25k-50k, 1.9% for AGIs $50k-75k, 2.2% for AGIs $75k-100k, 2.2% for AGIs $100k-200k, 1.4% for AGIs over 200k)
Taxes paid: $17,002 (reported on 56.8% of returns)
11040:
$17,002
State:
$18,656
(% of AGI for various income ranges: 9.2% for AGIs below $25k, 9.2% for AGIs $25k-50k, 9.7% for AGIs $50k-75k, 10.9% for AGIs $75k-100k, 11.6% for AGIs $100k-200k, 10.5% for AGIs over 200k)
Earned income credit: $1,926 (reported on 7.3% of returns)
Here:
$1,926
State:
$2,230
(% of AGI for various income ranges: 3.4% for AGIs below $25k, 0.6% for AGIs $25k-50k)
Percentage of individuals using paid preparers for their 2012 taxes: 73.6%
Here:
74%
State:
66%
(% for various income ranges: 69.6% for AGIs below $25k, 71.4% for AGIs $25k-50k, 74.0% for AGIs $50k-75k, 73.8% for AGIs $75k-100k, 78.0% for AGIs $100k-200k, 79.0% for AGIs over 200k)
Averages for the 2004 tax year for zip code 11040, filed in 2005:
Average Adjusted Gross Income (AGI) in 2004: $70,207 (Individual Income Tax Returns)
Here:
$70,207
State:
$59,519
Salary/wage: $63,241 (reported on 78.5% of returns)
Here:
$63,241
State:
$50,673
(% of AGI for various income ranges: 149.9% for AGIs below $10k, 59.5% for AGIs $10k-25k, 73.2% for AGIs $25k-50k, 73.0% for AGIs $50k-75k, 75.8% for AGIs $75k-100k, 68.4% for AGIs over 100k)
Taxable interest for individuals: $2,566 (reported on 73.9% of returns)
This zip code:
$2,566
New York:
$2,377
(% of AGI for various income ranges: 19.2% for AGIs below $10k, 6.3% for AGIs $10k-25k, 3.2% for AGIs $25k-50k, 2.5% for AGIs $50k-75k, 2.5% for AGIs $75k-100k, 2.3% for AGIs over 100k)
Taxable dividends: $3,342 (reported on 43.7% of returns)
Here:
$3,342
State:
$5,394
(% of AGI for various income ranges: 16.5% for AGIs below $10k, 3.9% for AGIs $10k-25k, 2.2% for AGIs $25k-50k, 2.1% for AGIs $50k-75k, 1.9% for AGIs $75k-100k, 1.8% for AGIs over 100k)
Net capital gain/loss: +$8,459 (reported on 35.4% of returns)
Here:
+$8,459
State:
+$23,581
(% of AGI for various income ranges: -9.6% for AGIs below $10k, -0.3% for AGIs $10k-25k, -0.0% for AGIs $25k-50k, 0.4% for AGIs $50k-75k, 0.6% for AGIs $75k-100k, 7.2% for AGIs over 100k)
Profit/loss from business: +$18,627 (reported on 13.9% of returns)
Here:
+$18,627
State:
+$13,809
(% of AGI for various income ranges: 18.2% for AGIs below $10k, 7.6% for AGIs $10k-25k, 4.0% for AGIs $25k-50k, 2.7% for AGIs $50k-75k, 2.9% for AGIs $75k-100k, 3.6% for AGIs over 100k)
IRA payment deduction: $3,631 (reported on 5.0% of returns)
11040:
$3,631
New York:
$3,115
(% of AGI for various income ranges: 0.7% for AGIs below $10k, 0.5% for AGIs $10k-25k, 0.6% for AGIs $25k-50k, 0.4% for AGIs $50k-75k, 0.3% for AGIs $75k-100k, 0.1% for AGIs over 100k)
Self-employed pension: $15,186 (reported on 1.6% of returns)
Here:
$15,186
New York:
$19,016
(% of AGI for various income ranges: 0.1% for AGIs $10k-25k, 0.1% for AGIs $25k-50k, 0.2% for AGIs $50k-75k, 0.2% for AGIs $75k-100k, 0.5% for AGIs over 100k)
Total itemized deductions: $24,953 (24% of AGI, reported on 57.7% of returns)
Here:
$24,953
State:
$25,864
Here:
23.8% of AGI
State:
21.9% of AGI
(% of AGI for various income ranges: 37.9% for AGIs below $10k, 23.2% for AGIs $10k-25k, 21.2% for AGIs $25k-50k, 23.3% for AGIs $50k-75k, 23.9% for AGIs $75k-100k, 18.6% for AGIs over 100k)
Charity contributions deductions: $3,296 (3% of AGI, reported on 54.6% of returns)
Here:
$3,296
State:
$4,439
Here:
3.1% of AGI
State:
3.6% of AGI
(% of AGI for various income ranges: 1.9% for AGIs below $10k, 2.1% for AGIs $10k-25k, 2.3% for AGIs $25k-50k, 2.8% for AGIs $50k-75k, 2.7% for AGIs $75k-100k, 2.6% for AGIs over 100k)
Total tax: $11,897 (reported on 81.3% of returns)
11040:
$11,897
State:
$11,730
(% of AGI for various income ranges: 5.2% for AGIs below $10k, 4.2% for AGIs $10k-25k, 7.4% for AGIs $25k-50k, 9.1% for AGIs $50k-75k, 9.6% for AGIs $75k-100k, 17.7% for AGIs over 100k)
Earned income credit: $1,434 (reported on 5.2% of returns)
Here:
$1,434
State:
$1,757
Percentage of individuals using paid preparers for their 2004 taxes: 71.6%
Here:
72%
State:
67%
(% for various income ranges: 64.3% for AGIs below $10k, 68.7% for AGIs $10k-25k, 71.5% for AGIs $25k-50k, 74.8% for AGIs $50k-75k, 74.6% for AGIs $75k-100k, 76.2% for AGIs over 100k)
Likely homosexual households (counted as self-reported same-sex unmarried-partner households)
Lesbian couples: 0.1% of all households
Gay men: 0.1% of all households
Household received Food Stamps/SNAP in the past 12 months: 494 Household did not receive Food Stamps/SNAP in the past 12 months: 13,272
Women who had a birth in the past 12 months: 493 (459 now married, 28 unmarried) Women who did not have a birth in the past 12 months: 8,156 (3,667 now married, 4,454 unmarried)
Housing units in zip code 11040 with a mortgage: 7,205 (901 second mortgage, 10 home equity loan, 868 both second mortgage and home equity loan) Houses without a mortgage: 423
Median monthly owner costs for units with a mortgage: $3,629 Median monthly owner costs for units without a mortgage: $1,487
Residents with income below the poverty level in 2022:
This zip code:
3.6%
Whole state:
14.3%
Residents with income below 50% of the poverty level in 2022:
This zip code:
1.9%
Whole state:
6.8%
Median number of rooms in houses and condos:
Here:
6.7
State:
6.3
Median number of rooms in apartments:
Here:
4.8
State:
3.8
Notable locations in this zip code not listed on our city pages
Notable locations in zip code 11040: Merillon Avenue Station (A), New Hyde Park Station (B), New Hyde Park Public Library (C), Goudreau Museum of Mathematics (D), New Hyde Park Village Hall (E), Great Neck Library Parkville Branch (F), Hillside Public Library (G), New Hyde Park Village Hall (H), Garden City Park Fire Department (I). Display/hide their locations on the map
Churches in zip code 11040 include: Notre Dame Roman Catholic Church (A), Trinity Lutheran Church (B), Christ Lutheran Church (C), Long Island Korean Catholic Church (D), Hillside United Methodist Church (E), First Presbyterian Church of New Hyde Park (F), Gloria Dei Lutheran Church (G), Holy Spirit Roman Catholic Church (H), New Hyde Park Baptist Church (I). Display/hide their locations on the map
In group quarters: 77 (-1 institutionalized population)
Size of family households: 3,751 2-persons, 2,741 3-persons, 2,661 4-persons, 1,448 5-persons, 535 6-persons, 174 7-or-more-persons
Size of nonfamily households: 2,140 1-person, 298 2-persons
6,565 married couples with children.
645 single-parent households (202 men, 443 women).
54.9% of residents of 11040 zip code speak English at home.
7.6% of residents speak Spanish at home (70% very well, 15% well, 15% not well).
16.3% of residents speak other Indo-European language at home (74% very well, 17% well, 7% not well, 2% not at all).
20.9% of residents speak Asian or Pacific Island language at home (54% very well, 32% well, 12% not well, 2% not at all).
0.7% of residents speak other language at home (83% very well, 11% well, 6% not well).
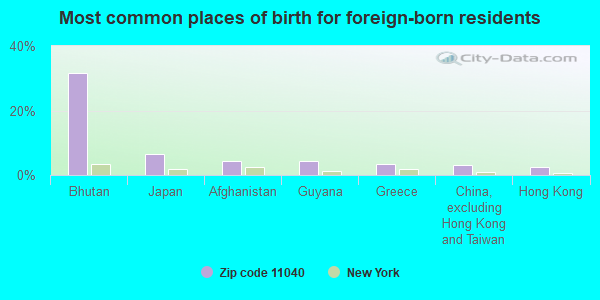
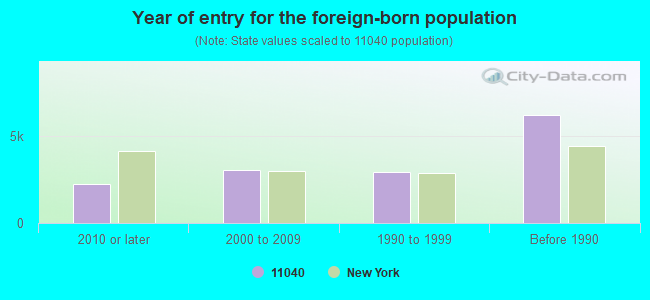
Foreign born population: 14,406 (34.7%) (81.3% of them are naturalized citizens)
Major facilities with environmental interests located in this zip code:
ALUSUISSE FLEXIBLE PACKAGING INCORPORATED (1403 4TH AVENUE in NEW HYDE PARK, NY)
AIR MAJOR (AIRS/AFS) (Integrated Compliance Information System) - ICIS-02-1988-0669, FORMAL ENFORCEMENT ACTION COMPLIANCE ACTIVITY (Tracking inspections of insecticide, fungicide, and rodenticide, and toxic substances) CRITERIA AND HAZARDOUS AIR POLLUTANT INVENTORY (Inventory of air pollution sources) HAZARDOUS WASTE BIENNIAL REPORTER (Resource Conservation and Recovery Act (tracking hazardous waste)) Large Quantity Generators, more that 1000 kg of hazardous waste/month (Resource Conservation and Recovery Act (tracking hazardous waste)) - notification TRI REPORTER (Tracking of toxic chemicals releasing facilities) Business SIC classification: COMMERCIAL PRINTING; UNSUPPORTED PLASTICS FILM AND SHEET Business NAICS classification: OTHER COMMERCIAL PRINTING. Organizations: OLP-NEW HYDE PARK (CONTACT/OPERATOR)
, ALCAN PACKAGING (CONTACT/OWNER)
Alternative names: ALCAN - LAWSON MARDON USA INC., ALCAN - LAWSON MARDON USA INC., ALCAN PACKAGING, CELLU CRAFT INC(ALUSUISSE FLEX PKG), CELLU-CRAFT PRODUCTS CO, LAWSON MARDEN LABEL, LAWSON MARDON PACKAGING USA INC
CONTINENTAL CLEANERS (1632 MARCUS AVENUE in NEW HYDE PARK, NY)
AIR MINOR (AIRS/AFS) STATE MASTER (New York facility tracking) - AIR PROGRAM Small Quantity Generators, between 100 kg and 1000 kg of hazardous waste/month (Resource Conservation and Recovery Act (tracking hazardous waste)) Conditionally Exempt Small Quantity Generators, less than 100 kg/month of hazardous waste (Resource Conservation and Recovery Act (tracking hazardous waste)) Business SIC classification: DRYCLEANING PLANTS, EXCEPT RUG CLEANING Business NAICS classification: DRYCLEANING AND LAUNDRY SERVICES (EXCEPT COIN-OPERATED). Organizations: V & P CORPORATION, NEW HYDE PARK ASSOCIATES LLC (CONTACT/OWNER)
, COLTENCO CLEANING INC (LEGALLY RESPONSIBLE PARTY)
Alternative names: ASTRID CLEANERS, COLTENCO CLEANING INC DBA ASTRID CLEANER, S & B CLEANING CORP
GOLDEN PLAZA CLEANERS (2333 JERICHO TNPK in GARDEN CITY PARK, NY)
AIR MINOR (AIRS/AFS) STATE MASTER (New York facility tracking) - AIR PROGRAM Small Quantity Generators, between 100 kg and 1000 kg of hazardous waste/month (Resource Conservation and Recovery Act (tracking hazardous waste)) Business SIC classification: DRYCLEANING PLANTS, EXCEPT RUG CLEANING Business NAICS classification: DRYCLEANING AND LAUNDRY SERVICES (EXCEPT COIN-OPERATED). Organizations: YOUNG M YOO (CONTACT/OPERATOR)
, PARK EAST LLC (CONTACT/OWNER)
, GOLDEN PLAZA CLEANERS INC (LEGALLY RESPONSIBLE PARTY)
CONTINENTAL CLEANERS (3367 HILLSIDE AVENUE in NEW HYDE PARK, NY)
AIR MINOR (AIRS/AFS) STATE MASTER (New York facility tracking) - AIR PROGRAM Small Quantity Generators, between 100 kg and 1000 kg of hazardous waste/month (Resource Conservation and Recovery Act (tracking hazardous waste)) - notification Business SIC classification: DRYCLEANING PLANTS, EXCEPT RUG CLEANING Business NAICS classification: DRYCLEANING AND LAUNDRY SERVICES (EXCEPT COIN-OPERATED). Organizations: V & P CORP (CONTACT/OWNER)
HILLSIDE GS ( in NEW HYDE PARK, NY)
(National Center for Education Statistics) - STATE ID-280405020003 Organizations: NEW HYDE PARK-GARDEN CITY PARK UFSD (SCHOOL DISTRICT)
HERRICKS HS ( in NEW HYDE PARK, NY)
(National Center for Education Statistics) - STATE ID-280409030008 Organizations: HERRICKS UFSD (SCHOOL DISTRICT)
HERRICKS UFSD COMMUNITY CENTER (999 HERICKS ROAD in HERRICKS (NEW HYDE PARK), NY)
(Integrated Compliance Information System) - ICIS-02-2003-1002, FORMAL ENFORCEMENT ACTION Business SIC classification: VOCATIONAL SCHOOLS
HOLIDAY FRENCH CLEANERS (2213 HILLSIDE AVE in NEW HYDE PARK, NY)
(Resource Conservation and Recovery Act (tracking hazardous waste)) Alternative names: B & F CLEANERS DBA HOLIDAY CLEANERS, ECONO LAUNDROMAT HOLIDS
CUMBERLAND FARMS (2499 JERICHO TNPK & HERRICK in GARDEN CITY PARK, NY)
Large Quantity Generators, more that 1000 kg of hazardous waste/month (Resource Conservation and Recovery Act (tracking hazardous waste)) Organizations: CUMBERLAND FARMS INC (CONTACT/OWNER)
HERRICKS UFSD ADMINISTRATION BLDG (99 SHELTER ROCK RD in NEW HYDE PARK, NY)
COMPLIANCE ACTIVITY (Tracking inspections of insecticide, fungicide, and rodenticide, and toxic substances) (Resource Conservation and Recovery Act (tracking hazardous waste)) Alternative names: HERRICKS UF SCHOOL DISTRICT
ALL-DENT LABORATORIES INC (1603 JERICHO TNPK in NEW HYDE PARK, NY)
(Resource Conservation and Recovery Act (tracking hazardous waste)) Business NAICS classification: DENTAL LABORATORIES. Organizations: OWNERNAME (CONTACT/OWNER)
ALPHA COLLISION INC (105 HERRICKS RD in GARDEN CITY PARK, NY)
(Resource Conservation and Recovery Act (tracking hazardous waste))
AMERICAN IMPROVED PRODUCTS INC. (2350 JERICHP TPKE in NEW HYDE PARK, NY)
(Resource Conservation and Recovery Act (tracking hazardous waste)) Business NAICS classification: PEN AND MECHANICAL PENCIL MANUFACTURING.
Housing units lacking complete plumbing facilities: 0.2% Housing units lacking complete kitchen facilities: 0.8%
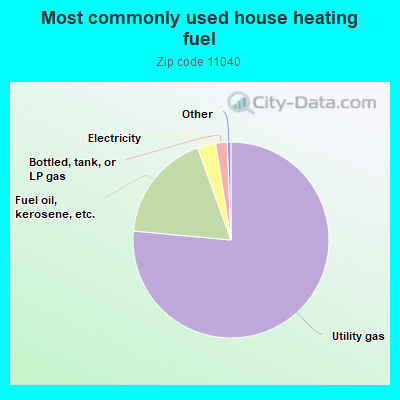
76.4%Utility gas
18.0%Fuel oil, kerosene, etc.
3.0%Electricity
1.9%Bottled, tank, or LP gas
Population in 1990: 37,695. Population change in the 1990s: +1,462 (+3.9%).
Place of birth for U.S.-born residents:
This state: 25,359
Northeast: 697
Midwest: 190
South: 261
West: 201
79% of the 11040 zip code residents lived in the same house 5 years ago. Out of people who lived in different houses, 39% lived in this county. Out of people who lived in different counties, 50% lived in New York.
95% of the 11040 zip code residents lived in the same house 1 year ago. Out of people who lived in different houses, 43% moved from this county. Out of people who lived in different houses, 48% moved from different county within same state. Out of people who lived in different houses, 5% moved from different state. Out of people who lived in different houses, 3% moved from abroad.
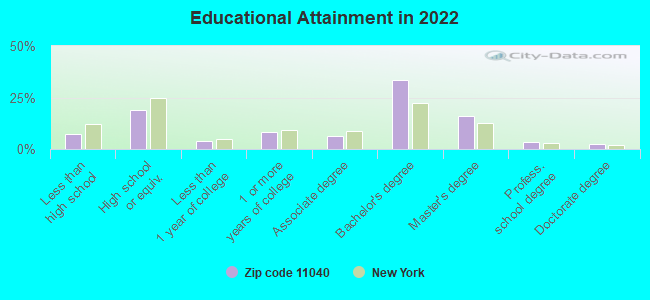
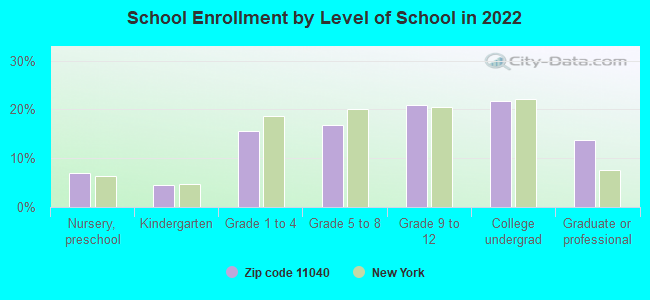
Private vs. public school enrollment:
Students in private schools in grades 1 to 8 (elementary and middle school): 401
Here:
11.6%
New York:
15.6%
Students in private schools in grades 9 to 12 (high school): 250
Here:
11.3%
New York:
15.0%
Students in private undergraduate colleges: 1,420
Here:
60.1%
New York:
39.2%
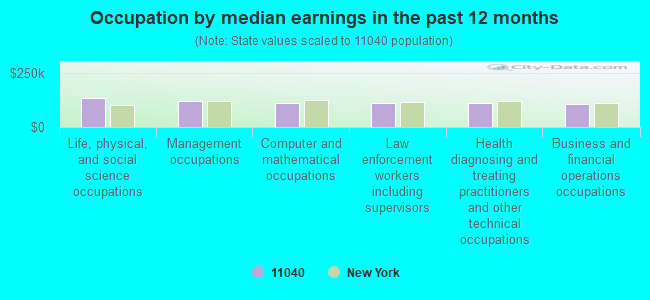
Occupation by median earnings in the past 12 months ($)
135,209Life, physical, and social science occupations
118,334Management occupations
111,808Computer and mathematical occupations
110,073Law enforcement workers including supervisors
109,295Health diagnosing and treating practitioners and other technical occupations
106,428Business and financial operations occupations
Companies with biggest federal contracts located in this zip code:
NAYYARSONS FOOD CORP (3366 HILLSIDE AVENUE in NEW HYDE PARK, NY; small business) : $16,644,897 in 103 contractsfrom 2001 to 2006
Contracts for Food Services, Operation of Government-Owned Facilities -- Dining Facilities by U.S. Coast Guard, Army, Immigration and Naturalization Service Signed by year:2000: $0; 2001: $769,500; 2002: $1,129,600; 2003: $2,310,291; 2004: $7,467,789; 2005: $5,164,342; 2006: -$196,625.
Biggest contracts:
$5,041,667 with U.S. Coast Guard for Food Services. Taking place in NJ. Signed on 2004-11-16. Effective on 2004-10-01. Completion date: 2005-09-30.
$4,166,667, same as above.Signed on 2005-12-09. Effective on 2005-10-01. Completion date: 2006-09-30.
$2,250,000, same as above.Signed on 2004-05-10. Effective on 2004-06-01. Completion date: 2004-09-30.
$1,081,855 with Army for Food Services. Taking place in VA. Signed on 2003-12-18. Completion date: 2001-09-01.
WEBA INC (1301 4TH AVE in NEW HYDE PARK, NY; small business) : $1,062,694 in 13 contractsfrom 2000 to 2003
Contracts for Miscellaneous Engine Accessories, Aircraft, Airframe Structural Components, Hose, Pipe, Tube, Lubrication, and Railing Fittings by Defense Logistics Agency, Air Force Signed by year:2000: $233,026; 2001: $299,171; 2002: $349,829; 2003: $180,668; 2004: $0; 2005: $0; 2006: $0.
Biggest contracts:
$144,584 with Defense Logistics Agency for Miscellaneous Engine Accessories, Aircraft. Signed on 2002-02-04. Completion date: 2002-10-01.
$144,584, same as above.Signed on 2001-07-18. Completion date: 2002-03-15.
$137,025 with Defense Logistics Agency for Airframe Structural Components. Signed on 2002-02-26. Completion date: 2002-10-14.
$112,454 with Defense Logistics Agency for Miscellaneous Engine Accessories, Aircraft. Signed on 2000-08-08. Completion date: 2001-02-24.
STAR BLUE WEBBING CORP (77 2ND AVE in NEW HYDE PARK, NY; small business) : $140,354 in 6 contractsfrom 2000 to 2006
Contracts for Hosiery, Handwear, and Clothing Accessories, Men's, Yarn and Thread, Notions and Apparel Findings by Department of Veterans Affairs, Army Signed by year:2000: $66,000; 2001: $0; 2002: $0; 2003: $14,960; 2004: $17,994; 2005: $12,600; 2006: $28,800.
Biggest contracts:
$66,000 with Department of Veterans Affairs for Hosiery, Handwear, and Clothing Accessories, Men's. Signed on 2000-06-15. Completion date: 2000-08-15.
$28,800 with Army for Yarn and Thread. Signed on 2006-02-16. Completion date: 2006-04-28.
$14,960, same as above.Signed on 2004-04-14. Completion date: 2004-01-30.
$14,960, same as above.Signed on 2003-11-25. Completion date: 2004-01-30.
CONCEPT FLOORING WORKROOM INC (50 NASSAU TERMINAL RD in NEW HYDE PARK, NY; small business) : $127,525 in 6 contractsfrom 2002 to 2003
Contracts for Maintenance, Repair or Alteration of Real Property -- Office Buildings, Maintenance, Repair or Alteration of Real Property -- Hospitals and Infirmaries by Army Signed by year:2000: $0; 2001: $0; 2002: $118,185; 2003: $9,340; 2004: $0; 2005: $0; 2006: $0.
Biggest contracts:
$88,000 with Army for Maintenance, Repair or Alteration of Real Property -- Office Buildings. Taking place in NJ. Signed on 2002-09-28. Completion date: 2006-09-18.
$30,465, same as above.Signed on 2003-06-04. Completion date: 2003-07-01.
$26,525, same as above.Signed on 2002-09-26. Completion date: 2006-09-18.
$9,340, same as above.Signed on 2003-09-21. Completion date: 2003-10-30.
HAMBURGER WOOLEN CO INC (23 DENTON AVE in NEW HYDE PARK, NY; small business) : $121,209 in 5 contractsfrom 2000 to 2006
Contracts for Textile Fabrics, Office Furniture, Passenger Motor Vehicles by Navy, Army Signed by year:2000: $29,775; 2001: $79,400; 2002: $0; 2003: $0; 2004: $1,934; 2005: $0; 2006: $10,100.
Biggest contracts:
$79,400 with Navy for Textile Fabrics. Signed on 2001-03-09. Completion date: 2001-06-07.
$29,775 with Navy for Office Furniture. Signed on 2000-04-13. Completion date: 2000-08-18.
$10,100 with Army for Textile Fabrics. Signed on 2006-02-09. Completion date: 2006-05-10.
$1,934 with Army for Passenger Motor Vehicles. Signed on 2004-03-31. Completion date: 2004-09-22.
ERGONOMIC GROUP INC (191 HERRICKS RD in GARDEN CITY PA, NY; small business)
$23,663 with Department of Defense for Hardware, Commercial. Taking place in VA. Signed on 2005-07-26. Completion date: 2005-08-25.
CONSOLIDATED PARTS & COMPUTERS (55 PARK AVE, 1ST FLR in NEW HYDE PARK, NY; small business)
$21,500 with Army for Radar Equipment, Except Airborne. Signed on 2004-03-16. Completion date: 2004-03-26.
UNITED STATES BRONZE SIGN CO (811 2ND AVE in NEW HYDE PARK, NY; small business)
$9,972 with Navy for Miscellaneous Printed Matter. Signed on 2005-09-02. Completion date: 2005-10-21.
DESIGNATRONICS INC (2101 JERICHO TPKE in NEW HYDE PARK, NY; small business) : $6,039 in 2 contractsin 2005
$5,980 with Defense Logistics Agency for Gears, Pulleys, Sprockets, and Transmission Chain. Signed on 2005-06-08. Completion date: 2005-09-18.
$59 with Navy for Gears, Pulleys, Sprockets, and Transmission Chain. Signed on 2005-08-26. Completion date: 2005-09-16.
TAM BUSINESS SYSTEMS INC (150 FULTON AVE in NEW HYDE PARK, NY; small business)
$5,050 with Navy for Other Defense -- Applied Research and Exploratory Development (R&D). Taking place in DC. Signed on 2005-02-09. Completion date: 2006-02-13.
Top industries in this zip code by the number of employees in 2005:
Health Care and Social Assistance: General Medical and Surgical Hospitals (over 1000 employees: 2 establishments)
Health Care and Social Assistance: Nursing Care Facilities (over 1000: 1)
2002 - 2018 National Fire Incident Reporting System (NFIRS) incidents
Based on the data from the years 2002 - 2018 the average number of fires per year is 70. The highest number of fires - 108 took place in 2005, and the least - 36 in 2018. The data has a dropping trend.
When looking into fire subcategories, the most incidents belonged to: Structure Fires (46.9%), and Outside Fires (33.9%).
Fire incident types reported to NFIRS in Zip Code 11040


 Nearest zip codes: 11042, 11004, 11001, 11005, 11507, 11596.


 Based on the data from the years 2002 - 2018 the average number of fires per year is 70. The highest number of fires - 108 took place in 2005, and the least - 36 in 2018. The data has a dropping trend.
 When looking into fire subcategories, the most incidents belonged to: Structure Fires (46.9%), and Outside Fires (33.9%).