Estimated zip code population in 2022: 2,140 Zip code population in 2010: 1,806 Zip code population in 2000: 2,195
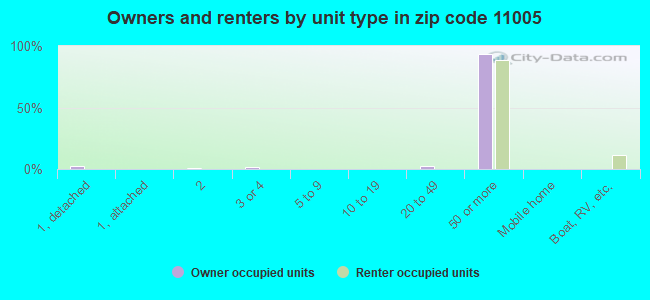
Houses and condos: 2,074 Renter-occupied apartments: 96
% of renters here:
6%
State:
46%
March 2022 cost of living index in zip code 11005: 150.9 (very high, U.S. average is 100)
Land area: 0.2 sq. mi. Water area: 0.0 sq. mi.
Population density: 11,661 people per square mile
(high).
OSM Map
General Map
Google Map
MSN Map
OSM Map
General Map
Google Map
MSN Map
OSM Map
General Map
Google Map
MSN Map
OSM Map
General Map
Google Map
MSN Map
Please wait while loading the map...
Real estate property taxes paid for housing units in 2022:
This zip code:
1.4% ($8,969)
New York:
1.5% ($6,180)
Median real estate property taxes paid for housing units with mortgages in 2022: $7,068 (1.3%) Median real estate property taxes paid for housing units with no mortgage in 2022: $9,099 (1.4%)
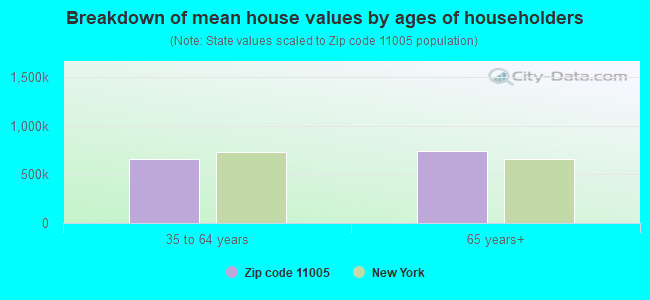
Estimated median house/condo value in 2022: $629,528
11005:
$629,528
New York:
$400,400
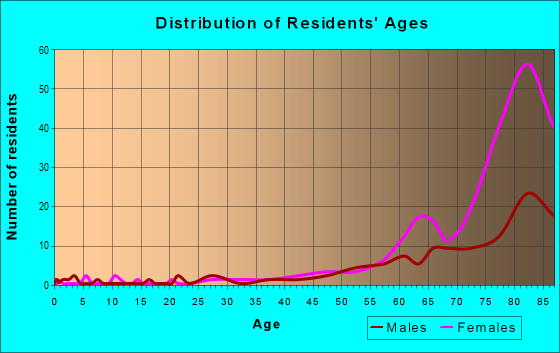
Median resident age:
This zip code:
84.4 years
New York median age:
40.0 years
Average household size:
This zip code:
1.3 people
New York:
2.5 people
Averages for the 2020 tax year for zip code 11005, filed in 2021:
Average Adjusted Gross Income (AGI) in 2020: $136,954 (Individual Income Tax Returns)
Here:
$136,954
State:
$90,930
Salary/wage: $80,611 (reported on 24.5% of returns)
Here:
$80,611
State:
$72,104
(% of AGI for various income ranges: 334.0% for AGIs below $25k, 984.3% for AGIs $25k-50k, 2408.3% for AGIs $50k-75k, 4024.3% for AGIs $75k-100k, 8429.1% for AGIs $100k-200k, 46080.0% for AGIs over 200k)
Taxable interest for individuals: $7,743 (reported on 86.0% of returns)
This zip code:
$7,743
New York:
$3,075
(% of AGI for various income ranges: 722.0% for AGIs below $25k, 700.0% for AGIs $25k-50k, 1296.7% for AGIs $50k-75k, 1158.6% for AGIs $75k-100k, 2458.2% for AGIs $100k-200k, 14600.0% for AGIs over 200k)
Ordinary dividends: $22,894 (reported on 80.4% of returns)
Here:
$22,894
State:
$11,095
(% of AGI for various income ranges: 1308.0% for AGIs below $25k, 1801.4% for AGIs $25k-50k, 3265.0% for AGIs $50k-75k, 3295.7% for AGIs $75k-100k, 6700.0% for AGIs $100k-200k, 42590.0% for AGIs over 200k)
Net capital gain/loss in AGI: +$28,110 (reported on 76.2% of returns)
Here:
+$28,110
State:
+$44,925
(% of AGI for various income ranges: 610.0% for AGIs $25k-50k, 815.0% for AGIs $50k-75k, 1230.0% for AGIs $75k-100k, 3328.2% for AGIs $100k-200k, 84156.7% for AGIs over 200k)
Profit/loss from business: +$21,736 (reported on 9.8% of returns)
Here:
+$21,736
State:
+$14,940
(% of AGI for various income ranges: 560.0% for AGIs $25k-50k, 171.4% for AGIs $75k-100k, 965.5% for AGIs $100k-200k, 4896.7% for AGIs over 200k)
Taxable individual retirement arrangement distribution: $33,347 (reported on 40.6% of returns)
11005:
$33,347
New York:
$19,609
(% of AGI for various income ranges: 974.0% for AGIs below $25k, 1140.0% for AGIs $25k-50k, 1753.3% for AGIs $50k-75k, 2791.4% for AGIs $75k-100k, 7001.8% for AGIs $100k-200k, 24493.3% for AGIs over 200k)
Total itemized deductions: $30,711 (reported on 45.5% of returns)
Here:
$30,711
State:
$39,326
(% of AGI for various income ranges: 2526.0% for AGIs below $25k, 2955.7% for AGIs $25k-50k, 5355.0% for AGIs $50k-75k, 4280.0% for AGIs $75k-100k, 5776.4% for AGIs $100k-200k, 13556.7% for AGIs over 200k)
Charity contributions: $5,083 (reported on 42.0% of returns)
Here:
$5,083
State:
$15,420
(% of AGI for various income ranges: 124.0% for AGIs below $25k, 234.3% for AGIs $25k-50k, 373.3% for AGIs $50k-75k, 381.4% for AGIs $75k-100k, 814.5% for AGIs $100k-200k, 4790.0% for AGIs over 200k)
Taxes paid: $9,323 (reported on 45.5% of returns)
11005:
$9,323
State:
$9,183
(% of AGI for various income ranges: 948.0% for AGIs below $25k, 1088.6% for AGIs $25k-50k, 1578.3% for AGIs $50k-75k, 1441.4% for AGIs $75k-100k, 1798.2% for AGIs $100k-200k, 2966.7% for AGIs over 200k)
Percentage of individuals using paid preparers for their 2020 taxes: 96.5%
Here:
97%
State:
95%
(% for various income ranges: 95.0% for AGIs below $25k, 94.4% for AGIs $25k-50k, 94.4% for AGIs $50k-75k, 100.0% for AGIs $75k-100k, 95.5% for AGIs $100k-200k, 100.0% for AGIs over 200k)
Averages for the 2012 tax year for zip code 11005, filed in 2013:
Average Adjusted Gross Income (AGI) in 2012: $113,697 (Individual Income Tax Returns)
Here:
$113,697
State:
$77,088
Salary/wage: $69,208 (reported on 25.5% of returns)
Here:
$69,208
State:
$60,593
(% of AGI for various income ranges: 12.7% for AGIs below $25k, 11.9% for AGIs $25k-50k, 15.2% for AGIs $50k-75k, 15.2% for AGIs $75k-100k, 13.3% for AGIs $100k-200k, 18.0% for AGIs over 200k)
Taxable interest for individuals: $7,399 (reported on 87.9% of returns)
This zip code:
$7,399
New York:
$3,125
(% of AGI for various income ranges: 15.9% for AGIs below $25k, 9.5% for AGIs $25k-50k, 8.6% for AGIs $50k-75k, 5.9% for AGIs $75k-100k, 4.4% for AGIs $100k-200k, 5.2% for AGIs over 200k)
Ordinary dividends: $16,283 (reported on 79.4% of returns)
Here:
$16,283
State:
$10,299
(% of AGI for various income ranges: 27.9% for AGIs below $25k, 17.6% for AGIs $25k-50k, 15.0% for AGIs $50k-75k, 9.9% for AGIs $75k-100k, 11.4% for AGIs $100k-200k, 9.6% for AGIs over 200k)
Net capital gain/loss in AGI: +$13,986 (reported on 77.3% of returns)
Here:
+$13,986
State:
+$42,474
(% of AGI for various income ranges: 0.5% for AGIs $50k-75k, 0.8% for AGIs $75k-100k, 4.1% for AGIs $100k-200k, 19.7% for AGIs over 200k)
Profit/loss from business: +$22,450 (reported on 11.3% of returns)
Here:
+$22,450
State:
+$16,168
(% of AGI for various income ranges: 10.2% for AGIs below $25k, 2.9% for AGIs $50k-75k, 0.7% for AGIs $75k-100k, 1.0% for AGIs $100k-200k, 3.3% for AGIs over 200k)
Taxable individual retirement arrangement distribution: $30,252 (reported on 64.5% of returns)
11005:
$30,252
New York:
$17,621
(% of AGI for various income ranges: 19.8% for AGIs below $25k, 17.2% for AGIs $25k-50k, 15.6% for AGIs $50k-75k, 19.3% for AGIs $75k-100k, 20.0% for AGIs $100k-200k, 14.7% for AGIs over 200k)
Self-employment retirement plans: $12,867 (reported on 2.1% of returns)
11005:
$12,867
New York:
$27,330
Total itemized deductions: $33,128 (26% of AGI, reported on 85.1% of returns)
Here:
$33,128
State:
$34,985
Here:
26.2% of AGI
State:
21.3% of AGI
(% of AGI for various income ranges: 91.9% for AGIs below $25k, 49.7% for AGIs $25k-50k, 35.2% for AGIs $50k-75k, 29.7% for AGIs $75k-100k, 23.5% for AGIs $100k-200k, 16.7% for AGIs over 200k)
Charity contributions: $2,938 (reported on 79.4% of returns)
Here:
$2,938
State:
$5,572
(% of AGI for various income ranges: 3.4% for AGIs below $25k, 2.8% for AGIs $25k-50k, 2.3% for AGIs $50k-75k, 2.1% for AGIs $75k-100k, 2.3% for AGIs $100k-200k, 1.7% for AGIs over 200k)
Taxes paid: $17,992 (reported on 85.1% of returns)
11005:
$17,992
State:
$18,656
(% of AGI for various income ranges: 38.7% for AGIs below $25k, 24.1% for AGIs $25k-50k, 15.6% for AGIs $50k-75k, 15.1% for AGIs $75k-100k, 12.5% for AGIs $100k-200k, 11.1% for AGIs over 200k)
Percentage of individuals using paid preparers for their 2012 taxes: 87.2%
Here:
87%
State:
66%
(% for various income ranges: 83.3% for AGIs below $25k, 89.5% for AGIs $25k-50k, 87.0% for AGIs $50k-75k, 85.0% for AGIs $75k-100k, 89.2% for AGIs $100k-200k, 88.9% for AGIs over 200k)
Averages for the 2004 tax year for zip code 11005, filed in 2005:
Average Adjusted Gross Income (AGI) in 2004: $138,428 (Individual Income Tax Returns)
Here:
$138,428
State:
$59,519
Salary/wage: $65,896 (reported on 28.2% of returns)
Here:
$65,896
State:
$50,673
(% of AGI for various income ranges: 11.1% for AGIs $10k-25k, 15.6% for AGIs $25k-50k, 17.5% for AGIs $50k-75k, 15.0% for AGIs $75k-100k, 12.7% for AGIs over 100k)
Taxable interest for individuals: $11,825 (reported on 95.3% of returns)
This zip code:
$11,825
New York:
$2,377
(% of AGI for various income ranges: 23.5% for AGIs $10k-25k, 17.2% for AGIs $25k-50k, 11.2% for AGIs $50k-75k, 8.8% for AGIs $75k-100k, 6.8% for AGIs over 100k)
Taxable dividends: $13,715 (reported on 83.9% of returns)
Here:
$13,715
State:
$5,394
(% of AGI for various income ranges: 22.1% for AGIs $10k-25k, 17.1% for AGIs $25k-50k, 11.1% for AGIs $50k-75k, 10.0% for AGIs $75k-100k, 6.9% for AGIs over 100k)
Net capital gain/loss: +$27,663 (reported on 80.0% of returns)
Here:
+$27,663
State:
+$23,581
(% of AGI for various income ranges: -3.3% for AGIs $10k-25k, -1.0% for AGIs $25k-50k, 2.2% for AGIs $50k-75k, 4.4% for AGIs $75k-100k, 19.9% for AGIs over 100k)
Profit/loss from business: +$27,703 (reported on 12.5% of returns)
Here:
+$27,703
State:
+$13,809
(% of AGI for various income ranges: 4.8% for AGIs $10k-25k, 3.5% for AGIs $25k-50k, 0.9% for AGIs $50k-75k, 1.6% for AGIs $75k-100k, 2.6% for AGIs over 100k)
IRA payment deduction: $3,562 (reported on 2.3% of returns)
11005:
$3,562
New York:
$3,115
Self-employed pension: $16,440 (reported on 1.8% of returns)
Here:
$16,440
New York:
$19,016
Total itemized deductions: $32,676 (21% of AGI, reported on 84.8% of returns)
Here:
$32,676
State:
$25,864
Here:
21.0% of AGI
State:
21.9% of AGI
(% of AGI for various income ranges: 69.1% for AGIs $10k-25k, 47.4% for AGIs $25k-50k, 30.6% for AGIs $50k-75k, 28.1% for AGIs $75k-100k, 15.0% for AGIs over 100k)
Charity contributions deductions: $3,898 (3% of AGI, reported on 80.9% of returns)
Here:
$3,898
State:
$4,439
Here:
2.8% of AGI
State:
3.6% of AGI
(% of AGI for various income ranges: 4.6% for AGIs $10k-25k, 4.1% for AGIs $25k-50k, 3.5% for AGIs $50k-75k, 2.9% for AGIs $75k-100k, 1.9% for AGIs over 100k)
Total tax: $27,355 (reported on 84.9% of returns)
11005:
$27,355
State:
$11,730
(% of AGI for various income ranges: 2.7% for AGIs $10k-25k, 5.6% for AGIs $25k-50k, 9.8% for AGIs $50k-75k, 11.4% for AGIs $75k-100k, 18.9% for AGIs over 100k)
Percentage of individuals using paid preparers for their 2004 taxes: 88.7%
Here:
89%
State:
67%
(% for various income ranges: 82.0% for AGIs below $10k, 86.5% for AGIs $10k-25k, 88.2% for AGIs $25k-50k, 90.1% for AGIs $50k-75k, 90.6% for AGIs $75k-100k, 90.3% for AGIs over 100k)
Household received Food Stamps/SNAP in the past 12 months: 20 Household did not receive Food Stamps/SNAP in the past 12 months: 1,541
Women who did not have a birth in the past 12 months: 10 (0 now married, 10 unmarried)
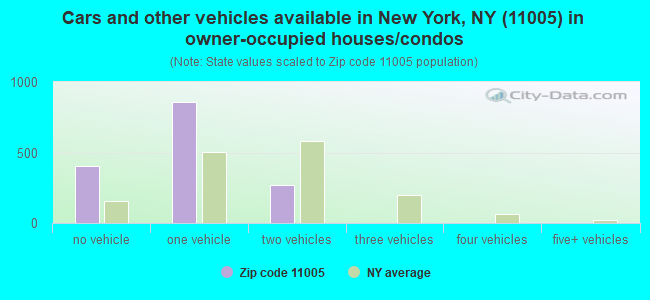
Housing units in zip code 11005 with a mortgage: 140 (10 second mortgage, 10 both second mortgage and home equity loan) Median monthly owner costs for units with a mortgage: $2,732 Median monthly owner costs for units without a mortgage: $918
Residents with income below the poverty level in 2022:
This zip code:
6.7%
Whole state:
14.3%
Residents with income below 50% of the poverty level in 2022:
This zip code:
3.1%
Whole state:
6.8%
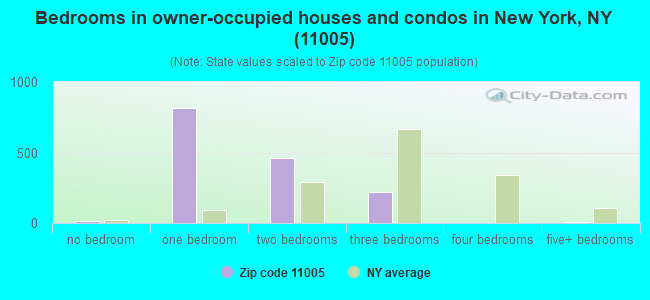
Median number of rooms in houses and condos:
Here:
3.7
State:
6.3
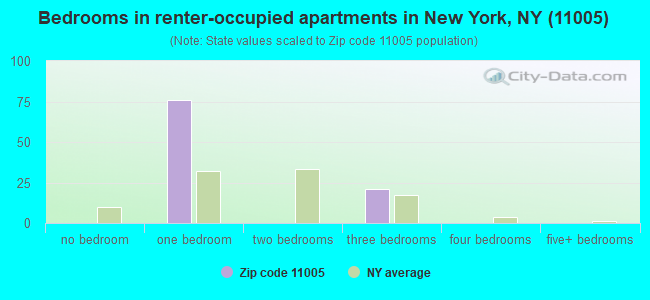
Median number of rooms in apartments:
Here:
3.2
State:
3.8
Notable locations in this zip code not listed on our city pages
Size of nonfamily households: 1,037 1-person, 24 2-persons
92.3% of residents of 11005 zip code speak English at home.
1.1% of residents speak Spanish at home (100% very well).
8.3% of residents speak other Indo-European language at home (89% very well, 11% well).
2.3% of residents speak Asian or Pacific Island language at home (73% very well, 27% well).
0.9% of residents speak other language at home (100% very well).
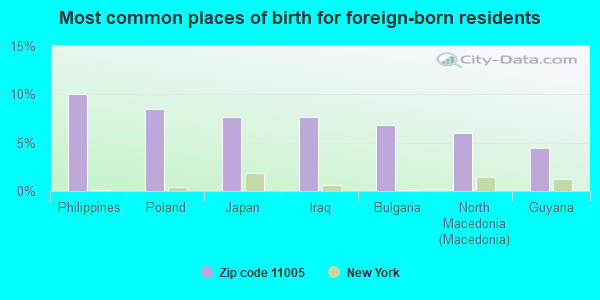
Foreign born population: 254 (11.9%) (99.6% of them are naturalized citizens)
This zip code:
11.9%
Whole state:
22.7%
10%Philippines
8%Poland
8%Japan
8%Iraq
7%Bulgaria
6%North Macedonia (Macedonia)
4%Guyana
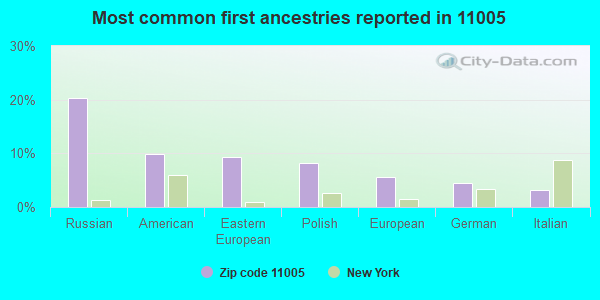
20%Russian
10%American
9%Eastern European
8%Polish
6%European
4%German
3%Italian
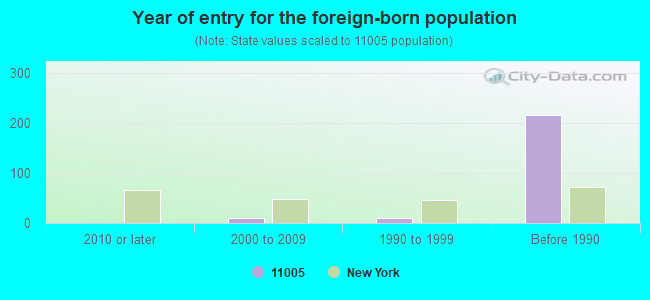
Year of entry for the foreign-born population
02010 or later
102000 to 2009
101990 to 1999
216Before 1990
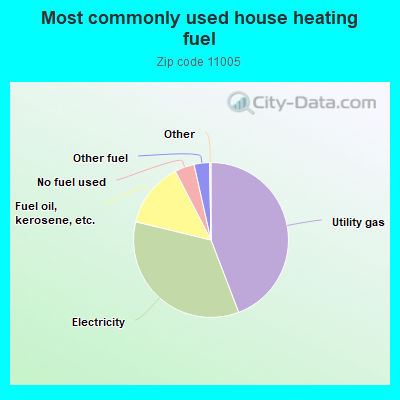
44.2%Utility gas
34.6%Electricity
13.6%Fuel oil, kerosene, etc.
4.1%No fuel used
3.2%Other fuel
Place of birth for U.S.-born residents:
This state: 1,696
Northeast: 156
Midwest: 20
South: 10
64% of the 11005 zip code residents lived in the same house 5 years ago. Out of people who lived in different houses, 17% lived in this county. Out of people who lived in different counties, 50% lived in New York.
94% of the 11005 zip code residents lived in the same house 1 year ago. Out of people who lived in different houses, 25% moved from this county. Out of people who lived in different houses, 74% moved from different county within same state.
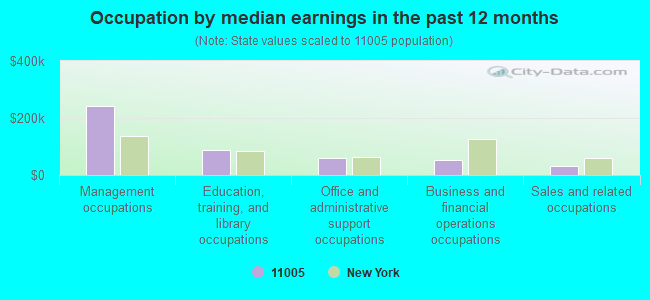
Occupation by median earnings in the past 12 months ($)
243,431Management occupations
88,161Education, training, and library occupations
58,151Office and administrative support occupations
52,378Business and financial operations occupations
31,964Sales and related occupations
Companies with federal contracts located in this zip code:
BRETCO INDUSTRIES, INC (269-10 GRAND CENTRAL PKWY in FLORAL PARK, NY; small business) : $5,697 in 2 contractsin 2002
$6,040 with Army for Safety and Rescue Equipment. Signed on 2002-05-01. Completion date: 2002-05-01.
-$343, same as above.Signed on 2002-09-12. Completion date: 2002-05-01.
Top industries in this zip code by the number of employees in 2005:
Real Estate and Rental and Leasing: Offices of Real Estate Agents and Brokers (100-249 employees: 1 establishment, 1-4 employees: 2 establishments)
Real Estate and Rental and Leasing: Lessors of Residential Buildings and Dwellings (100-249: 1, 1-4: 1)
Arts, Entertainment, and Recreation: Golf Courses and Country Clubs (20-49: 1)
Other Services (except Public Administration): Car Washes (10-19: 1, 1-4: 1)
Other Services (except Public Administration): Beauty Salons (10-19: 1)
Construction: Drywall and Insulation Contractors (10-19: 1)
Finance and Insurance: Commercial Banking (5-9: 1)
Accommodation and Food Services: Full-Service Restaurants (5-9: 1)
Real Estate and Rental and Leasing: Lessors of Nonresidential Buildings (except Miniwarehouses) (1-4: 2)
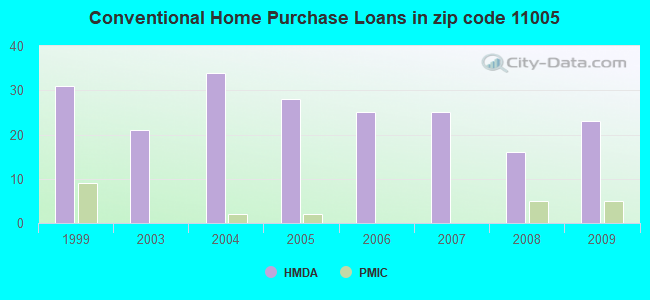
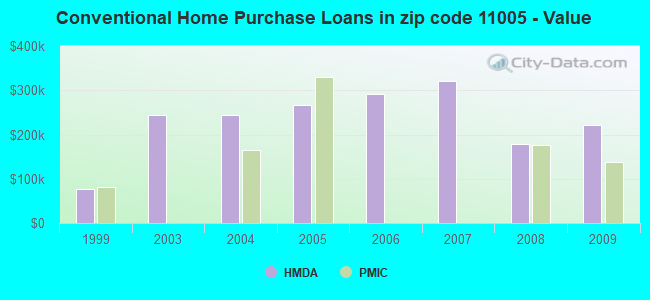
Home Mortgage Disclosure Act Aggregated Statistics For Year 2009 (Based on 2 partial tracts)
B) Conventional Home Purchase Loans
C) Refinancings
D) Home Improvement Loans
F) Non-occupant Loans on < 5 Family Dwellings (A B C & D)
Number
Average Value
Number
Average Value
Number
Average Value
Number
Average Value
LOANS ORIGINATED
23
$222,143
34
$203,791
2
$81,670
8
$286,254
APPLICATIONS APPROVED, NOT ACCEPTED
2
$245,010
0
$0
2
$13,885
0
$0
APPLICATIONS DENIED
7
$194,841
15
$243,159
0
$0
0
$0
APPLICATIONS WITHDRAWN
2
$163,340
3
$170,417
0
$0
0
$0
FILES CLOSED FOR INCOMPLETENESS
0
$0
3
$212,343
0
$0
0
$0
Aggregated Statistics For Year 2008 (Based on 2 partial tracts)
B) Conventional Home Purchase Loans
C) Refinancings
D) Home Improvement Loans
F) Non-occupant Loans on < 5 Family Dwellings (A B C & D)
Number
Average Value
Number
Average Value
Number
Average Value
Number
Average Value
LOANS ORIGINATED
16
$178,041
11
$362,169
3
$265,157
2
$816,700
APPLICATIONS APPROVED, NOT ACCEPTED
2
$122,505
0
$0
3
$281,490
2
$340,565
APPLICATIONS DENIED
2
$130,670
5
$204,176
0
$0
0
$0
APPLICATIONS WITHDRAWN
2
$191,925
0
$0
0
$0
2
$191,925
FILES CLOSED FOR INCOMPLETENESS
0
$0
0
$0
0
$0
0
$0
Aggregated Statistics For Year 2007 (Based on 2 partial tracts)
B) Conventional Home Purchase Loans
C) Refinancings
F) Non-occupant Loans on < 5 Family Dwellings (A B C & D)
Number
Average Value
Number
Average Value
Number
Average Value
LOANS ORIGINATED
25
$319,885
21
$350,481
2
$539,020
APPLICATIONS APPROVED, NOT ACCEPTED
5
$329,294
0
$0
0
$0
APPLICATIONS DENIED
11
$457,352
10
$276,698
0
$0
APPLICATIONS WITHDRAWN
2
$182,125
3
$190,563
0
$0
FILES CLOSED FOR INCOMPLETENESS
0
$0
0
$0
0
$0
Aggregated Statistics For Year 2006 (Based on 2 partial tracts)
B) Conventional Home Purchase Loans
C) Refinancings
D) Home Improvement Loans
F) Non-occupant Loans on < 5 Family Dwellings (A B C & D)
Number
Average Value
Number
Average Value
Number
Average Value
Number
Average Value
LOANS ORIGINATED
25
$290,614
13
$152,535
2
$163,340
10
$252,360
APPLICATIONS APPROVED, NOT ACCEPTED
3
$426,317
3
$282,033
2
$285,845
2
$470,420
APPLICATIONS DENIED
3
$412,160
7
$149,106
0
$0
3
$81,127
APPLICATIONS WITHDRAWN
2
$503,085
5
$347,260
0
$0
0
$0
FILES CLOSED FOR INCOMPLETENESS
2
$232,760
0
$0
0
$0
0
$0
Aggregated Statistics For Year 2005 (Based on 2 partial tracts)
B) Conventional Home Purchase Loans
C) Refinancings
D) Home Improvement Loans
F) Non-occupant Loans on < 5 Family Dwellings (A B C & D)
Number
Average Value
Number
Average Value
Number
Average Value
Number
Average Value
LOANS ORIGINATED
28
$265,544
18
$192,015
2
$138,840
2
$67,785
APPLICATIONS APPROVED, NOT ACCEPTED
8
$210,505
2
$285,845
2
$8,165
0
$0
APPLICATIONS DENIED
2
$81,670
0
$0
0
$0
0
$0
APPLICATIONS WITHDRAWN
2
$196,010
2
$227,045
2
$128,220
0
$0
FILES CLOSED FOR INCOMPLETENESS
3
$555,357
2
$99,635
0
$0
0
$0
Aggregated Statistics For Year 2004 (Based on 2 partial tracts)
B) Conventional Home Purchase Loans
C) Refinancings
D) Home Improvement Loans
F) Non-occupant Loans on < 5 Family Dwellings (A B C & D)
Number
Average Value
Number
Average Value
Number
Average Value
Number
Average Value
LOANS ORIGINATED
34
$244,674
20
$151,988
0
$0
0
$0
APPLICATIONS APPROVED, NOT ACCEPTED
3
$150,273
2
$89,835
0
$0
2
$112,705
APPLICATIONS DENIED
5
$248,276
7
$151,206
2
$4,900
0
$0
APPLICATIONS WITHDRAWN
10
$401,653
3
$435,573
0
$0
2
$490,020
FILES CLOSED FOR INCOMPLETENESS
2
$130,670
2
$194,375
0
$0
0
$0
Aggregated Statistics For Year 2003 (Based on 2 partial tracts)
A) FHA, FSA/RHS & VA Home Purchase Loans
B) Conventional Home Purchase Loans
C) Refinancings
D) Home Improvement Loans
F) Non-occupant Loans on < 5 Family Dwellings (A B C & D)
Number
Average Value
Number
Average Value
Number
Average Value
Number
Average Value
Number
Average Value
LOANS ORIGINATED
0
$0
21
$245,088
75
$167,892
0
$0
3
$152,450
APPLICATIONS APPROVED, NOT ACCEPTED
0
$0
2
$163,340
7
$223,776
0
$0
0
$0
APPLICATIONS DENIED
0
$0
3
$380,583
11
$200,165
2
$32,670
2
$271,145
APPLICATIONS WITHDRAWN
0
$0
3
$438,840
8
$162,115
0
$0
0
$0
FILES CLOSED FOR INCOMPLETENESS
2
$196,010
2
$436,120
3
$161,163
0
$0
0
$0
Aggregated Statistics For Year 1999 (Based on 1 partial tract)
B) Conventional Home Purchase Loans
C) Refinancings
D) Home Improvement Loans
F) Non-occupant Loans on < 5 Family Dwellings (A B C & D)


 Nearest zip codes: 11004, 11020, 11042, 11426, 11362, 11021.


 : $5,697 in 2 contracts in 2002