Estimated zip code population in 2022: 19,419 Zip code population in 2010: 17,590 Zip code population in 2000: 18,727
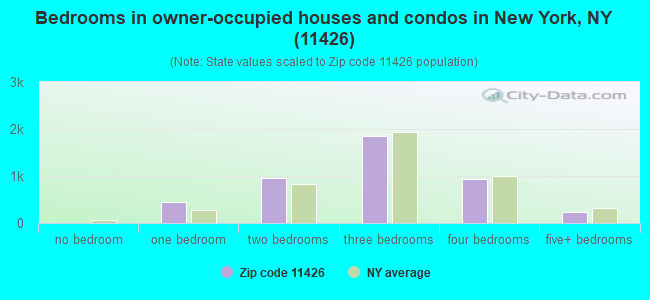
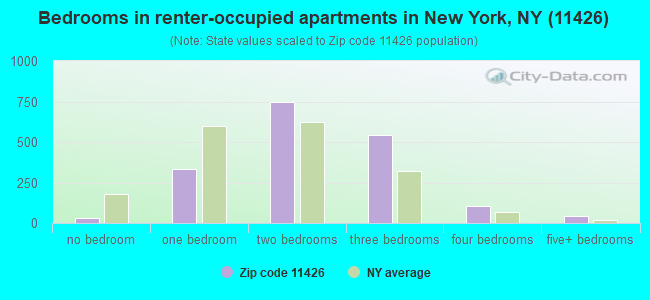
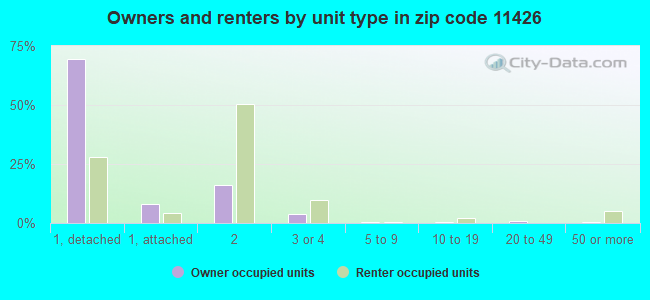
Houses and condos: 6,596 Renter-occupied apartments: 1,829
% of renters here:
29%
State:
46%
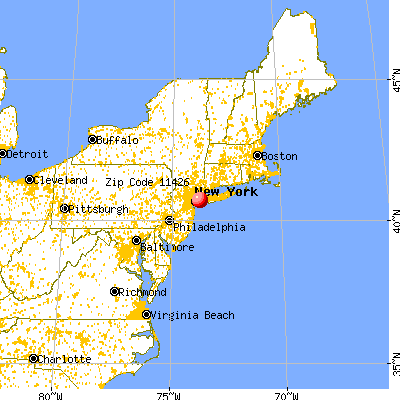
March 2022 cost of living index in zip code 11426: 148.0 (very high, U.S. average is 100)
Land area: 1.4 sq. mi. Water area: 0.0 sq. mi.
Population density: 14,352 people per square mile
(very high).
OSM Map
General Map
Google Map
MSN Map
OSM Map
General Map
Google Map
MSN Map
OSM Map
General Map
Google Map
MSN Map
OSM Map
General Map
Google Map
MSN Map
Please wait while loading the map...
Real estate property taxes paid for housing units in 2022:
This zip code:
0.9% ($6,202)
New York:
1.5% ($6,180)
Median real estate property taxes paid for housing units with mortgages in 2022: $6,280 (0.9%) Median real estate property taxes paid for housing units with no mortgage in 2022: $6,105 (0.9%)
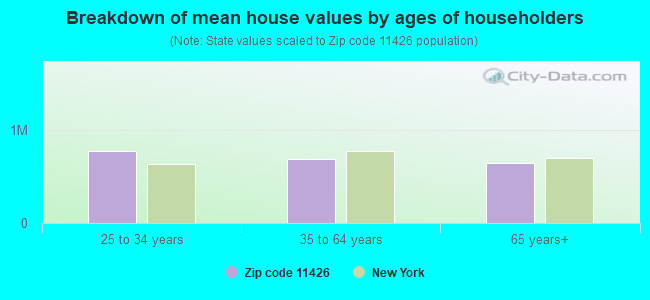
Estimated median house/condo value in 2022: $681,024
11426:
$681,024
New York:
$400,400
According to our research of New York and other state lists, there were 3 registered sex offenders living in 11426 zip code as of April 27, 2024. The ratio of all residents to sex offenders in zip code 11426 is 6,759 to 1. The ratio of registered sex offenders to all residents in this zip code is much lower than the state average.
Median resident age:
This zip code:
46.4 years
New York median age:
40.0 years
Average household size:
This zip code:
3.1 people
New York:
2.5 people
Averages for the 2020 tax year for zip code 11426, filed in 2021:
Average Adjusted Gross Income (AGI) in 2020: $65,812 (Individual Income Tax Returns)
Here:
$65,812
State:
$90,930
Salary/wage: $63,404 (reported on 75.8% of returns)
Here:
$63,404
State:
$72,104
(% of AGI for various income ranges: 932.9% for AGIs below $25k, 3414.5% for AGIs $25k-50k, 6821.0% for AGIs $50k-75k, 10244.2% for AGIs $75k-100k, 18699.4% for AGIs $100k-200k, 69035.0% for AGIs over 200k)
Taxable interest for individuals: $1,102 (reported on 36.8% of returns)
This zip code:
$1,102
New York:
$3,075
(% of AGI for various income ranges: 22.5% for AGIs below $25k, 36.6% for AGIs $25k-50k, 46.5% for AGIs $50k-75k, 74.4% for AGIs $75k-100k, 157.4% for AGIs $100k-200k, 418.3% for AGIs over 200k)
Ordinary dividends: $2,635 (reported on 20.1% of returns)
Here:
$2,635
State:
$11,095
(% of AGI for various income ranges: 16.2% for AGIs below $25k, 37.6% for AGIs $25k-50k, 49.4% for AGIs $50k-75k, 109.7% for AGIs $75k-100k, 198.2% for AGIs $100k-200k, 972.5% for AGIs over 200k)
Net capital gain/loss in AGI: +$7,804 (reported on 18.3% of returns)
Here:
+$7,804
State:
+$44,925
(% of AGI for various income ranges: 1.0% for AGIs below $25k, 34.1% for AGIs $25k-50k, 100.5% for AGIs $50k-75k, 134.4% for AGIs $75k-100k, 362.4% for AGIs $100k-200k, 6678.3% for AGIs over 200k)
Profit/loss from business: +$10,375 (reported on 23.1% of returns)
Here:
+$10,375
State:
+$14,940
(% of AGI for various income ranges: 426.5% for AGIs below $25k, 400.1% for AGIs $25k-50k, 214.9% for AGIs $50k-75k, 291.7% for AGIs $75k-100k, 288.9% for AGIs $100k-200k, 2370.8% for AGIs over 200k)
Taxable individual retirement arrangement distribution: $16,657 (reported on 6.4% of returns)
11426:
$16,657
New York:
$19,609
(% of AGI for various income ranges: 49.1% for AGIs below $25k, 70.0% for AGIs $25k-50k, 110.7% for AGIs $50k-75k, 236.4% for AGIs $75k-100k, 318.4% for AGIs $100k-200k, 2247.5% for AGIs over 200k)
Self-employed (Keogh) retirement plans: $21,250 (reported on 0.2% of returns)
11426:
$21,250
New York:
$32,497
(% of AGI for various income ranges: 28.7% for AGIs $25k-50k)
Total itemized deductions: $26,998 (reported on 13.2% of returns)
Here:
$26,998
State:
$39,326
(% of AGI for various income ranges: 81.3% for AGIs below $25k, 193.7% for AGIs $25k-50k, 443.7% for AGIs $50k-75k, 905.6% for AGIs $75k-100k, 1489.7% for AGIs $100k-200k, 4526.7% for AGIs over 200k)
Charity contributions: $4,571 (reported on 10.7% of returns)
Here:
$4,571
State:
$15,420
(% of AGI for various income ranges: 3.5% for AGIs below $25k, 17.6% for AGIs $25k-50k, 57.4% for AGIs $50k-75k, 102.3% for AGIs $75k-100k, 231.2% for AGIs $100k-200k, 767.5% for AGIs over 200k)
Taxes paid: $8,970 (reported on 13.0% of returns)
11426:
$8,970
State:
$9,183
(% of AGI for various income ranges: 20.7% for AGIs below $25k, 56.9% for AGIs $25k-50k, 154.3% for AGIs $50k-75k, 334.5% for AGIs $75k-100k, 512.5% for AGIs $100k-200k, 1154.2% for AGIs over 200k)
Earned income credit: $1,871 (reported on 13.4% of returns)
Here:
$1,871
State:
$2,138
(% of AGI for various income ranges: 79.0% for AGIs below $25k, 68.2% for AGIs $25k-50k)
Percentage of individuals using paid preparers for their 2020 taxes: 94.5%
Here:
95%
State:
95%
(% for various income ranges: 92.7% for AGIs below $25k, 96.1% for AGIs $25k-50k, 95.2% for AGIs $50k-75k, 95.1% for AGIs $75k-100k, 94.9% for AGIs $100k-200k, 95.0% for AGIs over 200k)
Averages for the 2012 tax year for zip code 11426, filed in 2013:
Average Adjusted Gross Income (AGI) in 2012: $57,449 (Individual Income Tax Returns)
Here:
$57,449
State:
$77,088
Salary/wage: $56,428 (reported on 80.7% of returns)
Here:
$56,428
State:
$60,593
(% of AGI for various income ranges: 62.1% for AGIs below $25k, 77.5% for AGIs $25k-50k, 78.7% for AGIs $50k-75k, 79.7% for AGIs $75k-100k, 84.1% for AGIs $100k-200k, 76.7% for AGIs over 200k)
Taxable interest for individuals: $943 (reported on 44.1% of returns)
This zip code:
$943
New York:
$3,125
(% of AGI for various income ranges: 1.8% for AGIs below $25k, 0.8% for AGIs $25k-50k, 0.9% for AGIs $50k-75k, 0.7% for AGIs $75k-100k, 0.4% for AGIs $100k-200k, 0.7% for AGIs over 200k)
Ordinary dividends: $2,147 (reported on 21.5% of returns)
Here:
$2,147
State:
$10,299
(% of AGI for various income ranges: 1.5% for AGIs below $25k, 0.8% for AGIs $25k-50k, 1.0% for AGIs $50k-75k, 0.8% for AGIs $75k-100k, 0.6% for AGIs $100k-200k, 0.5% for AGIs over 200k)
Net capital gain/loss in AGI: +$1,976 (reported on 15.0% of returns)
Here:
+$1,976
State:
+$42,474
(% of AGI for various income ranges: 0.3% for AGIs $100k-200k, 4.4% for AGIs over 200k)
Profit/loss from business: +$13,375 (reported on 18.0% of returns)
Here:
+$13,375
State:
+$16,168
(% of AGI for various income ranges: 20.5% for AGIs below $25k, 8.6% for AGIs $25k-50k, 2.6% for AGIs $50k-75k, 2.6% for AGIs $75k-100k, 1.3% for AGIs $100k-200k, 1.9% for AGIs over 200k)
Taxable individual retirement arrangement distribution: $12,054 (reported on 8.1% of returns)
11426:
$12,054
New York:
$17,621
(% of AGI for various income ranges: 2.9% for AGIs below $25k, 1.8% for AGIs $25k-50k, 1.7% for AGIs $50k-75k, 2.0% for AGIs $75k-100k, 1.7% for AGIs $100k-200k)
Self-employment retirement plans: $12,375 (reported on 0.4% of returns)
11426:
$12,375
New York:
$27,330
Total itemized deductions: $23,631 (26% of AGI, reported on 46.9% of returns)
Here:
$23,631
State:
$34,985
Here:
26.0% of AGI
State:
21.3% of AGI
(% of AGI for various income ranges: 11.0% for AGIs below $25k, 20.1% for AGIs $25k-50k, 18.3% for AGIs $50k-75k, 20.8% for AGIs $75k-100k, 20.8% for AGIs $100k-200k, 17.4% for AGIs over 200k)
Charity contributions: $2,478 (reported on 40.9% of returns)
Here:
$2,478
State:
$5,572
(% of AGI for various income ranges: 0.7% for AGIs below $25k, 1.4% for AGIs $25k-50k, 1.9% for AGIs $50k-75k, 2.1% for AGIs $75k-100k, 1.9% for AGIs $100k-200k, 1.6% for AGIs over 200k)
Taxes paid: $10,093 (reported on 46.7% of returns)
11426:
$10,093
State:
$18,656
(% of AGI for various income ranges: 2.5% for AGIs below $25k, 5.1% for AGIs $25k-50k, 7.1% for AGIs $50k-75k, 8.9% for AGIs $75k-100k, 10.2% for AGIs $100k-200k, 10.1% for AGIs over 200k)
Earned income credit: $2,219 (reported on 14.8% of returns)
Here:
$2,219
State:
$2,230
(% of AGI for various income ranges: 5.9% for AGIs below $25k, 1.0% for AGIs $25k-50k)
Percentage of individuals using paid preparers for their 2012 taxes: 73.3%
Here:
73%
State:
66%
(% for various income ranges: 70.4% for AGIs below $25k, 76.1% for AGIs $25k-50k, 72.2% for AGIs $50k-75k, 74.2% for AGIs $75k-100k, 75.9% for AGIs $100k-200k, 75.0% for AGIs over 200k)
Averages for the 2004 tax year for zip code 11426, filed in 2005:
Average Adjusted Gross Income (AGI) in 2004: $48,977 (Individual Income Tax Returns)
Here:
$48,977
State:
$59,519
Salary/wage: $49,727 (reported on 80.7% of returns)
Here:
$49,727
State:
$50,673
(% of AGI for various income ranges: 74.5% for AGIs below $10k, 62.4% for AGIs $10k-25k, 79.1% for AGIs $25k-50k, 81.0% for AGIs $50k-75k, 86.9% for AGIs $75k-100k, 85.7% for AGIs over 100k)
Taxable interest for individuals: $1,328 (reported on 63.2% of returns)
This zip code:
$1,328
New York:
$2,377
(% of AGI for various income ranges: 7.7% for AGIs below $10k, 3.4% for AGIs $10k-25k, 1.7% for AGIs $25k-50k, 1.9% for AGIs $50k-75k, 1.0% for AGIs $75k-100k, 1.4% for AGIs over 100k)
Taxable dividends: $1,545 (reported on 28.9% of returns)
Here:
$1,545
State:
$5,394
(% of AGI for various income ranges: 4.5% for AGIs below $10k, 2.1% for AGIs $10k-25k, 1.0% for AGIs $25k-50k, 0.8% for AGIs $50k-75k, 0.7% for AGIs $75k-100k, 0.7% for AGIs over 100k)
Net capital gain/loss: +$2,261 (reported on 20.4% of returns)
Here:
+$2,261
State:
+$23,581
(% of AGI for various income ranges: -1.7% for AGIs below $10k, -0.1% for AGIs $10k-25k, -0.1% for AGIs $25k-50k, 0.2% for AGIs $50k-75k, 0.2% for AGIs $75k-100k, 2.7% for AGIs over 100k)
Profit/loss from business: +$10,978 (reported on 16.0% of returns)
Here:
+$10,978
State:
+$13,809
(% of AGI for various income ranges: 20.0% for AGIs below $10k, 14.7% for AGIs $10k-25k, 5.5% for AGIs $25k-50k, 1.9% for AGIs $50k-75k, 1.3% for AGIs $75k-100k, 1.9% for AGIs over 100k)
IRA payment deduction: $3,449 (reported on 4.0% of returns)
11426:
$3,449
New York:
$3,115
(% of AGI for various income ranges: 0.4% for AGIs below $10k, 0.3% for AGIs $10k-25k, 0.5% for AGIs $25k-50k, 0.4% for AGIs $50k-75k, 0.2% for AGIs $75k-100k, 0.2% for AGIs over 100k)
Self-employed pension: $9,720 (reported on 0.6% of returns)
Here:
$9,720
New York:
$19,016
Total itemized deductions: $20,220 (27% of AGI, reported on 50.1% of returns)
Here:
$20,220
State:
$25,864
Here:
27.1% of AGI
State:
21.9% of AGI
(% of AGI for various income ranges: 13.8% for AGIs below $10k, 13.1% for AGIs $10k-25k, 19.0% for AGIs $25k-50k, 23.3% for AGIs $50k-75k, 22.8% for AGIs $75k-100k, 20.5% for AGIs over 100k)
Charity contributions deductions: $2,677 (3% of AGI, reported on 46.4% of returns)
Here:
$2,677
State:
$4,439
Here:
3.5% of AGI
State:
3.6% of AGI
(% of AGI for various income ranges: 0.9% for AGIs below $10k, 1.2% for AGIs $10k-25k, 2.3% for AGIs $25k-50k, 3.0% for AGIs $50k-75k, 2.8% for AGIs $75k-100k, 2.6% for AGIs over 100k)
Total tax: $6,107 (reported on 81.2% of returns)
11426:
$6,107
State:
$11,730
(% of AGI for various income ranges: 4.3% for AGIs below $10k, 5.0% for AGIs $10k-25k, 7.2% for AGIs $25k-50k, 8.8% for AGIs $50k-75k, 9.8% for AGIs $75k-100k, 14.0% for AGIs over 100k)
Earned income credit: $1,578 (reported on 10.6% of returns)
Here:
$1,578
State:
$1,757
Percentage of individuals using paid preparers for their 2004 taxes: 69.9%
Here:
70%
State:
67%
(% for various income ranges: 61.8% for AGIs below $10k, 68.9% for AGIs $10k-25k, 71.9% for AGIs $25k-50k, 71.6% for AGIs $50k-75k, 74.5% for AGIs $75k-100k, 73.0% for AGIs over 100k)
Likely homosexual households (counted as self-reported same-sex unmarried-partner households)
Lesbian couples: 0.2% of all households
Gay men: 0.1% of all households
Household received Food Stamps/SNAP in the past 12 months: 494 Household did not receive Food Stamps/SNAP in the past 12 months: 5,689
Women who had a birth in the past 12 months: 146 (144 now married, 0 unmarried) Women who did not have a birth in the past 12 months: 3,678 (1,687 now married, 1,973 unmarried)
Housing units in zip code 11426 with a mortgage: 2,616 (296 second mortgage, 34 home equity loan, 254 both second mortgage and home equity loan) Houses without a mortgage: 34
Median monthly owner costs for units with a mortgage: $2,958 Median monthly owner costs for units without a mortgage: $1,026
Residents with income below the poverty level in 2022:
This zip code:
6.6%
Whole state:
14.3%
Residents with income below 50% of the poverty level in 2022:
This zip code:
4.1%
Whole state:
6.8%
Median number of rooms in houses and condos:
Here:
5.9
State:
6.3
Median number of rooms in apartments:
Here:
4.3
State:
3.8
Notable locations in this zip code not listed on our city pages
Churches in zip code 11426 include: Saint Gregory the Great Church (A), House of Hope Presbyterian Church (B), Holy Trinity Lutheran Church (C), Bellerose Church of God (D), Bellerose Baptist Church (E). Display/hide their locations on the map
Parks in zip code 11426 include: Queens Farm Park (1), Bellerose Playground (2), Breininger Park (3), Patrol Officer William T Gunn Junior Park (4). Display/hide their locations on the map
In group quarters: 81 (-1 institutionalized population)
Size of family households: 1,703 2-persons, 1,120 3-persons, 1,173 4-persons, 532 5-persons, 251 6-persons, 134 7-or-more-persons
Size of nonfamily households: 1,042 1-person, 204 2-persons
2,697 married couples with children.
169 single-parent households (169 women).
39.8% of residents of 11426 zip code speak English at home.
14.1% of residents speak Spanish at home (55% very well, 26% well, 14% not well, 6% not at all).
31.0% of residents speak other Indo-European language at home (67% very well, 24% well, 6% not well, 4% not at all).
14.7% of residents speak Asian or Pacific Island language at home (61% very well, 22% well, 12% not well, 4% not at all).
0.9% of residents speak other language at home (77% very well, 17% well, 6% not well).
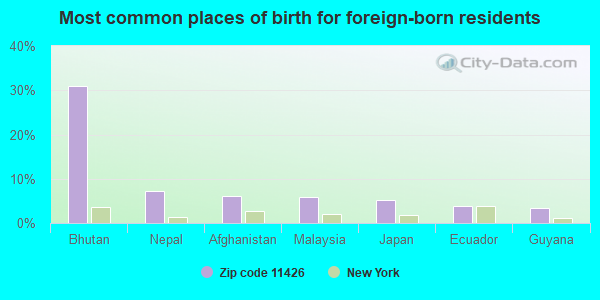
Foreign born population: 9,706 (50.0%) (71.1% of them are naturalized citizens)
This zip code:
50.0%
Whole state:
22.7%
31%Bhutan
7%Nepal
6%Afghanistan
6%Malaysia
5%Japan
4%Ecuador
3%Guyana
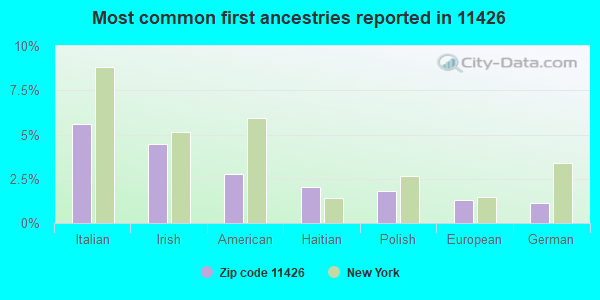
6%Italian
4%Irish
3%American
2%Haitian
2%Polish
1%European
1%German
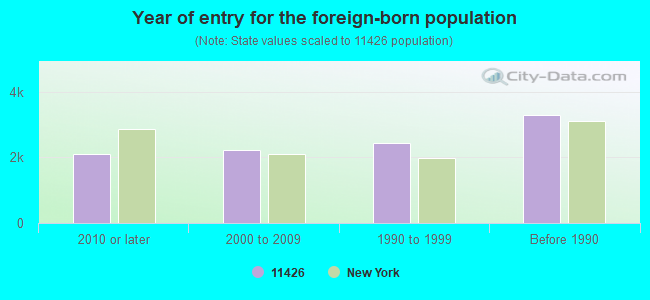
Year of entry for the foreign-born population
2,1012010 or later
2,2172000 to 2009
2,4341990 to 1999
3,286Before 1990
Facilities with environmental interests located in this zip code:
ACCARDI CLEANERS (236-07 BRADDOCK AVENUE in BELLEROSE, NY)
AIR MINOR (AIRS/AFS) STATE MASTER (New York facility tracking) - AIR PROGRAM Small Quantity Generators, between 100 kg and 1000 kg of hazardous waste/month (Resource Conservation and Recovery Act (tracking hazardous waste)) - notification Business SIC classification: DRYCLEANING PLANTS, EXCEPT RUG CLEANING Business NAICS classification: DRYCLEANING AND LAUNDRY SERVICES (EXCEPT COIN-OPERATED). Organizations: NY CLEANER GROUP INC, INJA CORP (CONTACT/OWNER)
, IN JA CORP (LEGALLY RESPONSIBLE PARTY)
Alternative names: ACCARDI S CLEANERS
CON EDISON - MH 10078 (LITTLE NECK PKWY AND 80TH AVE in BELLEROSE, NY)
Large Quantity Generators, more that 1000 kg of hazardous waste/month (Resource Conservation and Recovery Act (tracking hazardous waste)) Organizations: CONSOLIDATED EDISON COMPANY OF NY, INC. (CONTACT/OPERATOR)
CON EDISON - MH 10082 (UNION TPKE AND LITTLE NECK PKY in BELLEROSE, NY)
Large Quantity Generators, more that 1000 kg of hazardous waste/month (Resource Conservation and Recovery Act (tracking hazardous waste)) Organizations: CONSOLIDATED EDISON COMPANY OF NY, INC. (CONTACT/OPERATOR)
BELLEROSE CLEANERS (24811 UNION TURNPIKE in BELLEROSE, NY)
AIR MINOR (AIRS/AFS) Conditionally Exempt Small Quantity Generators, less than 100 kg/month of hazardous waste (Resource Conservation and Recovery Act (tracking hazardous waste)) - notification Business SIC classification: DRYCLEANING PLANTS, EXCEPT RUG CLEANING Organizations: UNITED PROPERTIES CORP (CONTACT/OWNER)
Alternative names: KWANG HEUM YEONS CLEANERS
CON ED-TM 6990 (82 AVE & 256 ST in JAMAICA, NY)
HAZARDOUS WASTE BIENNIAL REPORTER (Resource Conservation and Recovery Act (tracking hazardous waste)) (Resource Conservation and Recovery Act (tracking hazardous waste))
BELLEROSE ANIMAL HOSPITAL INC (242-01 JAMAICA AVE in BELLEROSE, NY)
(Resource Conservation and Recovery Act (tracking hazardous waste))
Small Quantity Generators, between 100 kg and 1000 kg of hazardous waste/month (Resource Conservation and Recovery Act (tracking hazardous waste)) - notification Organizations: NYC DESIGN & CONSTRUCTION FOR BD OF ED (CONTACT/OWNER)
A&J SERVICE STATION, INC. (241-15 HILLSIDE AVENUE in BELLROSE, NY)
ENFORCEMENT/COMPLIANCE ACTIVITY (Integrated Compliance Information System) Business SIC classification: GASOLINE SERVICE STATIONS
Housing units lacking complete plumbing facilities: 0.2% Housing units lacking complete kitchen facilities: 0.3%
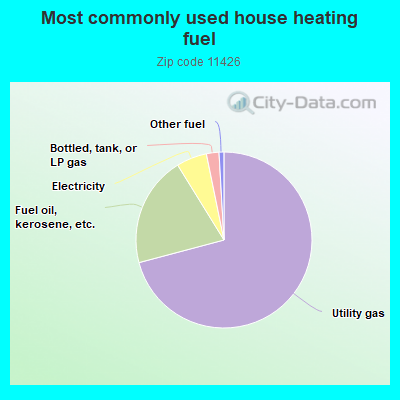
70.8%Utility gas
20.3%Fuel oil, kerosene, etc.
5.6%Electricity
2.3%Bottled, tank, or LP gas
0.9%Other fuel
Population in 1990: 18,145. Population change in the 1990s: +582 (+3.2%).
Place of birth for U.S.-born residents:
This state: 9,006
Northeast: 156
Midwest: 44
South: 28
West: 12
68% of the 11426 zip code residents lived in the same house 5 years ago. Out of people who lived in different houses, 62% lived in this county. Out of people who lived in different counties, 50% lived in New York.
92% of the 11426 zip code residents lived in the same house 1 year ago. Out of people who lived in different houses, 66% moved from this county. Out of people who lived in different houses, 23% moved from different county within same state. Out of people who lived in different houses, 2% moved from different state. Out of people who lived in different houses, 7% moved from abroad.
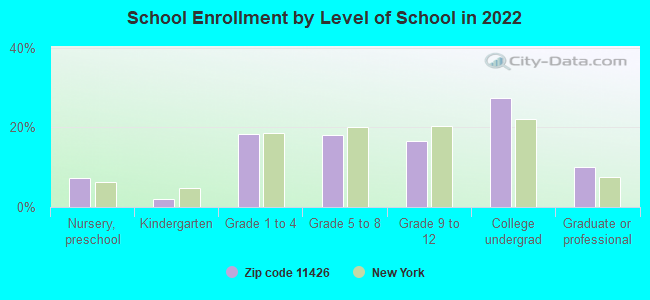
Private vs. public school enrollment:
Students in private schools in grades 1 to 8 (elementary and middle school): 273
Here:
21.1%
New York:
15.6%
Students in private schools in grades 9 to 12 (high school): 64
Here:
11.0%
New York:
15.0%
Students in private undergraduate colleges: 301
Here:
31.1%
New York:
39.2%
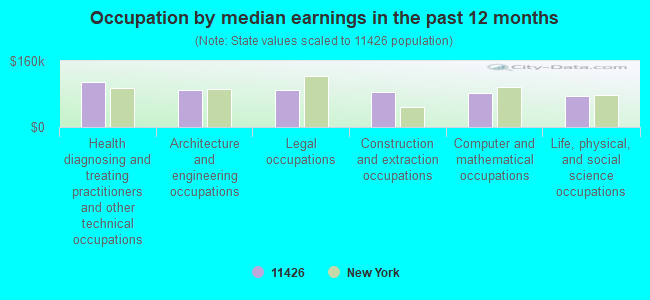
Occupation by median earnings in the past 12 months ($)
109,052Health diagnosing and treating practitioners and other technical occupations
90,503Architecture and engineering occupations
90,193Legal occupations
84,773Construction and extraction occupations
82,556Computer and mathematical occupations
76,036Life, physical, and social science occupations
Top industries in this zip code by the number of employees in 2005:
Health Care and Social Assistance: Psychiatric and Substance Abuse Hospitals (250-499 employees: 1 establishment)
Other Services (except Public Administration): Civic and Social Organizations (250-499: 1)
Administrative and Support and Waste Management and Remediation Services: Security Guards and Patrol Services (100-249: 1)
2007 - 2018 National Fire Incident Reporting System (NFIRS) incidents
According to the data from the years 2007 - 2018 the average number of fire incidents per year is 71. The highest number of reported fires - 95 took place in 2015, and the least - 38 in 2007. The data has a rising trend.
When looking into fire subcategories, the most incidents belonged to: Structure Fires (65.1%), and Outside Fires (18.8%).
Fire incident types reported to NFIRS in Zip Code 11426


 Nearest zip codes: 11004, 11005, 11001, 11427, 11428, 11362.


 According to the data from the years 2007 - 2018 the average number of fire incidents per year is 71. The highest number of reported fires - 95 took place in 2015, and the least - 38 in 2007. The data has a rising trend.
 When looking into fire subcategories, the most incidents belonged to: Structure Fires (65.1%), and Outside Fires (18.8%).