Estimated zip code population in 2022: 42,707 Zip code population in 2010: 40,113 Zip code population in 2000: 37,759
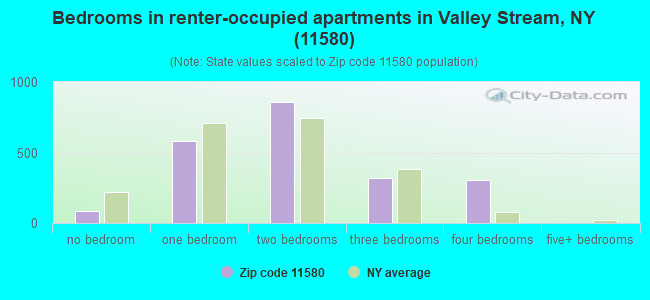
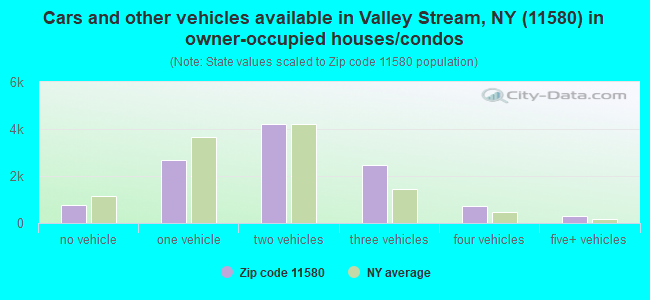
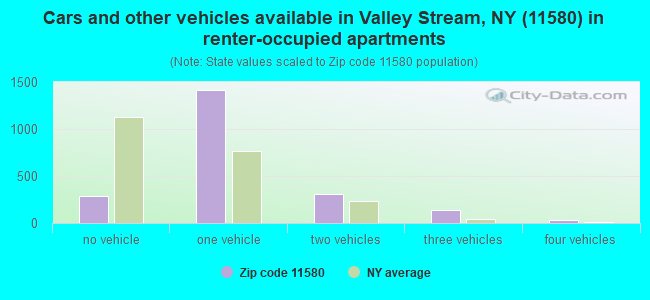
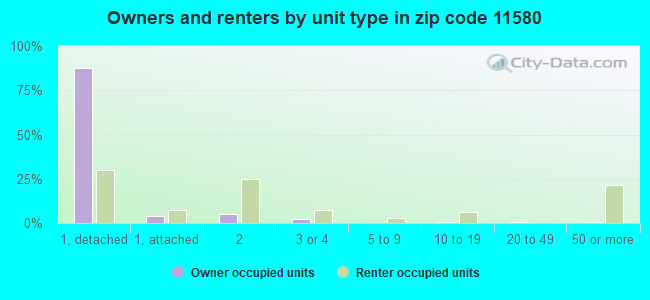
Houses and condos: 13,963 Renter-occupied apartments: 2,175
% of renters here:
16%
State:
46%
March 2022 cost of living index in zip code 11580: 148.9 (very high, U.S. average is 100)
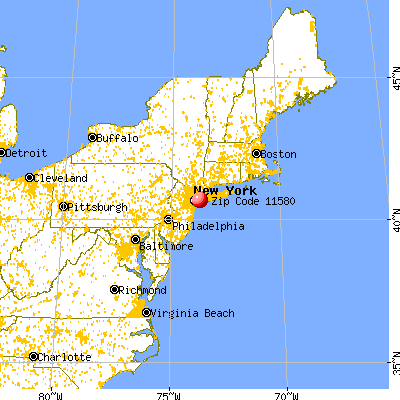
Land area: 3.9 sq. mi. Water area: 0.0 sq. mi.
Population density: 10,948 people per square mile
(high).
OSM Map
General Map
Google Map
MSN Map
OSM Map
General Map
Google Map
MSN Map
OSM Map
General Map
Google Map
MSN Map
OSM Map
General Map
Google Map
MSN Map
Please wait while loading the map...
Real estate property taxes paid for housing units in 2022:
This zip code:
1.6% ($9,805)
New York:
1.5% ($6,180)
Median real estate property taxes paid for housing units with mortgages in 2022: $9,858 (1.6%) Median real estate property taxes paid for housing units with no mortgage in 2022: $9,755 (1.7%)
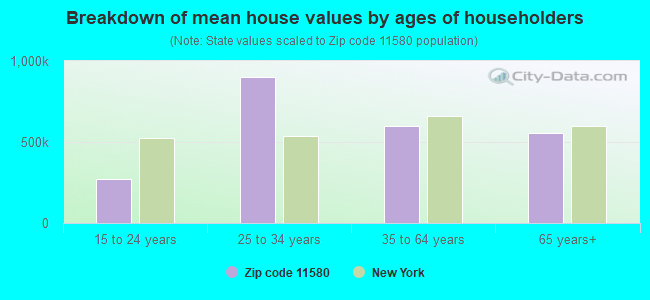
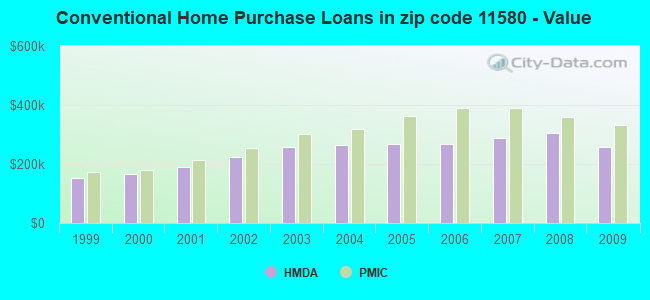
Estimated median house/condo value in 2022: $600,027
11580:
$600,027
New York:
$400,400
According to our research of New York and other state lists, there were 11 registered sex offenders living in 11580 zip code as of April 27, 2024. The ratio of all residents to sex offenders in zip code 11580 is 3,985 to 1. The ratio of registered sex offenders to all residents in this zip code is much lower than the state average.
Median resident age:
This zip code:
43.0 years
New York median age:
40.0 years
Average household size:
This zip code:
3.2 people
New York:
2.5 people
Averages for the 2020 tax year for zip code 11580, filed in 2021:
Average Adjusted Gross Income (AGI) in 2020: $69,903 (Individual Income Tax Returns)
Here:
$69,903
State:
$90,930
Salary/wage: $65,774 (reported on 81.4% of returns)
Here:
$65,774
State:
$72,104
(% of AGI for various income ranges: 1072.4% for AGIs below $25k, 3514.9% for AGIs $25k-50k, 6802.4% for AGIs $50k-75k, 10375.1% for AGIs $75k-100k, 19047.0% for AGIs $100k-200k, 65428.5% for AGIs over 200k)
Taxable interest for individuals: $1,057 (reported on 36.9% of returns)
This zip code:
$1,057
New York:
$3,075
(% of AGI for various income ranges: 13.0% for AGIs below $25k, 20.7% for AGIs $25k-50k, 47.6% for AGIs $50k-75k, 57.7% for AGIs $75k-100k, 118.4% for AGIs $100k-200k, 725.9% for AGIs over 200k)
Ordinary dividends: $4,150 (reported on 16.9% of returns)
Here:
$4,150
State:
$11,095
(% of AGI for various income ranges: 17.2% for AGIs below $25k, 27.4% for AGIs $25k-50k, 65.1% for AGIs $50k-75k, 92.4% for AGIs $75k-100k, 204.8% for AGIs $100k-200k, 1807.4% for AGIs over 200k)
Net capital gain/loss in AGI: +$9,962 (reported on 16.6% of returns)
Here:
+$9,962
State:
+$44,925
(% of AGI for various income ranges: 6.2% for AGIs below $25k, 23.8% for AGIs $25k-50k, 53.3% for AGIs $50k-75k, 96.3% for AGIs $75k-100k, 285.4% for AGIs $100k-200k, 8131.2% for AGIs over 200k)
Profit/loss from business: +$7,907 (reported on 19.4% of returns)
Here:
+$7,907
State:
+$14,940
(% of AGI for various income ranges: 257.7% for AGIs below $25k, 223.3% for AGIs $25k-50k, 140.7% for AGIs $50k-75k, 130.8% for AGIs $75k-100k, 209.4% for AGIs $100k-200k, 1427.9% for AGIs over 200k)
Taxable individual retirement arrangement distribution: $16,474 (reported on 5.9% of returns)
11580:
$16,474
New York:
$19,609
(% of AGI for various income ranges: 36.1% for AGIs below $25k, 54.7% for AGIs $25k-50k, 108.1% for AGIs $50k-75k, 199.2% for AGIs $75k-100k, 322.4% for AGIs $100k-200k, 1330.0% for AGIs over 200k)
Self-employed (Keogh) retirement plans: $16,060 (reported on 0.2% of returns)
11580:
$16,060
New York:
$32,497
(% of AGI for various income ranges: 30.4% for AGIs $100k-200k)
Total itemized deductions: $27,086 (reported on 18.6% of returns)
Here:
$27,086
State:
$39,326
(% of AGI for various income ranges: 100.1% for AGIs below $25k, 244.9% for AGIs $25k-50k, 624.7% for AGIs $50k-75k, 1096.9% for AGIs $75k-100k, 1992.7% for AGIs $100k-200k, 5131.5% for AGIs over 200k)
Charity contributions: $5,558 (reported on 15.3% of returns)
Here:
$5,558
State:
$15,420
(% of AGI for various income ranges: 5.0% for AGIs below $25k, 21.4% for AGIs $25k-50k, 73.9% for AGIs $50k-75k, 155.6% for AGIs $75k-100k, 363.7% for AGIs $100k-200k, 1450.9% for AGIs over 200k)
Taxes paid: $9,504 (reported on 18.5% of returns)
11580:
$9,504
State:
$9,183
(% of AGI for various income ranges: 39.8% for AGIs below $25k, 89.6% for AGIs $25k-50k, 232.8% for AGIs $50k-75k, 405.0% for AGIs $75k-100k, 693.8% for AGIs $100k-200k, 1471.2% for AGIs over 200k)
Earned income credit: $2,047 (reported on 12.4% of returns)
Here:
$2,047
State:
$2,138
(% of AGI for various income ranges: 81.5% for AGIs below $25k, 62.7% for AGIs $25k-50k, 0.8% for AGIs $50k-75k)
Percentage of individuals using paid preparers for their 2020 taxes: 94.5%
Here:
95%
State:
95%
(% for various income ranges: 92.5% for AGIs below $25k, 95.4% for AGIs $25k-50k, 95.6% for AGIs $50k-75k, 95.2% for AGIs $75k-100k, 95.2% for AGIs $100k-200k, 94.3% for AGIs over 200k)
Averages for the 2012 tax year for zip code 11580, filed in 2013:
Average Adjusted Gross Income (AGI) in 2012: $60,730 (Individual Income Tax Returns)
Here:
$60,730
State:
$77,088
Salary/wage: $58,700 (reported on 83.4% of returns)
Here:
$58,700
State:
$60,593
(% of AGI for various income ranges: 67.3% for AGIs below $25k, 82.2% for AGIs $25k-50k, 81.5% for AGIs $50k-75k, 82.9% for AGIs $75k-100k, 84.8% for AGIs $100k-200k, 70.5% for AGIs over 200k)
Taxable interest for individuals: $1,098 (reported on 41.7% of returns)
This zip code:
$1,098
New York:
$3,125
(% of AGI for various income ranges: 1.4% for AGIs below $25k, 0.7% for AGIs $25k-50k, 0.6% for AGIs $50k-75k, 0.7% for AGIs $75k-100k, 0.5% for AGIs $100k-200k, 1.3% for AGIs over 200k)
Ordinary dividends: $4,092 (reported on 18.4% of returns)
Here:
$4,092
State:
$10,299
(% of AGI for various income ranges: 1.5% for AGIs below $25k, 0.9% for AGIs $25k-50k, 1.0% for AGIs $50k-75k, 0.9% for AGIs $75k-100k, 0.7% for AGIs $100k-200k, 3.6% for AGIs over 200k)
Net capital gain/loss in AGI: +$2,790 (reported on 13.6% of returns)
Here:
+$2,790
State:
+$42,474
(% of AGI for various income ranges: 0.3% for AGIs $100k-200k, 4.4% for AGIs over 200k)
Profit/loss from business: +$10,832 (reported on 15.6% of returns)
Here:
+$10,832
State:
+$16,168
(% of AGI for various income ranges: 15.3% for AGIs below $25k, 3.9% for AGIs $25k-50k, 1.9% for AGIs $50k-75k, 1.1% for AGIs $75k-100k, 0.9% for AGIs $100k-200k, 3.6% for AGIs over 200k)
Taxable individual retirement arrangement distribution: $14,018 (reported on 8.4% of returns)
11580:
$14,018
New York:
$17,621
(% of AGI for various income ranges: 2.8% for AGIs below $25k, 1.9% for AGIs $25k-50k, 1.9% for AGIs $50k-75k, 1.7% for AGIs $75k-100k, 1.8% for AGIs $100k-200k, 2.3% for AGIs over 200k)
Self-employment retirement plans: $21,214 (reported on 0.3% of returns)
11580:
$21,214
New York:
$27,330
Total itemized deductions: $26,382 (28% of AGI, reported on 49.9% of returns)
Here:
$26,382
State:
$34,985
Here:
28.2% of AGI
State:
21.3% of AGI
(% of AGI for various income ranges: 16.7% for AGIs below $25k, 19.2% for AGIs $25k-50k, 23.0% for AGIs $50k-75k, 25.1% for AGIs $75k-100k, 23.1% for AGIs $100k-200k, 16.8% for AGIs over 200k)
Charity contributions: $2,952 (reported on 43.4% of returns)
Here:
$2,952
State:
$5,572
(% of AGI for various income ranges: 0.9% for AGIs below $25k, 1.7% for AGIs $25k-50k, 2.3% for AGIs $50k-75k, 2.4% for AGIs $75k-100k, 2.3% for AGIs $100k-200k, 1.9% for AGIs over 200k)
Taxes paid: $11,764 (reported on 49.7% of returns)
11580:
$11,764
State:
$18,656
(% of AGI for various income ranges: 6.4% for AGIs below $25k, 7.1% for AGIs $25k-50k, 9.2% for AGIs $50k-75k, 10.7% for AGIs $75k-100k, 10.8% for AGIs $100k-200k, 9.8% for AGIs over 200k)
Earned income credit: $2,101 (reported on 14.6% of returns)
Here:
$2,101
State:
$2,230
(% of AGI for various income ranges: 5.9% for AGIs below $25k, 0.9% for AGIs $25k-50k)
Percentage of individuals using paid preparers for their 2012 taxes: 73.2%
Here:
73%
State:
66%
(% for various income ranges: 68.9% for AGIs below $25k, 73.1% for AGIs $25k-50k, 74.1% for AGIs $50k-75k, 76.6% for AGIs $75k-100k, 78.1% for AGIs $100k-200k, 79.2% for AGIs over 200k)
Averages for the 2004 tax year for zip code 11580, filed in 2005:
Average Adjusted Gross Income (AGI) in 2004: $52,546 (Individual Income Tax Returns)
Here:
$52,546
State:
$59,519
Salary/wage: $50,858 (reported on 83.0% of returns)
Here:
$50,858
State:
$50,673
(% of AGI for various income ranges: 102.3% for AGIs below $10k, 69.1% for AGIs $10k-25k, 83.7% for AGIs $25k-50k, 83.3% for AGIs $50k-75k, 85.7% for AGIs $75k-100k, 75.9% for AGIs over 100k)
Taxable interest for individuals: $1,345 (reported on 60.8% of returns)
This zip code:
$1,345
New York:
$2,377
(% of AGI for various income ranges: 8.5% for AGIs below $10k, 3.3% for AGIs $10k-25k, 1.7% for AGIs $25k-50k, 1.5% for AGIs $50k-75k, 1.0% for AGIs $75k-100k, 1.3% for AGIs over 100k)
Taxable dividends: $2,851 (reported on 28.1% of returns)
Here:
$2,851
State:
$5,394
(% of AGI for various income ranges: 6.5% for AGIs below $10k, 2.5% for AGIs $10k-25k, 1.1% for AGIs $25k-50k, 1.0% for AGIs $50k-75k, 0.8% for AGIs $75k-100k, 2.0% for AGIs over 100k)
Net capital gain/loss: +$5,679 (reported on 21.2% of returns)
Here:
+$5,679
State:
+$23,581
(% of AGI for various income ranges: -3.0% for AGIs below $10k, 0.2% for AGIs $10k-25k, -0.2% for AGIs $25k-50k, 0.3% for AGIs $50k-75k, 0.4% for AGIs $75k-100k, 5.8% for AGIs over 100k)
Profit/loss from business: +$11,372 (reported on 13.9% of returns)
Here:
+$11,372
State:
+$13,809
(% of AGI for various income ranges: 17.8% for AGIs below $10k, 9.5% for AGIs $10k-25k, 3.5% for AGIs $25k-50k, 1.9% for AGIs $50k-75k, 1.6% for AGIs $75k-100k, 2.6% for AGIs over 100k)
IRA payment deduction: $3,269 (reported on 3.4% of returns)
11580:
$3,269
New York:
$3,115
(% of AGI for various income ranges: 0.3% for AGIs below $10k, 0.3% for AGIs $10k-25k, 0.3% for AGIs $25k-50k, 0.3% for AGIs $50k-75k, 0.2% for AGIs $75k-100k, 0.1% for AGIs over 100k)
Self-employed pension: $11,328 (reported on 0.7% of returns)
Here:
$11,328
New York:
$19,016
(% of AGI for various income ranges: 0.1% for AGIs $25k-50k, 0.1% for AGIs $50k-75k, 0.1% for AGIs $75k-100k, 0.3% for AGIs over 100k)
Total itemized deductions: $22,684 (29% of AGI, reported on 54.3% of returns)
Here:
$22,684
State:
$25,864
Here:
29.3% of AGI
State:
21.9% of AGI
(% of AGI for various income ranges: 23.2% for AGIs below $10k, 21.4% for AGIs $10k-25k, 24.6% for AGIs $25k-50k, 26.4% for AGIs $50k-75k, 26.3% for AGIs $75k-100k, 20.4% for AGIs over 100k)
Charity contributions deductions: $2,985 (4% of AGI, reported on 50.6% of returns)
Here:
$2,985
State:
$4,439
Here:
3.7% of AGI
State:
3.6% of AGI
(% of AGI for various income ranges: 1.3% for AGIs below $10k, 1.9% for AGIs $10k-25k, 2.8% for AGIs $25k-50k, 3.3% for AGIs $50k-75k, 3.1% for AGIs $75k-100k, 2.8% for AGIs over 100k)
Total tax: $7,123 (reported on 78.1% of returns)
11580:
$7,123
State:
$11,730
(% of AGI for various income ranges: 4.4% for AGIs below $10k, 4.2% for AGIs $10k-25k, 6.3% for AGIs $25k-50k, 8.4% for AGIs $50k-75k, 9.3% for AGIs $75k-100k, 15.5% for AGIs over 100k)
Earned income credit: $1,579 (reported on 10.4% of returns)
Here:
$1,579
State:
$1,757
Percentage of individuals using paid preparers for their 2004 taxes: 71.6%
Here:
72%
State:
67%
(% for various income ranges: 64.3% for AGIs below $10k, 71.3% for AGIs $10k-25k, 71.9% for AGIs $25k-50k, 73.8% for AGIs $50k-75k, 74.9% for AGIs $75k-100k, 75.6% for AGIs over 100k)
Likely homosexual households (counted as self-reported same-sex unmarried-partner households)
Lesbian couples: 0.3% of all households
Gay men: 0.1% of all households
Household received Food Stamps/SNAP in the past 12 months: 855 Household did not receive Food Stamps/SNAP in the past 12 months: 12,458
Women who had a birth in the past 12 months: 394 (233 now married, 164 unmarried) Women who did not have a birth in the past 12 months: 9,508 (3,496 now married, 6,010 unmarried)
Housing units in zip code 11580 with a mortgage: 8,062 (642 second mortgage, 49 home equity loan, 368 both second mortgage and home equity loan) Houses without a mortgage: 128
Median monthly owner costs for units with a mortgage: $3,318 Median monthly owner costs for units without a mortgage: $1,374
Residents with income below the poverty level in 2022:
This zip code:
4.4%
Whole state:
14.3%
Residents with income below 50% of the poverty level in 2022:
This zip code:
1.6%
Whole state:
6.8%
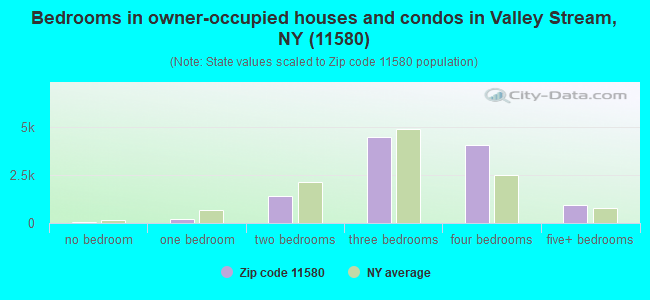
Median number of rooms in houses and condos:
Here:
6.6
State:
6.3
Median number of rooms in apartments:
Here:
3.7
State:
3.8
Notable locations in this zip code not listed on our city pages
Churches in zip code 11580 include: Blessed Sacrament Church (A), Calvary Faith Tabernacle (B), First Church of Christ Scientist (C), Islamic Center of South Shore (D), Saint John's United Methodist Church (E), Bethlehem Assembly of God Church (F), Congregation Tree of Life (G), Grace United Methodist Church (H), Holy Name of Mary Roman Catholic Church (I). Display/hide their locations on the map
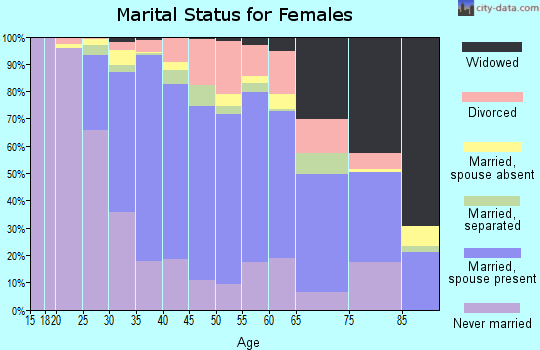
4,899 married couples with children.
1,183 single-parent households (496 men, 687 women).
59.6% of residents of 11580 zip code speak English at home.
16.6% of residents speak Spanish at home (67% very well, 21% well, 8% not well, 4% not at all).
14.5% of residents speak other Indo-European language at home (68% very well, 20% well, 11% not well, 1% not at all).
6.9% of residents speak Asian or Pacific Island language at home (53% very well, 22% well, 20% not well, 4% not at all).
2.2% of residents speak other language at home (85% very well, 9% well, 7% not well).
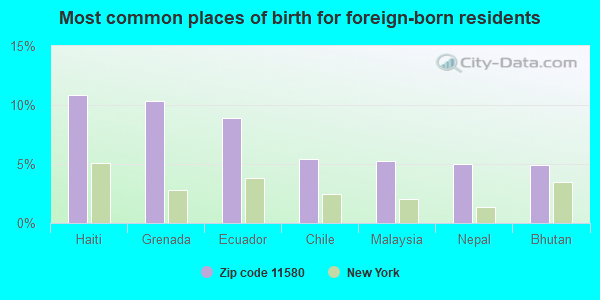
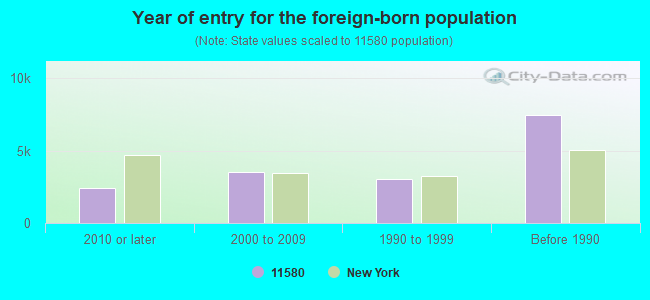
Foreign born population: 16,208 (38.0%) (85.4% of them are naturalized citizens)
Major facilities with environmental interests located in this zip code:
CLASSIC CLEANERS (233 W MERRICK RD in VALLEY STREAM, NY)
AIR MINOR (AIRS/AFS) STATE MASTER (New York facility tracking) - AIR PROGRAM, HAZARDOUS WASTE PROGRAM Small Quantity Generators, between 100 kg and 1000 kg of hazardous waste/month (Resource Conservation and Recovery Act (tracking hazardous waste)) Business SIC classification: DRYCLEANING PLANTS, EXCEPT RUG CLEANING Business NAICS classification: DRYCLEANING AND LAUNDRY SERVICES (EXCEPT COIN-OPERATED). Organizations: CLASSIC CLEANERS OF NY INC, DAVID ROSENBLATT (CONTACT/OPERATOR)
, MARK WILKINS (CONTACT/OWNER)
, SEROTA PROPERTIES (CONTACT/OWNER)
, 233 CLEANERS CORP (LEGALLY RESPONSIBLE PARTY)
Alternative names: 233 CLEANERS CORP, LEGACY CLEANERS
CITY AUTOBODY INC (906 W MERRICK RD in VALLEY STREAM, NY)
STATE MASTER (New York facility tracking) - AIR PROGRAM Conditionally Exempt Small Quantity Generators, less than 100 kg/month of hazardous waste (Resource Conservation and Recovery Act (tracking hazardous waste)) Business NAICS classification: AUTOMOTIVE BODY, PAINT, AND INTERIOR REPAIR AND MAINTENANCE. Organizations: MICHAEL FEDE (CONTACT/OPERATOR)
, CITY AUTO BODY INC (CONTACT/OWNER)
, VINNIE S AUTO BODY (LEGALLY RESPONSIBLE PARTY)
Alternative names: CITY AUTO BODY INC
ALDEN TERRACE SCHOOL ( in VALLEY STREAM, NY)
(Geographic Names Information System) (National Center for Education Statistics) - STATE ID-280216020001 Organizations: ELMONT UFSD (SCHOOL DISTRICT)
HOWELL ROAD SCHOOL ( in VALLEY STREAM, NY)
(Geographic Names Information System) (National Center for Education Statistics) - STATE ID-280213020002 Organizations: VALLEY STREAM 13 UFSD (SCHOOL DISTRICT)
CLEARSTREAM AVE SCHOOL ( in VALLEY STREAM, NY)
(Geographic Names Information System) (National Center for Education Statistics) - STATE ID-280230020001 Organizations: VALLEY STREAM 30 UFSD (SCHOOL DISTRICT)
AMOCO (227 N CENTRAL AVE in VALLEY STREAM, NY)
(Resource Conservation and Recovery Act (tracking hazardous waste)) Organizations: JAMES RUBINO (CONTACT/OWNER)
J & E AUTO REPAIR INC (385 W MERRICK RD in VALLEY STREAM, NY)
622 WEST MERRICK ROAD REALTY CORP (622 W MERRICK RD in VALLEY STREAM, NY)
(Resource Conservation and Recovery Act (tracking hazardous waste))
A B C MOTORS INC (395 W MERRICK RD in VALLEY STREAM, NY)
(Resource Conservation and Recovery Act (tracking hazardous waste))
AAMCO (200 EAST MERRICK ROAD in VALLEY STREAM, NY)
(Resource Conservation and Recovery Act (tracking hazardous waste))
AMERADA HESS STATION 32261 (720 FRANKLIN AVE in VALLEY STREAM, NY)
(Resource Conservation and Recovery Act (tracking hazardous waste))
AMERICAN OF VALLEY STREAM (227 N CENTRAL AVE in VALLEY STREAM, NY)
(Resource Conservation and Recovery Act (tracking hazardous waste))
Housing units lacking complete plumbing facilities: 0.1% Housing units lacking complete kitchen facilities: 0.3%
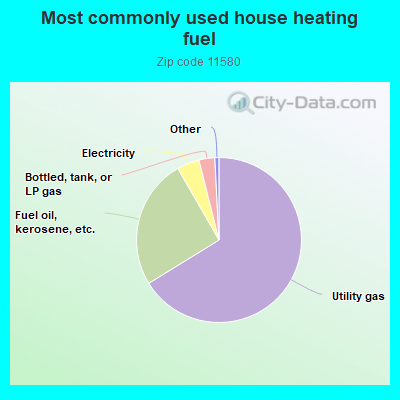
66.2%Utility gas
25.5%Fuel oil, kerosene, etc.
4.4%Electricity
3.1%Bottled, tank, or LP gas
Population in 1990: 34,327. Population change in the 1990s: +3,432 (+10.0%).
Place of birth for U.S.-born residents:
This state: 24,342
Northeast: 670
Midwest: 203
South: 495
West: 99
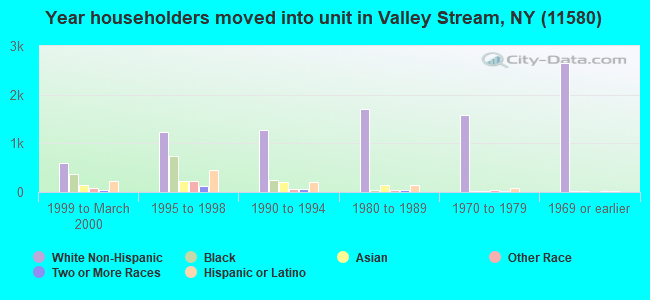
69% of the 11580 zip code residents lived in the same house 5 years ago. Out of people who lived in different houses, 35% lived in this county. Out of people who lived in different counties, 50% lived in New York.
94% of the 11580 zip code residents lived in the same house 1 year ago. Out of people who lived in different houses, 31% moved from this county. Out of people who lived in different houses, 63% moved from different county within same state. Out of people who lived in different houses, 4% moved from different state. Out of people who lived in different houses, 2% moved from abroad.
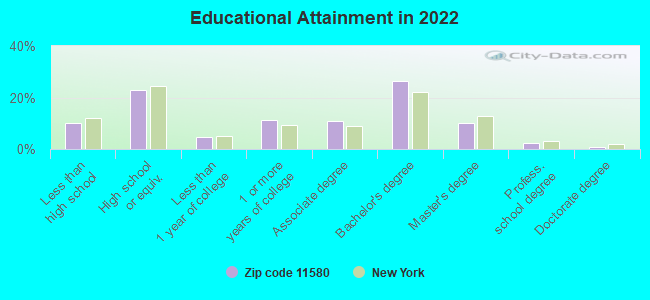
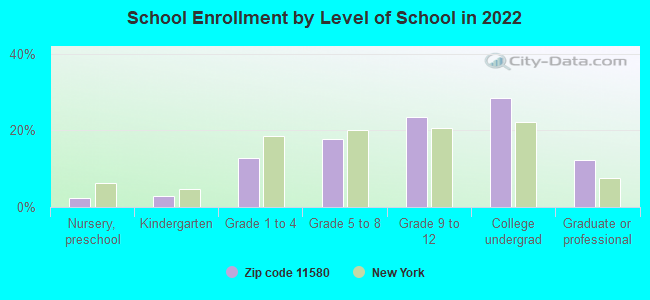
Private vs. public school enrollment:
Students in private schools in grades 1 to 8 (elementary and middle school): 308
Here:
9.3%
New York:
15.6%
Students in private schools in grades 9 to 12 (high school): 385
Here:
15.2%
New York:
15.0%
Students in private undergraduate colleges: 1,405
Here:
45.3%
New York:
39.2%
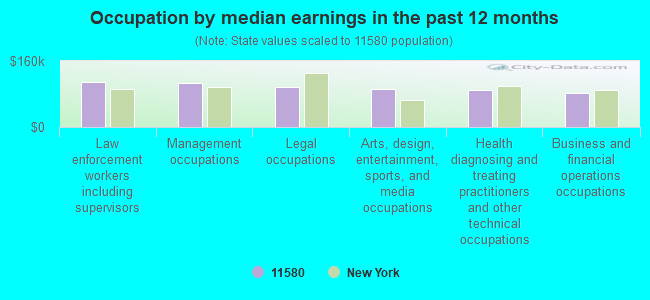
Occupation by median earnings in the past 12 months ($)
109,471Law enforcement workers including supervisors
107,493Management occupations
96,232Legal occupations
91,170Arts, design, entertainment, sports, and media occupations
89,803Health diagnosing and treating practitioners and other technical occupations
81,629Business and financial operations occupations
Companies with federal contracts located in this zip code:
STAVROS PAINTING COMPANY (17 SOUTH IRVING ST in VALLEY STREAM, NY; small business) : $839,011 in 59 contractsfrom 1999 to 2004
Contracts for Maintenance, Repair or Alteration of Real Property -- Miscellaneous Buildings by Navy Signed by year:2000: $267,774; 2001: $133,500; 2002: $395,837; 2003: $0; 2004: $31,900; 2005: $0; 2006: $0.
Biggest contracts:
$25,000 with Navy for Maintenance, Repair or Alteration of Real Property -- Miscellaneous Buildings. Signed on 2002-09-16. Completion date: 2002-12-31.
$25,000, same as above.Signed on 2001-04-02. Completion date: 2001-09-30.
$24,900, same as above.Signed on 2001-10-01. Completion date: 2001-09-20.
$24,350, same as above.Signed on 2000-05-11. Completion date: 2000-06-30.
ALFREDO D BELLAMY (803 BALDWIN DRIVE in WESTBURY, NY; small business) : $296,832 in 6 contractsfrom 2004 to 2006
Contracts for Personal Services Contracts by Departmental Offices Signed by year:2000: $0; 2001: $0; 2002: $0; 2003: $0; 2004: $25,738; 2005: $128,330; 2006: $142,764.
Biggest contracts:
$120,157 with Departmental Offices for Personal Services Contracts. Taking place in DC. Signed on 2006-08-23. Effective on 2006-08-27. Completion date: 2007-08-26.
$64,602, same as above.Signed on 2005-12-21. Completion date: 2006-08-26.
$38,754, same as above.Signed on 2005-08-25. Completion date: 2006-08-26.
$25,738, same as above.Signed on 2004-08-23. Effective on 2004-08-26. Completion date: 2005-08-26.
UNI-STAR INC (285D EAST MERRICK ROAD in VALLEY STREAM, NY; small business) : $63,080 in 4 contractsfrom 2000 to 2002
$35,550 with Navy for Plastics Fabricated Materials. Signed on 2000-03-31. Completion date: 2000-05-31.
$25,790 with Defense Logistics Agency for Gas Turbines and Jet Engines, Aircraft; Prime Moving, and Components. Signed on 2000-03-20. Completion date: 2000-06-12.
$1,740 with Army for Nuts and Washers. Signed on 2002-12-17. Completion date: 2003-05-07.
$0, same as above.Signed on 2002-12-17. Completion date: 2003-05-07.
ADVANCED COMPUTERS, INC (89 OCEAN AVENUE in VALLEY STREAM, NY; small business) : $7,199 in 2 contractsin 2006
$7,199 with Army for ADPE System Configuration. Signed on 2006-01-24. Completion date: 2006-02-10.
$0, same as above.Signed on 2006-07-11. Effective on 2006-05-18. Completion date: 2006-10-31.
FACILAMATIC INSTRUMENT CORP (39 CLINTON AVE in VALLEY STREAM, NY; small business) 500 employees, $0 revenue.
$6,579 with Defense Logistics Agency for Automatic Pilot Mechanisms and Airborne Gyro Components. Signed on 2005-11-03. Completion date: 2006-02-09.
JOSEPH TAKACS, CPA, P C (245 EAST BEVERLY PARKWAY in VALLEY STREAM, NY; small business) : $2,500 in 2 contractsin 2003
$5,450 with Army for Other Professional Services. Signed on 2003-02-12. Completion date: 2003-02-18.
-$2,950, same as above.Signed on 2003-04-11. Completion date: 2003-02-18.
Top industries in this zip code by the number of employees in 2005:
Health Care and Social Assistance: General Medical and Surgical Hospitals (over 1000 employees: 1 establishment)
Administrative and Support and Waste Management and Remediation Services: Office Administrative Services (250-499: 1, 10-19: 1, 5-9: 4, 1-4: 4)
Health Care and Social Assistance: Offices of Physicians (except Mental Health Specialists) (100-249: 1, 20-49: 2, 10-19: 5, 5-9: 6, 1-4: 26)
Construction: Commercial and Institutional Building Construction (100-249: 2, 5-9: 1, 1-4: 2)
2002 - 2018 National Fire Incident Reporting System (NFIRS) incidents
Based on the data from the years 2002 - 2018 the average number of fire incidents per year is 45. The highest number of fire incidents - 161 took place in 2006, and the least - 0 in 2004. The data has a dropping trend.
When looking into fire subcategories, the most incidents belonged to: Structure Fires (33.4%), and Other (27.9%).
Fire incident types reported to NFIRS in Zip Code 11580


 Nearest zip codes: 11003, 11581, 11565, 11563, 11422, 11010.


 Based on the data from the years 2002 - 2018 the average number of fire incidents per year is 45. The highest number of fire incidents - 161 took place in 2006, and the least - 0 in 2004. The data has a dropping trend.
 When looking into fire subcategories, the most incidents belonged to: Structure Fires (33.4%), and Other (27.9%).