Estimated zip code population in 2022: 21,705 Zip code population in 2010: 22,666 Zip code population in 2000: 23,231
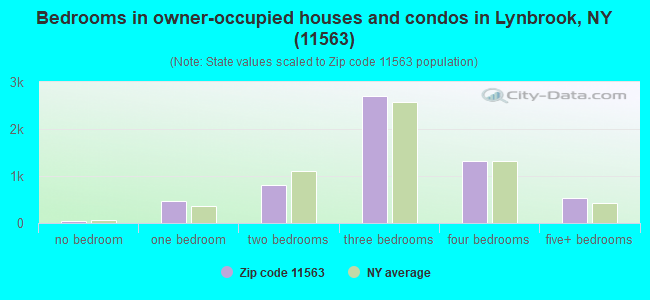
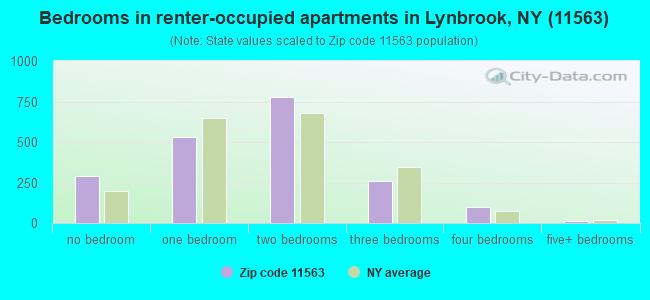
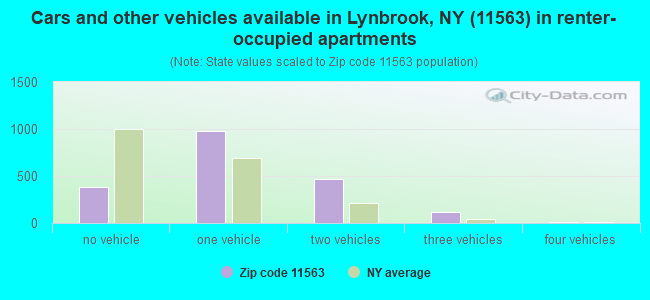
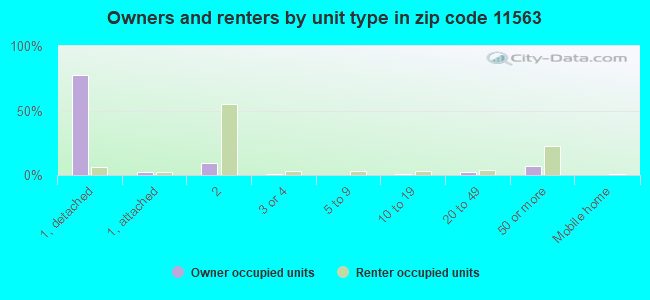
Houses and condos: 8,191 Renter-occupied apartments: 1,956
% of renters here:
25%
State:
46%
March 2022 cost of living index in zip code 11563: 149.2 (very high, U.S. average is 100)
Land area: 2.4 sq. mi. Water area: 0.0 sq. mi.
Population density: 9,051 people per square mile
(high).
OSM Map
General Map
Google Map
MSN Map
OSM Map
General Map
Google Map
MSN Map
OSM Map
General Map
Google Map
MSN Map
OSM Map
General Map
Google Map
MSN Map
Please wait while loading the map...
Real estate property taxes paid for housing units in 2022:
This zip code:
1.6% ($9,805)
New York:
1.5% ($6,180)
Median real estate property taxes paid for housing units with mortgages in 2022: $9,858 (1.5%) Median real estate property taxes paid for housing units with no mortgage in 2022: $9,755 (1.7%)
Estimated median house/condo value in 2022: $615,767
11563:
$615,767
New York:
$400,400
According to our research of New York and other state lists, there was 1 registered sex offender living in 11563 zip code as of April 26, 2024. The ratio of all residents to sex offenders in zip code 11563 is 22,874 to 1. The ratio of registered sex offenders to all residents in this zip code is much lower than the state average.
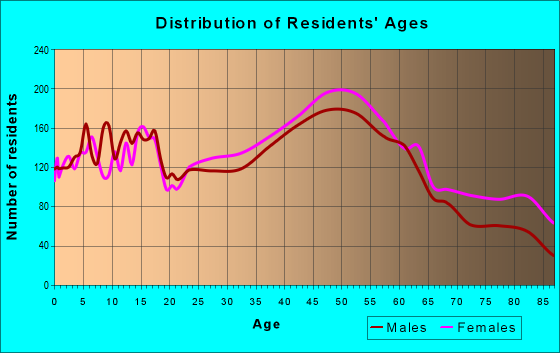
Median resident age:
This zip code:
45.3 years
New York median age:
40.0 years
Average household size:
This zip code:
2.7 people
New York:
2.5 people
Averages for the 2020 tax year for zip code 11563, filed in 2021:
Average Adjusted Gross Income (AGI) in 2020: $94,745 (Individual Income Tax Returns)
Here:
$94,745
State:
$90,930
Salary/wage: $86,092 (reported on 80.3% of returns)
Here:
$86,092
State:
$72,104
(% of AGI for various income ranges: 1119.2% for AGIs below $25k, 3656.5% for AGIs $25k-50k, 6650.9% for AGIs $50k-75k, 9933.3% for AGIs $75k-100k, 18444.1% for AGIs $100k-200k, 66131.2% for AGIs over 200k)
Taxable interest for individuals: $1,257 (reported on 51.1% of returns)
This zip code:
$1,257
New York:
$3,075
(% of AGI for various income ranges: 34.1% for AGIs below $25k, 43.4% for AGIs $25k-50k, 57.8% for AGIs $50k-75k, 116.4% for AGIs $75k-100k, 160.4% for AGIs $100k-200k, 506.0% for AGIs over 200k)
Ordinary dividends: $4,950 (reported on 30.4% of returns)
Here:
$4,950
State:
$11,095
(% of AGI for various income ranges: 55.1% for AGIs below $25k, 73.1% for AGIs $25k-50k, 172.7% for AGIs $50k-75k, 192.6% for AGIs $75k-100k, 327.8% for AGIs $100k-200k, 1597.7% for AGIs over 200k)
Net capital gain/loss in AGI: +$12,604 (reported on 27.0% of returns)
Here:
+$12,604
State:
+$44,925
(% of AGI for various income ranges: 25.0% for AGIs below $25k, 51.1% for AGIs $25k-50k, 109.7% for AGIs $50k-75k, 179.0% for AGIs $75k-100k, 377.2% for AGIs $100k-200k, 6930.9% for AGIs over 200k)
Profit/loss from business: +$11,812 (reported on 14.8% of returns)
Here:
+$11,812
State:
+$14,940
(% of AGI for various income ranges: 181.4% for AGIs below $25k, 216.5% for AGIs $25k-50k, 84.4% for AGIs $50k-75k, 130.2% for AGIs $75k-100k, 330.2% for AGIs $100k-200k, 1719.5% for AGIs over 200k)
Taxable individual retirement arrangement distribution: $16,840 (reported on 10.5% of returns)
11563:
$16,840
New York:
$19,609
(% of AGI for various income ranges: 89.1% for AGIs below $25k, 147.1% for AGIs $25k-50k, 211.9% for AGIs $50k-75k, 355.2% for AGIs $75k-100k, 463.1% for AGIs $100k-200k, 1018.1% for AGIs over 200k)
Self-employed (Keogh) retirement plans: $20,825 (reported on 0.7% of returns)
11563:
$20,825
New York:
$32,497
(% of AGI for various income ranges: 20.4% for AGIs $100k-200k, 310.5% for AGIs over 200k)
Total itemized deductions: $27,683 (reported on 19.2% of returns)
Here:
$27,683
State:
$39,326
(% of AGI for various income ranges: 172.3% for AGIs below $25k, 272.7% for AGIs $25k-50k, 565.7% for AGIs $50k-75k, 865.9% for AGIs $75k-100k, 1569.0% for AGIs $100k-200k, 3887.4% for AGIs over 200k)
Charity contributions: $4,589 (reported on 16.9% of returns)
Here:
$4,589
State:
$15,420
(% of AGI for various income ranges: 9.0% for AGIs below $25k, 21.2% for AGIs $25k-50k, 54.3% for AGIs $50k-75k, 100.9% for AGIs $75k-100k, 221.9% for AGIs $100k-200k, 831.4% for AGIs over 200k)
Taxes paid: $9,336 (reported on 19.1% of returns)
11563:
$9,336
State:
$9,183
(% of AGI for various income ranges: 50.9% for AGIs below $25k, 89.3% for AGIs $25k-50k, 194.6% for AGIs $50k-75k, 327.3% for AGIs $75k-100k, 551.8% for AGIs $100k-200k, 1161.4% for AGIs over 200k)
Earned income credit: $1,808 (reported on 6.3% of returns)
Here:
$1,808
State:
$2,138
(% of AGI for various income ranges: 52.6% for AGIs below $25k, 38.5% for AGIs $25k-50k)
Percentage of individuals using paid preparers for their 2020 taxes: 95.3%
Here:
95%
State:
95%
(% for various income ranges: 93.6% for AGIs below $25k, 95.2% for AGIs $25k-50k, 96.5% for AGIs $50k-75k, 96.1% for AGIs $75k-100k, 95.8% for AGIs $100k-200k, 95.7% for AGIs over 200k)
Averages for the 2012 tax year for zip code 11563, filed in 2013:
Average Adjusted Gross Income (AGI) in 2012: $74,051 (Individual Income Tax Returns)
Here:
$74,051
State:
$77,088
Salary/wage: $70,131 (reported on 80.3% of returns)
Here:
$70,131
State:
$60,593
(% of AGI for various income ranges: 63.8% for AGIs below $25k, 74.0% for AGIs $25k-50k, 76.0% for AGIs $50k-75k, 74.2% for AGIs $75k-100k, 80.1% for AGIs $100k-200k, 73.4% for AGIs over 200k)
Taxable interest for individuals: $1,180 (reported on 55.5% of returns)
This zip code:
$1,180
New York:
$3,125
(% of AGI for various income ranges: 2.7% for AGIs below $25k, 1.3% for AGIs $25k-50k, 0.9% for AGIs $50k-75k, 0.8% for AGIs $75k-100k, 0.7% for AGIs $100k-200k, 0.7% for AGIs over 200k)
Ordinary dividends: $3,730 (reported on 30.6% of returns)
Here:
$3,730
State:
$10,299
(% of AGI for various income ranges: 3.7% for AGIs below $25k, 2.0% for AGIs $25k-50k, 1.6% for AGIs $50k-75k, 1.3% for AGIs $75k-100k, 1.0% for AGIs $100k-200k, 2.0% for AGIs over 200k)
Net capital gain/loss in AGI: +$4,322 (reported on 23.1% of returns)
Here:
+$4,322
State:
+$42,474
(% of AGI for various income ranges: 0.4% for AGIs $75k-100k, 0.6% for AGIs $100k-200k, 4.8% for AGIs over 200k)
Profit/loss from business: +$12,020 (reported on 13.6% of returns)
Here:
+$12,020
State:
+$16,168
(% of AGI for various income ranges: 9.8% for AGIs below $25k, 3.4% for AGIs $25k-50k, 1.7% for AGIs $50k-75k, 1.7% for AGIs $75k-100k, 1.4% for AGIs $100k-200k, 2.2% for AGIs over 200k)
Taxable individual retirement arrangement distribution: $13,693 (reported on 12.7% of returns)
11563:
$13,693
New York:
$17,621
(% of AGI for various income ranges: 6.0% for AGIs below $25k, 3.4% for AGIs $25k-50k, 2.8% for AGIs $50k-75k, 2.7% for AGIs $75k-100k, 2.1% for AGIs $100k-200k, 1.3% for AGIs over 200k)
Self-employment retirement plans: $15,975 (reported on 0.7% of returns)
11563:
$15,975
New York:
$27,330
(% of AGI for various income ranges: 0.3% for AGIs $25k-50k, 0.1% for AGIs $100k-200k, 0.3% for AGIs over 200k)
Total itemized deductions: $28,493 (25% of AGI, reported on 53.5% of returns)
Here:
$28,493
State:
$34,985
Here:
25.3% of AGI
State:
21.3% of AGI
(% of AGI for various income ranges: 23.0% for AGIs below $25k, 19.4% for AGIs $25k-50k, 19.8% for AGIs $50k-75k, 21.6% for AGIs $75k-100k, 21.9% for AGIs $100k-200k, 18.1% for AGIs over 200k)
Charity contributions: $2,626 (reported on 48.6% of returns)
Here:
$2,626
State:
$5,572
(% of AGI for various income ranges: 1.1% for AGIs below $25k, 1.4% for AGIs $25k-50k, 1.7% for AGIs $50k-75k, 2.0% for AGIs $75k-100k, 1.8% for AGIs $100k-200k, 1.8% for AGIs over 200k)
Taxes paid: $15,142 (reported on 53.2% of returns)
11563:
$15,142
State:
$18,656
(% of AGI for various income ranges: 9.3% for AGIs below $25k, 8.4% for AGIs $25k-50k, 9.4% for AGIs $50k-75k, 10.6% for AGIs $75k-100k, 11.7% for AGIs $100k-200k, 11.7% for AGIs over 200k)
Earned income credit: $1,800 (reported on 7.8% of returns)
Here:
$1,800
State:
$2,230
(% of AGI for various income ranges: 3.3% for AGIs below $25k, 0.5% for AGIs $25k-50k)
Percentage of individuals using paid preparers for their 2012 taxes: 72.6%
Here:
73%
State:
66%
(% for various income ranges: 67.6% for AGIs below $25k, 70.1% for AGIs $25k-50k, 73.3% for AGIs $50k-75k, 77.0% for AGIs $75k-100k, 77.5% for AGIs $100k-200k, 78.0% for AGIs over 200k)
Averages for the 2004 tax year for zip code 11563, filed in 2005:
Average Adjusted Gross Income (AGI) in 2004: $59,571 (Individual Income Tax Returns)
Here:
$59,571
State:
$59,519
Salary/wage: $57,954 (reported on 80.7% of returns)
Here:
$57,954
State:
$50,673
(% of AGI for various income ranges: 118.1% for AGIs below $10k, 58.5% for AGIs $10k-25k, 76.8% for AGIs $25k-50k, 79.5% for AGIs $50k-75k, 81.1% for AGIs $75k-100k, 79.1% for AGIs over 100k)
Taxable interest for individuals: $1,538 (reported on 69.6% of returns)
This zip code:
$1,538
New York:
$2,377
(% of AGI for various income ranges: 13.9% for AGIs below $10k, 5.9% for AGIs $10k-25k, 2.2% for AGIs $25k-50k, 1.7% for AGIs $50k-75k, 1.6% for AGIs $75k-100k, 1.2% for AGIs over 100k)
Taxable dividends: $2,327 (reported on 38.6% of returns)
Here:
$2,327
State:
$5,394
(% of AGI for various income ranges: 9.0% for AGIs below $10k, 3.8% for AGIs $10k-25k, 1.6% for AGIs $25k-50k, 1.5% for AGIs $50k-75k, 1.0% for AGIs $75k-100k, 1.3% for AGIs over 100k)
Net capital gain/loss: +$3,836 (reported on 30.0% of returns)
Here:
+$3,836
State:
+$23,581
(% of AGI for various income ranges: -6.2% for AGIs below $10k, 0.1% for AGIs $10k-25k, 0.2% for AGIs $25k-50k, 0.4% for AGIs $50k-75k, 0.7% for AGIs $75k-100k, 3.7% for AGIs over 100k)
Profit/loss from business: +$13,148 (reported on 12.3% of returns)
Here:
+$13,148
State:
+$13,809
(% of AGI for various income ranges: 18.6% for AGIs below $10k, 6.6% for AGIs $10k-25k, 3.7% for AGIs $25k-50k, 2.0% for AGIs $50k-75k, 1.8% for AGIs $75k-100k, 2.3% for AGIs over 100k)
IRA payment deduction: $3,262 (reported on 4.6% of returns)
11563:
$3,262
New York:
$3,115
(% of AGI for various income ranges: 0.7% for AGIs below $10k, 0.4% for AGIs $10k-25k, 0.5% for AGIs $25k-50k, 0.3% for AGIs $50k-75k, 0.3% for AGIs $75k-100k, 0.1% for AGIs over 100k)
Self-employed pension: $11,841 (reported on 1.0% of returns)
Here:
$11,841
New York:
$19,016
(% of AGI for various income ranges: 0.1% for AGIs $25k-50k, 0.1% for AGIs $50k-75k, 0.1% for AGIs $75k-100k, 0.3% for AGIs over 100k)
Total itemized deductions: $22,572 (26% of AGI, reported on 56.4% of returns)
Here:
$22,572
State:
$25,864
Here:
25.9% of AGI
State:
21.9% of AGI
(% of AGI for various income ranges: 27.3% for AGIs below $10k, 25.4% for AGIs $10k-25k, 20.8% for AGIs $25k-50k, 23.7% for AGIs $50k-75k, 23.7% for AGIs $75k-100k, 19.4% for AGIs over 100k)
Charity contributions deductions: $2,741 (3% of AGI, reported on 53.9% of returns)
Here:
$2,741
State:
$4,439
Here:
3.1% of AGI
State:
3.6% of AGI
(% of AGI for various income ranges: 1.6% for AGIs below $10k, 2.3% for AGIs $10k-25k, 2.3% for AGIs $25k-50k, 2.6% for AGIs $50k-75k, 2.7% for AGIs $75k-100k, 2.4% for AGIs over 100k)
Total tax: $8,852 (reported on 80.8% of returns)
11563:
$8,852
State:
$11,730
(% of AGI for various income ranges: 4.2% for AGIs below $10k, 4.1% for AGIs $10k-25k, 7.5% for AGIs $25k-50k, 9.2% for AGIs $50k-75k, 9.8% for AGIs $75k-100k, 15.9% for AGIs over 100k)
Earned income credit: $1,469 (reported on 6.6% of returns)
Here:
$1,469
State:
$1,757
Percentage of individuals using paid preparers for their 2004 taxes: 72.2%
Here:
72%
State:
67%
(% for various income ranges: 64.7% for AGIs below $10k, 72.3% for AGIs $10k-25k, 70.5% for AGIs $25k-50k, 74.6% for AGIs $50k-75k, 76.5% for AGIs $75k-100k, 76.1% for AGIs over 100k)
Household received Food Stamps/SNAP in the past 12 months: 330 Household did not receive Food Stamps/SNAP in the past 12 months: 7,390
Women who had a birth in the past 12 months: 364 (332 now married, 27 unmarried) Women who did not have a birth in the past 12 months: 4,141 (1,818 now married, 2,307 unmarried)
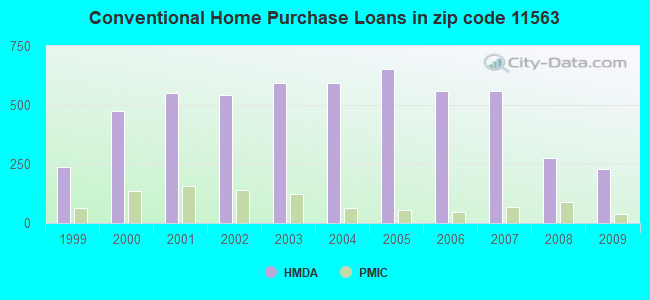
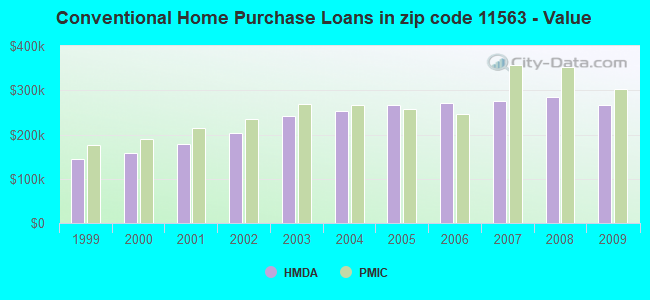
Housing units in zip code 11563 with a mortgage: 3,722 (396 second mortgage, 326 both second mortgage and home equity loan) Houses without a mortgage: 62
Median monthly owner costs for units with a mortgage: $3,597 Median monthly owner costs for units without a mortgage: $1,487
Residents with income below the poverty level in 2022:
This zip code:
6.6%
Whole state:
14.3%
Residents with income below 50% of the poverty level in 2022:
This zip code:
3.8%
Whole state:
6.8%
Median number of rooms in houses and condos:
Here:
6.7
State:
6.3
Median number of rooms in apartments:
Here:
4.0
State:
3.8
Notable locations in this zip code not listed on our city pages
Notable locations in zip code 11563: Lynbrook Station (A), Lynbrook Public Library (B), Vulcan Chemical and Hose Company Engine 2 (C), Tally - Ho Chemical Engine Company 3 (D), Lynbrook Hose Company 1 (E), Lynbrook Engine Company 1 (F), Rescue Hook Ladder and Bucket Company 1 (G), Atria Lynbrook Assisted Living Facility (H), Atria Tanglewood Assisted Living Facility (I), East Rockaway Progressive Care Facility (J), Senior Care at Lynbrook (K), Lynbrook Village Hall (L). Display/hide their locations on the map
Churches in zip code 11563 include: Hendrickson Avenue Bible Church (A), New York Messianic Witness Church (B), Saint Raymond's Church (C), Immanuel Baptist Church (D), Christ Episcopal Church (E), Congregation Beth David (F), Lynbrook Baptist Church (G), Our Lady of Peace Roman Catholic Church (H), Saint James United Methodist Church (I). Display/hide their locations on the map
3,228 married couples with children.
651 single-parent households (86 men, 565 women).
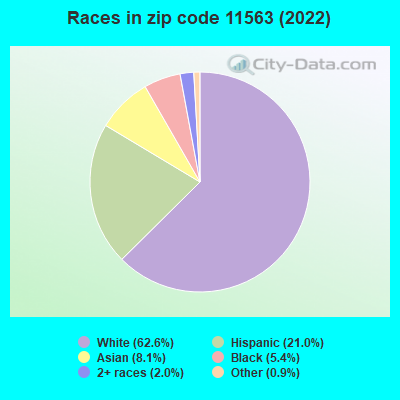
75.7% of residents of 11563 zip code speak English at home.
12.1% of residents speak Spanish at home (75% very well, 11% well, 10% not well, 4% not at all).
8.8% of residents speak other Indo-European language at home (56% very well, 15% well, 15% not well, 14% not at all).
2.2% of residents speak Asian or Pacific Island language at home (74% very well, 17% well, 7% not well, 2% not at all).
1.0% of residents speak other language at home (65% very well, 11% well, 24% not well).
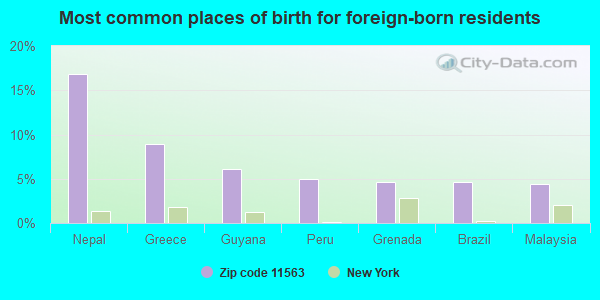
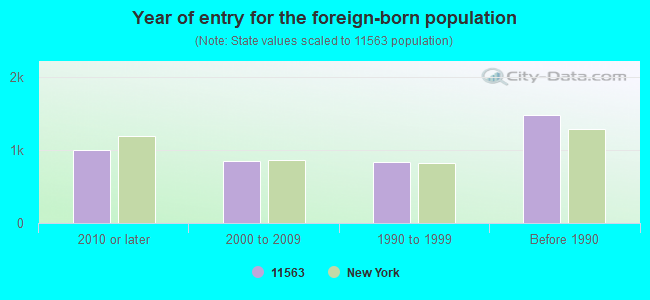
Foreign born population: 3,709 (17.1%) (71.4% of them are naturalized citizens)
Facilities with environmental interests located in this zip code:
ARROW CHEMICAL CORPORATION (151 HORTON AVE. in LYNBROOK, NY)
(Integrated Compliance Information System) - ICIS-02-1992-0038, FORMAL ENFORCEMENT ACTION COMPLIANCE ACTIVITY (Tracking inspections of insecticide, fungicide, and rodenticide, and toxic substances) (Resource Conservation and Recovery Act (tracking hazardous waste)) TRI REPORTER (Tracking of toxic chemicals releasing facilities) Business SIC classification: SPECIALTY CLEANING, POLISHING, AND SANITATION PREPARATIONS
ARROW EXTERMINATING CO INC (289 BROADWAY in LYNBROOK, NY)
(Integrated Compliance Information System) - ICIS-02-1988-0488, FORMAL ENFORCEMENT ACTION Business SIC classification: DISINFECTING AND PEST CONTROL SERVICES
ART KIT COMPANY (64 OCEAN AVENUE in LYNBROOK, NY)
AIR MINOR (AIRS/AFS)
ADVANCE BIOFACTURES CORPORATION (35 WILBUR ST. in LYNBROOK, NY)
Conditionally Exempt Small Quantity Generators, less than 100 kg/month of hazardous waste (Resource Conservation and Recovery Act (tracking hazardous waste)) - notification TRI REPORTER (Tracking of toxic chemicals releasing facilities) Business SIC classification: PHARMACEUTICAL PREPARATIONS
ALFRED PISANI & SON AUTO BODY INC (191 EARLE AVE in LYNBROOK, NY)
(Resource Conservation and Recovery Act (tracking hazardous waste))
AMPROBE INSTRUMENT (630 MERRICK RD in LYNBROOK, NY)
(Resource Conservation and Recovery Act (tracking hazardous waste))
APOGEE MOTORS (228 MERRICK RD in LYNBROOK, NY)
(Resource Conservation and Recovery Act (tracking hazardous waste))
GETTY PETROLEUM CORP (510 SCRANTON AVE in LYNBROOK, NY)
(Resource Conservation and Recovery Act (tracking hazardous waste))
HERMANS GARAGE (274 MERRICK RD in LYNBROOK, NY)
(Resource Conservation and Recovery Act (tracking hazardous waste))
HUB TRUCK RENTAL CORP (170 MERRICK RD in LYNBROOK, NY)
(Resource Conservation and Recovery Act (tracking hazardous waste))
CREST COLLISION CORP (633 MERRICK RD in LYNBROOK, NY)
(Resource Conservation and Recovery Act (tracking hazardous waste))
GENOVESE DRUG STORES #160 (400 SUNRISE HWY in LYNBROOK, NY)
Conditionally Exempt Small Quantity Generators, less than 100 kg/month of hazardous waste (Resource Conservation and Recovery Act (tracking hazardous waste)) - notification Organizations: GENOVESE DRUG STORES INC (CONTACT/OWNER)
Alternative names: GENOVESE DRUG STORES INC #160
GRAPHIC REFLECTIONS LTD (239 MERRICK RD in LYNBROOK, NY)
Conditionally Exempt Small Quantity Generators, less than 100 kg/month of hazardous waste (Resource Conservation and Recovery Act (tracking hazardous waste)) - notification
Housing units lacking complete plumbing facilities: 0.3% Housing units lacking complete kitchen facilities: 4.3%
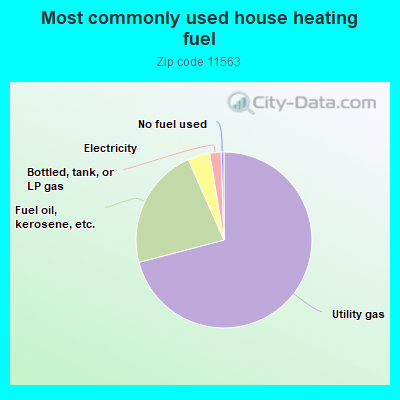
70.7%Utility gas
22.4%Fuel oil, kerosene, etc.
4.0%Electricity
2.1%Bottled, tank, or LP gas
0.5%No fuel used
Population in 1990: 22,659. Population change in the 1990s: +572 (+2.5%).
Place of birth for U.S.-born residents:
This state: 16,412
Northeast: 345
Midwest: 188
South: 302
West: 228
70% of the 11563 zip code residents lived in the same house 5 years ago. Out of people who lived in different houses, 66% lived in this county. Out of people who lived in different counties, 50% lived in New York.
91% of the 11563 zip code residents lived in the same house 1 year ago. Out of people who lived in different houses, 28% moved from this county. Out of people who lived in different houses, 57% moved from different county within same state. Out of people who lived in different houses, 13% moved from different state. Out of people who lived in different houses, 2% moved from abroad.
Private vs. public school enrollment:
Students in private schools in grades 1 to 8 (elementary and middle school): 106
Here:
6.2%
New York:
15.6%
Students in private schools in grades 9 to 12 (high school): 217
Here:
17.7%
New York:
15.0%
Students in private undergraduate colleges: 219
Here:
29.9%
New York:
39.2%
Occupation by median earnings in the past 12 months ($)
203,863Legal occupations
164,597Fire fighting and prevention, and other protective service workers including supervisors
114,208Business and financial operations occupations
107,741Architecture and engineering occupations
107,283Management occupations
103,214Law enforcement workers including supervisors
Companies with federal contracts located in this zip code (LYNBROOK, NY):
SAMUEL LEVINE PLUMBING AND HEA (151 HORTON AVE; small business) : $3,053,786 in 132 contractsfrom 1999 to 2006
Contracts for Valves, Nonpowered, Plumbing Fixtures and Accessories, Lubrication and Fuel Dispensing Equipment, Hose, Pipe, Tube, Lubrication, and Railing Fittings, and moreby Defense Logistics Agency, Federal Supply Service Signed by year:2000: $829,577; 2001: $955,465; 2002: $391,913; 2003: $1,376; 2004: $195,297; 2005: $384,409; 2006: $171,519.
Biggest contracts:
$157,169 with Defense Logistics Agency for Valves, Nonpowered. Signed on 2001-02-21. Completion date: 2002-02-16.
$133,468, same as above.Signed on 2001-10-02. Completion date: 2002-08-03.
$120,109, same as above.Signed on 2000-08-09. Completion date: 2008-01-05.
$109,734 with Defense Logistics Agency for Valves, Nonpowered. Taking place in WI. Signed on 2001-04-06. Completion date: 2002-03-02.
NINETECH INTERNATIONAL INC (522 MERRICK RD; small business) : $3,040,224 in 221 contractsfrom 1999 to 2006
Contracts for Refrigeration and Air Conditioning Components, Electrical and Electronic Properties Measuring and Testing Instruments, Pressure, Temperature, and Humidity Measuring and Controlling Instruments, Packing and Gasket Materials, and moreby Defense Logistics Agency, Navy Signed by year:2000: $283,370; 2001: $746,420; 2002: $255,196; 2003: $114,760; 2004: $511,095; 2005: $622,079; 2006: $290,594.
Biggest contracts:
$64,770 with Defense Logistics Agency for Refrigeration and Air Conditioning Components. Signed on 2001-02-06. Completion date: 2001-02-06.
$59,797 with Defense Logistics Agency for Electrical and Electronic Properties Measuring and Testing Instruments. Signed on 2001-12-21. Completion date: 2002-02-04.
$58,398 with Defense Logistics Agency for Pressure, Temperature, and Humidity Measuring and Controlling Instruments. Signed on 2001-10-19. Completion date: 2002-09-25.
$57,661, same as above.Signed on 2000-04-21. Completion date: 2000-07-20.
LONG ISLAND TECHNICAL INC (626 MERRICK ROAD; small business) : $166,070 in 8 contractsfrom 2002 to 2006
Contracts for Maintenance, Repair and Rebuilding of Equipment -- Office Machines, Text Processing Systems and Visible Record Equipment, ADP Systems Development Services, Automated Information System Design and Integration Services, Other Administrative Support Services by Internal Revenue Service, National Park Service, Army Signed by year:2000: $0; 2001: $0; 2002: $21,000; 2003: $20,670; 2004: $62,000; 2005: $14,400; 2006: $48,000.
Biggest contracts:
$48,000 with Internal Revenue Service for Maintenance, Repair and Rebuilding of Equipment -- Office Machines, Text Processing Systems and Visible Record Equipment. Signed on 2004-12-17. Completion date: 2005-09-30.
$42,000, same as above.Signed on 2003-11-21. Effective on 2003-10-01. Completion date: 2004-09-30.
$34,500, same as above.Signed on 2006-02-01. Effective on 2006-01-27. Completion date: 2006-03-31.
$21,000 with National Park Service for ADP Systems Development Services. Taking place in MI. Signed on 2002-09-15. Completion date: 2003-05-15.
STUDENT MARKETING GROUP INC (777 SUNRISE HWY # 300; small business) : $71,432 in 2 contractsfrom 2000 to 2006
$42,830 with Army for Educational Services. Signed on 2000-12-11. Completion date: 2000-12-11.
$28,602 with Air Force for Miscellaneous Printed Matter. Taking place in MA. Signed on 2006-04-24. Completion date: 2006-04-28.
EPUBLICBIDS, INC (85 ATLANTIC AVE; small business)
$21,000 with Navy for Footwear, Men's. Signed on 2003-12-04. Completion date: 2003-12-15.
MILDRED'S FOR FINE LINENS INC (147 SUNRISE HWY; small business)
$4,341 with Army for Draperies, Awnings, and Shades. Taking place in MA. Signed on 2005-05-27. Completion date: 2005-06-10.
Top industries in this zip code by the number of employees in 2005:
2002 - 2017 National Fire Incident Reporting System (NFIRS) incidents
Based on the data from the years 2002 - 2017 the average number of fire incidents per year is 33. The highest number of reported fires - 77 took place in 2008, and the least - 0 in 2015. The data has a decreasing trend.
When looking into fire subcategories, the most reports belonged to: Structure Fires (53.6%), and Outside Fires (27.3%).
Fire incident types reported to NFIRS in Zip Code 11563


 Nearest zip codes: 11565, 11518, 11557, 11580, 11570, 11552.


 Based on the data from the years 2002 - 2017 the average number of fire incidents per year is 33. The highest number of reported fires - 77 took place in 2008, and the least - 0 in 2015. The data has a decreasing trend.
 When looking into fire subcategories, the most reports belonged to: Structure Fires (53.6%), and Outside Fires (27.3%).