Estimated zip code population in 2022: 27,813 Zip code population in 2010: 26,646 Zip code population in 2000: 27,827
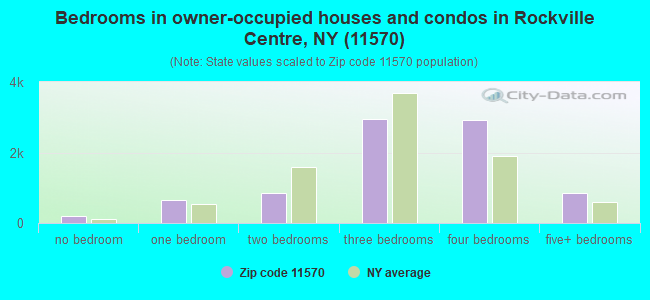
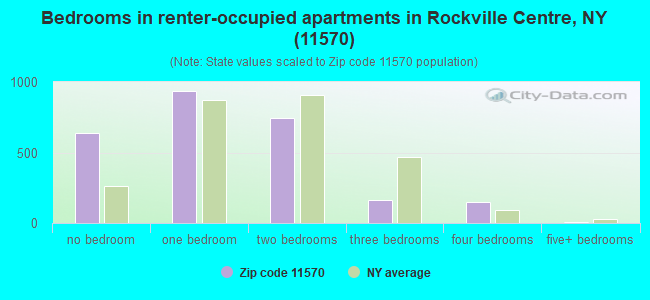
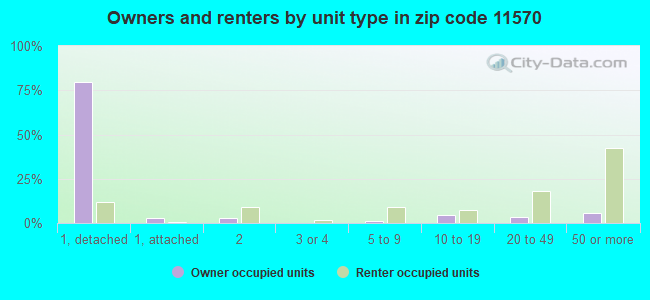
Houses and condos: 11,332 Renter-occupied apartments: 2,589
% of renters here:
23%
State:
46%
March 2022 cost of living index in zip code 11570: 149.2 (very high, U.S. average is 100)
Land area: 3.7 sq. mi. Water area: 0.1 sq. mi.
Population density: 7,565 people per square mile
(high).
OSM Map
General Map
Google Map
MSN Map
OSM Map
General Map
Google Map
MSN Map
OSM Map
General Map
Google Map
MSN Map
OSM Map
General Map
Google Map
MSN Map
Please wait while loading the map...
Real estate property taxes paid for housing units in 2022:
This zip code:
1.2% ($9,805)
New York:
1.5% ($6,180)
Median real estate property taxes paid for housing units with mortgages in 2022: $9,858 (1.2%) Median real estate property taxes paid for housing units with no mortgage in 2022: $9,755 (1.4%)
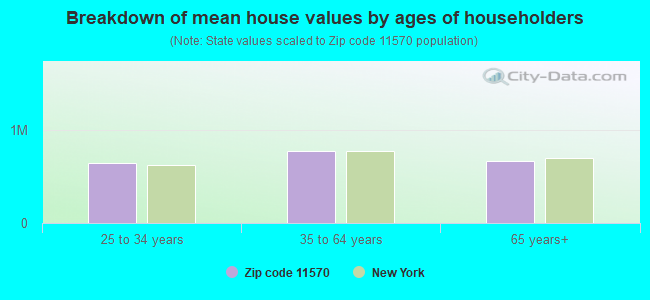
Estimated median house/condo value in 2022: $785,268
11570:
$785,268
New York:
$400,400
According to our research of New York and other state lists, there were 2 registered sex offenders living in 11570 zip code as of April 27, 2024. The ratio of all residents to sex offenders in zip code 11570 is 13,928 to 1. The ratio of registered sex offenders to all residents in this zip code is much lower than the state average.
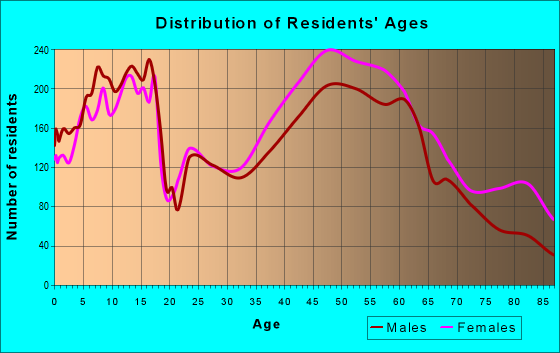
Median resident age:
This zip code:
43.7 years
New York median age:
40.0 years
Average household size:
This zip code:
2.5 people
New York:
2.5 people
Averages for the 2020 tax year for zip code 11570, filed in 2021:
Average Adjusted Gross Income (AGI) in 2020: $168,025 (Individual Income Tax Returns)
Here:
$168,025
State:
$90,930
Salary/wage: $134,858 (reported on 80.2% of returns)
Here:
$134,858
State:
$72,104
(% of AGI for various income ranges: 1114.5% for AGIs below $25k, 3687.3% for AGIs $25k-50k, 6708.6% for AGIs $50k-75k, 10187.1% for AGIs $75k-100k, 18317.9% for AGIs $100k-200k, 108258.4% for AGIs over 200k)
Taxable interest for individuals: $2,557 (reported on 54.6% of returns)
This zip code:
$2,557
New York:
$3,075
(% of AGI for various income ranges: 39.2% for AGIs below $25k, 44.3% for AGIs $25k-50k, 88.1% for AGIs $50k-75k, 142.2% for AGIs $75k-100k, 278.7% for AGIs $100k-200k, 1282.9% for AGIs over 200k)
Ordinary dividends: $9,975 (reported on 42.4% of returns)
Here:
$9,975
State:
$11,095
(% of AGI for various income ranges: 85.8% for AGIs below $25k, 121.0% for AGIs $25k-50k, 235.1% for AGIs $50k-75k, 416.3% for AGIs $75k-100k, 756.6% for AGIs $100k-200k, 4152.4% for AGIs over 200k)
Net capital gain/loss in AGI: +$31,325 (reported on 38.6% of returns)
Here:
+$31,325
State:
+$44,925
(% of AGI for various income ranges: 41.4% for AGIs below $25k, 79.5% for AGIs $25k-50k, 106.7% for AGIs $50k-75k, 325.1% for AGIs $75k-100k, 781.3% for AGIs $100k-200k, 16132.2% for AGIs over 200k)
Profit/loss from business: +$29,454 (reported on 14.7% of returns)
Here:
+$29,454
State:
+$14,940
(% of AGI for various income ranges: 111.3% for AGIs below $25k, 175.7% for AGIs $25k-50k, 184.6% for AGIs $50k-75k, 368.6% for AGIs $75k-100k, 627.9% for AGIs $100k-200k, 4458.7% for AGIs over 200k)
Taxable individual retirement arrangement distribution: $24,821 (reported on 12.0% of returns)
11570:
$24,821
New York:
$19,609
(% of AGI for various income ranges: 73.8% for AGIs below $25k, 130.0% for AGIs $25k-50k, 276.6% for AGIs $50k-75k, 476.9% for AGIs $75k-100k, 1034.2% for AGIs $100k-200k, 1789.7% for AGIs over 200k)
Self-employed (Keogh) retirement plans: $32,953 (reported on 2.2% of returns)
11570:
$32,953
New York:
$32,497
(% of AGI for various income ranges: 13.3% for AGIs $25k-50k, 70.9% for AGIs $100k-200k, 959.2% for AGIs over 200k)
Total itemized deductions: $32,843 (reported on 26.6% of returns)
Here:
$32,843
State:
$39,326
(% of AGI for various income ranges: 156.9% for AGIs below $25k, 309.7% for AGIs $25k-50k, 634.4% for AGIs $50k-75k, 1046.3% for AGIs $75k-100k, 2087.7% for AGIs $100k-200k, 7369.5% for AGIs over 200k)
Charity contributions: $6,684 (reported on 24.2% of returns)
Here:
$6,684
State:
$15,420
(% of AGI for various income ranges: 9.9% for AGIs below $25k, 26.6% for AGIs $25k-50k, 81.2% for AGIs $50k-75k, 135.2% for AGIs $75k-100k, 284.8% for AGIs $100k-200k, 1694.9% for AGIs over 200k)
Taxes paid: $9,474 (reported on 26.4% of returns)
11570:
$9,474
State:
$9,183
(% of AGI for various income ranges: 46.0% for AGIs below $25k, 86.5% for AGIs $25k-50k, 218.7% for AGIs $50k-75k, 367.6% for AGIs $75k-100k, 678.1% for AGIs $100k-200k, 1895.1% for AGIs over 200k)
Earned income credit: $1,719 (reported on 5.8% of returns)
Here:
$1,719
State:
$2,138
(% of AGI for various income ranges: 46.0% for AGIs below $25k, 45.0% for AGIs $25k-50k)
Percentage of individuals using paid preparers for their 2020 taxes: 95.4%
Here:
95%
State:
95%
(% for various income ranges: 93.2% for AGIs below $25k, 96.4% for AGIs $25k-50k, 95.2% for AGIs $50k-75k, 95.7% for AGIs $75k-100k, 95.6% for AGIs $100k-200k, 96.8% for AGIs over 200k)
Averages for the 2012 tax year for zip code 11570, filed in 2013:
Average Adjusted Gross Income (AGI) in 2012: $136,174 (Individual Income Tax Returns)
Here:
$136,174
State:
$77,088
Salary/wage: $110,740 (reported on 80.8% of returns)
Here:
$110,740
State:
$60,593
(% of AGI for various income ranges: 69.4% for AGIs below $25k, 75.0% for AGIs $25k-50k, 71.0% for AGIs $50k-75k, 68.6% for AGIs $75k-100k, 69.7% for AGIs $100k-200k, 62.9% for AGIs over 200k)
Taxable interest for individuals: $3,274 (reported on 58.2% of returns)
This zip code:
$3,274
New York:
$3,125
(% of AGI for various income ranges: 2.5% for AGIs below $25k, 1.3% for AGIs $25k-50k, 1.2% for AGIs $50k-75k, 1.4% for AGIs $75k-100k, 1.0% for AGIs $100k-200k, 1.5% for AGIs over 200k)
Ordinary dividends: $9,723 (reported on 41.6% of returns)
Here:
$9,723
State:
$10,299
(% of AGI for various income ranges: 4.7% for AGIs below $25k, 2.5% for AGIs $25k-50k, 2.6% for AGIs $50k-75k, 2.9% for AGIs $75k-100k, 2.4% for AGIs $100k-200k, 3.2% for AGIs over 200k)
Net capital gain/loss in AGI: +$18,754 (reported on 36.3% of returns)
Here:
+$18,754
State:
+$42,474
(% of AGI for various income ranges: 0.7% for AGIs $50k-75k, 0.3% for AGIs $75k-100k, 1.0% for AGIs $100k-200k, 7.7% for AGIs over 200k)
Profit/loss from business: +$26,420 (reported on 15.1% of returns)
Here:
+$26,420
State:
+$16,168
(% of AGI for various income ranges: 8.6% for AGIs below $25k, 3.0% for AGIs $25k-50k, 2.5% for AGIs $50k-75k, 2.1% for AGIs $75k-100k, 3.5% for AGIs $100k-200k, 2.6% for AGIs over 200k)
Taxable individual retirement arrangement distribution: $23,853 (reported on 14.8% of returns)
11570:
$23,853
New York:
$17,621
(% of AGI for various income ranges: 4.4% for AGIs below $25k, 3.7% for AGIs $25k-50k, 4.2% for AGIs $50k-75k, 4.5% for AGIs $75k-100k, 3.7% for AGIs $100k-200k, 1.8% for AGIs over 200k)
Self-employment retirement plans: $29,115 (reported on 2.8% of returns)
11570:
$29,115
New York:
$27,330
(% of AGI for various income ranges: 0.4% for AGIs $50k-75k, 0.5% for AGIs $100k-200k, 0.8% for AGIs over 200k)
Total itemized deductions: $44,424 (21% of AGI, reported on 58.3% of returns)
Here:
$44,424
State:
$34,985
Here:
20.8% of AGI
State:
21.3% of AGI
(% of AGI for various income ranges: 22.6% for AGIs below $25k, 19.3% for AGIs $25k-50k, 21.4% for AGIs $50k-75k, 22.5% for AGIs $75k-100k, 23.3% for AGIs $100k-200k, 16.9% for AGIs over 200k)
Charity contributions: $4,741 (reported on 54.3% of returns)
Here:
$4,741
State:
$5,572
(% of AGI for various income ranges: 1.2% for AGIs below $25k, 1.6% for AGIs $25k-50k, 2.0% for AGIs $50k-75k, 2.1% for AGIs $75k-100k, 1.9% for AGIs $100k-200k, 1.9% for AGIs over 200k)
Taxes paid: $25,988 (reported on 58.1% of returns)
11570:
$25,988
State:
$18,656
(% of AGI for various income ranges: 8.9% for AGIs below $25k, 7.7% for AGIs $25k-50k, 10.1% for AGIs $50k-75k, 11.0% for AGIs $75k-100k, 12.7% for AGIs $100k-200k, 10.9% for AGIs over 200k)
Earned income credit: $2,010 (reported on 8.0% of returns)
Here:
$2,010
State:
$2,230
(% of AGI for various income ranges: 4.5% for AGIs below $25k, 0.6% for AGIs $25k-50k)
Percentage of individuals using paid preparers for their 2012 taxes: 73.3%
Here:
73%
State:
66%
(% for various income ranges: 68.7% for AGIs below $25k, 67.5% for AGIs $25k-50k, 71.4% for AGIs $50k-75k, 77.5% for AGIs $75k-100k, 78.5% for AGIs $100k-200k, 78.7% for AGIs over 200k)
Averages for the 2004 tax year for zip code 11570, filed in 2005:
Average Adjusted Gross Income (AGI) in 2004: $108,272 (Individual Income Tax Returns)
Here:
$108,272
State:
$59,519
Salary/wage: $93,584 (reported on 78.2% of returns)
Here:
$93,584
State:
$50,673
(% of AGI for various income ranges: 108.4% for AGIs below $10k, 64.4% for AGIs $10k-25k, 75.0% for AGIs $25k-50k, 71.3% for AGIs $50k-75k, 70.6% for AGIs $75k-100k, 66.2% for AGIs over 100k)
Taxable interest for individuals: $3,155 (reported on 69.5% of returns)
This zip code:
$3,155
New York:
$2,377
(% of AGI for various income ranges: 16.6% for AGIs below $10k, 5.0% for AGIs $10k-25k, 2.9% for AGIs $25k-50k, 2.5% for AGIs $50k-75k, 2.6% for AGIs $75k-100k, 1.7% for AGIs over 100k)
Taxable dividends: $5,565 (reported on 49.3% of returns)
Here:
$5,565
State:
$5,394
(% of AGI for various income ranges: 14.9% for AGIs below $10k, 4.9% for AGIs $10k-25k, 3.0% for AGIs $25k-50k, 2.6% for AGIs $50k-75k, 2.4% for AGIs $75k-100k, 2.4% for AGIs over 100k)
Net capital gain/loss: +$16,524 (reported on 42.8% of returns)
Here:
+$16,524
State:
+$23,581
(% of AGI for various income ranges: -7.4% for AGIs below $10k, 0.2% for AGIs $10k-25k, 0.5% for AGIs $25k-50k, 0.2% for AGIs $50k-75k, 1.0% for AGIs $75k-100k, 8.3% for AGIs over 100k)
Profit/loss from business: +$25,976 (reported on 14.6% of returns)
Here:
+$25,976
State:
+$13,809
(% of AGI for various income ranges: 8.2% for AGIs below $10k, 6.0% for AGIs $10k-25k, 3.5% for AGIs $25k-50k, 3.3% for AGIs $50k-75k, 4.1% for AGIs $75k-100k, 3.4% for AGIs over 100k)
IRA payment deduction: $3,595 (reported on 3.8% of returns)
11570:
$3,595
New York:
$3,115
(% of AGI for various income ranges: 0.4% for AGIs below $10k, 0.3% for AGIs $10k-25k, 0.4% for AGIs $25k-50k, 0.3% for AGIs $50k-75k, 0.3% for AGIs $75k-100k, 0.1% for AGIs over 100k)
Self-employed pension: $19,659 (reported on 3.5% of returns)
Here:
$19,659
New York:
$19,016
(% of AGI for various income ranges: 0.6% for AGIs below $10k, 0.2% for AGIs $25k-50k, 0.3% for AGIs $50k-75k, 0.4% for AGIs $75k-100k, 0.8% for AGIs over 100k)
Total itemized deductions: $34,845 (20% of AGI, reported on 58.2% of returns)
Here:
$34,845
State:
$25,864
Here:
20.3% of AGI
State:
21.9% of AGI
(% of AGI for various income ranges: 33.8% for AGIs below $10k, 22.8% for AGIs $10k-25k, 23.3% for AGIs $25k-50k, 24.0% for AGIs $50k-75k, 24.9% for AGIs $75k-100k, 17.1% for AGIs over 100k)
Charity contributions deductions: $5,876 (3% of AGI, reported on 55.9% of returns)
Here:
$5,876
State:
$4,439
Here:
3.3% of AGI
State:
3.6% of AGI
(% of AGI for various income ranges: 1.4% for AGIs below $10k, 1.9% for AGIs $10k-25k, 2.6% for AGIs $25k-50k, 2.9% for AGIs $50k-75k, 3.0% for AGIs $75k-100k, 3.1% for AGIs over 100k)
Total tax: $25,598 (reported on 79.7% of returns)
11570:
$25,598
State:
$11,730
(% of AGI for various income ranges: 3.6% for AGIs below $10k, 4.0% for AGIs $10k-25k, 7.5% for AGIs $25k-50k, 10.1% for AGIs $50k-75k, 10.7% for AGIs $75k-100k, 21.7% for AGIs over 100k)
Earned income credit: $1,694 (reported on 6.7% of returns)
Here:
$1,694
State:
$1,757
Percentage of individuals using paid preparers for their 2004 taxes: 72.5%
Here:
72%
State:
67%
(% for various income ranges: 67.6% for AGIs below $10k, 68.0% for AGIs $10k-25k, 68.4% for AGIs $25k-50k, 74.1% for AGIs $50k-75k, 76.4% for AGIs $75k-100k, 78.6% for AGIs over 100k)
Household received Food Stamps/SNAP in the past 12 months: 395 Household did not receive Food Stamps/SNAP in the past 12 months: 10,491
Women who had a birth in the past 12 months: 287 (283 now married, 0 unmarried) Women who did not have a birth in the past 12 months: 5,498 (2,385 now married, 3,094 unmarried)
Housing units in zip code 11570 with a mortgage: 5,263 (877 second mortgage, 12 home equity loan, 822 both second mortgage and home equity loan) Houses without a mortgage: 174
Median monthly owner costs for units with a mortgage: $3,860 Median monthly owner costs for units without a mortgage: $1,487
Residents with income below the poverty level in 2022:
This zip code:
4.5%
Whole state:
14.3%
Residents with income below 50% of the poverty level in 2022:
This zip code:
1.6%
Whole state:
6.8%
Median number of rooms in houses and condos:
Here:
7.4
State:
6.3
Median number of rooms in apartments:
Here:
3.3
State:
3.8
Notable locations in this zip code not listed on our city pages
Notable locations in zip code 11570: Rockville Centre Station (A), Saint Josephs Villa (B), Kellenberg Hall (C), Quealy Hall (D), Wilbur Arts Center (E), Casey Center (F), Maple Pointe at Rockville Center Assisted Living Facility (G), Rockville Nursing Center (H), Rockville Skilled Nursing and Rehabilitation Center (I), Rockville Centre Public Library (J), Rockville Centre Village Hall (K), Reliance Hose Company Fire House (L), Rockville Fire Department (M). Display/hide their locations on the map
Churches in zip code 11570 include: Central Synagogue of Nassau County (A), Church of God In Christ Jesus (B), Saint Paul's African Methodist Episcopal Church (C), East Rockaway Church of the Nazarene (D), Church of the Ascension (E), First Church of Christ Scientist (F), Iglesia Ni Christo (G), Rockville Centre Seventh Day Adventist Church (H), Saint Agnes Cathedral (I). Display/hide their locations on the map
4,821 married couples with children.
859 single-parent households (423 men, 436 women).
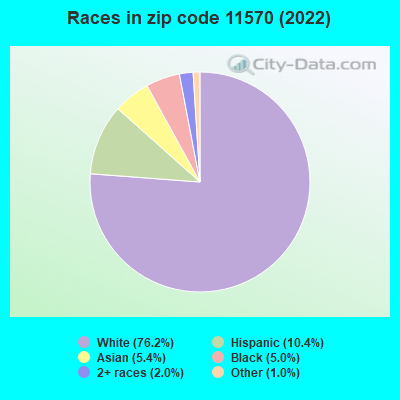
87.4% of residents of 11570 zip code speak English at home.
6.4% of residents speak Spanish at home (59% very well, 27% well, 10% not well, 3% not at all).
3.9% of residents speak other Indo-European language at home (70% very well, 25% well, 4% not well, 2% not at all).
2.0% of residents speak Asian or Pacific Island language at home (88% very well, 4% well, 8% not well).
0.4% of residents speak other language at home (91% very well, 9% well).
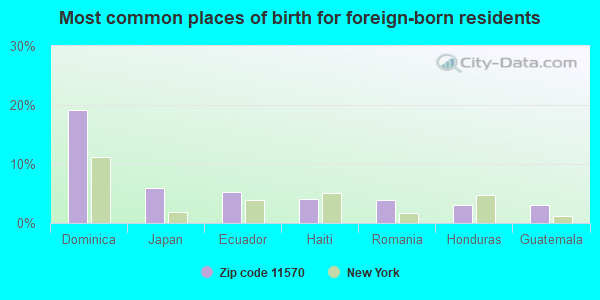
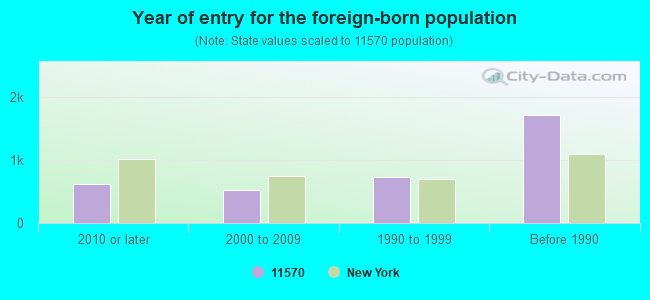
Foreign born population: 3,414 (12.3%) (69.6% of them are naturalized citizens)
Major facilities with environmental interests located in this zip code:
HEWITT SCHOOL ( in ROCKVILLE CENTRE, NY)
(Geographic Names Information System) (National Center for Education Statistics) - STATE ID-280221030005 Organizations: ROCKVILLE CENTRE UFSD (SCHOOL DISTRICT)
AMOCO SERVICE STATION (360 SUNRISE HWY in ROCKVILLE CENTRE, NY)
(Resource Conservation and Recovery Act (tracking hazardous waste)) Organizations: AMOCO OIL CO (CONTACT/OPERATOR)
A & M INSTRUMENT INC (5 NASSAU ST in ROCKVILLE CENTRE, NY)
(Resource Conservation and Recovery Act (tracking hazardous waste))
ABLE FORD SALES INC (700 SUNRISE HWY in ROCKVILLE CENTRE, NY)
(Resource Conservation and Recovery Act (tracking hazardous waste))
ALL ISLAND LEASE-A-CAR INC (652 SUNRISE HWY in ROCKVILLE CENTRE, NY)
(Resource Conservation and Recovery Act (tracking hazardous waste))
GETTY SERVICE STATION 58006 (232 LONG BEACH RD in ROCKVILLE CENTRE, NY)
Conditionally Exempt Small Quantity Generators, less than 100 kg/month of hazardous waste (Resource Conservation and Recovery Act (tracking hazardous waste)) - notification TRANSPORTER (Resource Conservation and Recovery Act (tracking hazardous waste)) - notification Organizations: GETTY PETROLEULM CORP (CONTACT/OWNER)
GRAPHIC FABRICATIONS INC (311 SUNRISE HWY in ROCKVILLE CENTER, NY)
(Resource Conservation and Recovery Act (tracking hazardous waste))
GULF OIL CORP (N VILLAGE AVE in ROCKVILLE CENTRE, NY)
(Resource Conservation and Recovery Act (tracking hazardous waste))
COVERT ELEMENTARY SCHOOL (379 WILLOW ST in ROCKVILLE CENTRE, NY)
(Resource Conservation and Recovery Act (tracking hazardous waste))
ADWAR CASTING (120 S LONG BEACH RD in ROCKVILLE CENTRE, NY)
Conditionally Exempt Small Quantity Generators, less than 100 kg/month of hazardous waste (Resource Conservation and Recovery Act (tracking hazardous waste)) - notification Organizations: ADWAR & SONS (CONTACT/OWNER)
GETTY SERVICE STATION (486 MERRICK RD in ROCKVILLE CENTRE, NY)
Conditionally Exempt Small Quantity Generators, less than 100 kg/month of hazardous waste (Resource Conservation and Recovery Act (tracking hazardous waste)) - notification Organizations: GETTY PETROLEUM (CONTACT/OWNER)
GRAPHIC FABRICATIONS DBA MINUTEMAN PRESS (484 SUNRISE HWY in ROCKVILLE CENTRE, NY)
Small Quantity Generators, between 100 kg and 1000 kg of hazardous waste/month (Resource Conservation and Recovery Act (tracking hazardous waste)) - notification Organizations: GRAPHIC FABRICATIONS INC (CONTACT/OWNER)
APOLLO 1 IMPORT CAR SERVICE, LIMITED (486 MERRICK ROAD in ROCKVILLE CENTRE, NY)
ENFORCEMENT/COMPLIANCE ACTIVITY (Integrated Compliance Information System) Business SIC classification: GASOLINE SERVICE STATIONS
Housing units lacking complete plumbing facilities: 0.5% Housing units lacking complete kitchen facilities: 3.1%
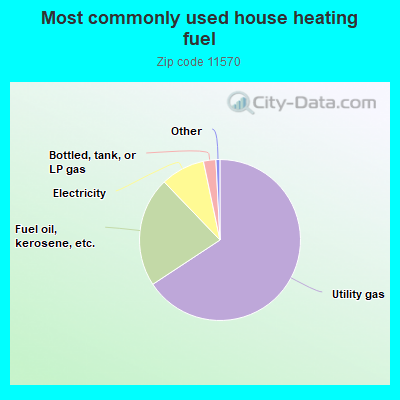
65.8%Utility gas
22.1%Fuel oil, kerosene, etc.
8.9%Electricity
2.5%Bottled, tank, or LP gas
Population in 1990: 27,127. Population change in the 1990s: +700 (+2.6%).
Place of birth for U.S.-born residents:
This state: 22,131
Northeast: 794
Midwest: 324
South: 620
West: 231
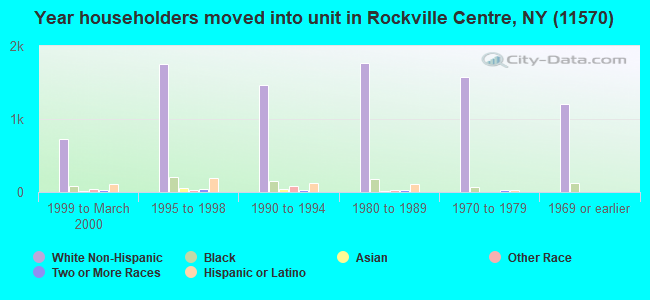
74% of the 11570 zip code residents lived in the same house 5 years ago. Out of people who lived in different houses, 72% lived in this county. Out of people who lived in different counties, 50% lived in New York.
90% of the 11570 zip code residents lived in the same house 1 year ago. Out of people who lived in different houses, 55% moved from this county. Out of people who lived in different houses, 29% moved from different county within same state. Out of people who lived in different houses, 9% moved from different state. Out of people who lived in different houses, 6% moved from abroad.
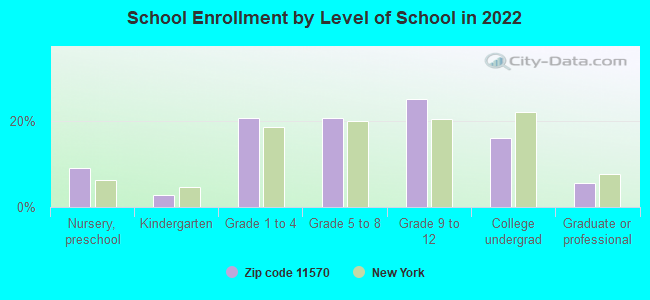
Private vs. public school enrollment:
Students in private schools in grades 1 to 8 (elementary and middle school): 313
Here:
10.7%
New York:
15.6%
Students in private schools in grades 9 to 12 (high school): 422
Here:
23.8%
New York:
15.0%
Students in private undergraduate colleges: 446
Here:
38.9%
New York:
39.2%
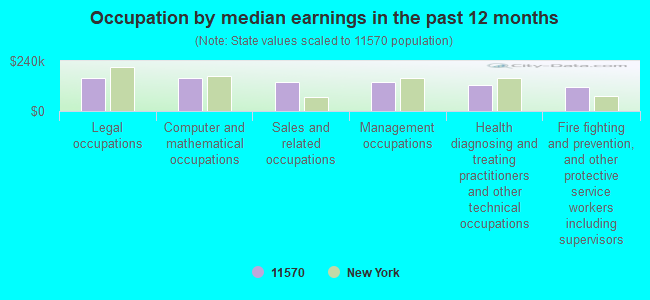
Occupation by median earnings in the past 12 months ($)
159,831Legal occupations
159,722Computer and mathematical occupations
139,567Sales and related occupations
137,026Management occupations
125,923Health diagnosing and treating practitioners and other technical occupations
114,268Fire fighting and prevention, and other protective service workers including supervisors
Companies with federal contracts located in this zip code (ROCKVILLE CENT, NY):
DYNAMIC ADVANTAGE INC (53 N PARK AVE , SUITE:52; small business) : $103,739 in 2 contractsfrom 2003 to 2005
$88,379 with Army for ADP Software. Signed on 2003-09-04. Completion date: 2003-10-06.
$15,360 with Army for Maintenance, Repair and Rebuilding of Equipment -- Automatic Data Processing Equipment (Including Firmware), Software, Supplies and Support Equipment. Taking place in GA. Signed on 2005-09-12. Completion date: 2006-09-12.
JAMES C HERRMANN & ASSOCIATES (365 SUNRISE HIGHWAY STE 22; small business)
$42,839 with Army for Other Environmental Services, Studies, and Analytical Support. Taking place in AL. Signed on 2004-05-02. Completion date: 2005-04-20.
GIDEONS MACHINE CORPORATION (113 FENWAY; small business)
$37,360 with Air Force for Motors, Electrical. Signed on 2002-01-04. Completion date: 2002-07-31.
FITNESS SHOWROOMS OF LONG ISLA (315A SUNRISE HWY; small business)
$4,000 with Army for Miscellaneous Items. Signed on 2005-03-18. Completion date: 2005-09-30.
Top industries in this zip code by the number of employees in 2005:
Health Care and Social Assistance: General Medical and Surgical Hospitals (over 1000 employees: 1 establishment)
Educational Services: Colleges, Universities, and Professional Schools (over 1000: 1)
Health Care and Social Assistance: Offices of Physicians (except Mental Health Specialists) (100-249: 1, 50-99: 3, 20-49: 12, 10-19: 18, 5-9: 30, 1-4: 72)
2002 - 2018 National Fire Incident Reporting System (NFIRS) incidents
Based on the data from the years 2002 - 2018 the average number of fire incidents per year is 23. The highest number of fire incidents - 123 took place in 2007, and the least - 1 in 2003. The data has a growing trend.
When looking into fire subcategories, the most incidents belonged to: Structure Fires (58.7%), and Other (15.9%).
Fire incident types reported to NFIRS in Zip Code 11570
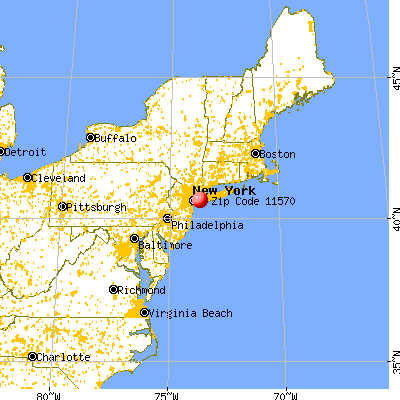


 Nearest zip codes: 11552, 11572, 11565, 11510, 11563, 11550.


 Based on the data from the years 2002 - 2018 the average number of fire incidents per year is 23. The highest number of fire incidents - 123 took place in 2007, and the least - 1 in 2003. The data has a growing trend.
 When looking into fire subcategories, the most incidents belonged to: Structure Fires (58.7%), and Other (15.9%).