Estimated zip code population in 2022: 59,705 Zip code population in 2010: 56,435 Zip code population in 2000: 59,022
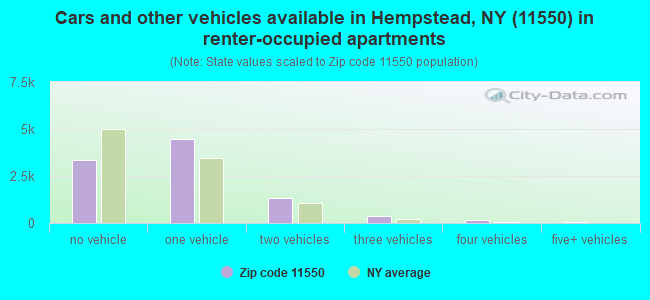
Houses and condos: 19,419 Renter-occupied apartments: 9,730
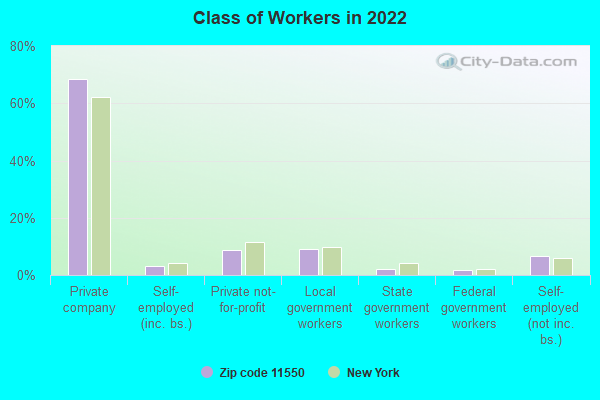
% of renters here:
53%
State:
46%
March 2022 cost of living index in zip code 11550: 149.2 (very high, U.S. average is 100)
Land area: 4.3 sq. mi. Water area: 0.0 sq. mi.
Population density: 14,009 people per square mile
(very high).
OSM Map
General Map
Google Map
MSN Map
OSM Map
General Map
Google Map
MSN Map
OSM Map
General Map
Google Map
MSN Map
OSM Map
General Map
Google Map
MSN Map
Please wait while loading the map...
Real estate property taxes paid for housing units in 2022:
This zip code:
2.2% ($9,805)
New York:
1.5% ($6,180)
Median real estate property taxes paid for housing units with mortgages in 2022: $9,858 (2.2%) Median real estate property taxes paid for housing units with no mortgage in 2022: $9,755 (2.3%)
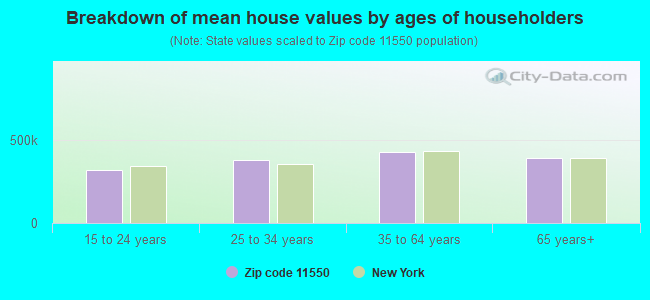
Estimated median house/condo value in 2022: $443,348
11550:
$443,348
New York:
$400,400
According to our research of New York and other state lists, there were 54 registered sex offenders living in 11550 zip code as of April 27, 2024. The ratio of all residents to sex offenders in zip code 11550 is 1,083 to 1. The ratio of registered sex offenders to all residents in this zip code is near the state average.
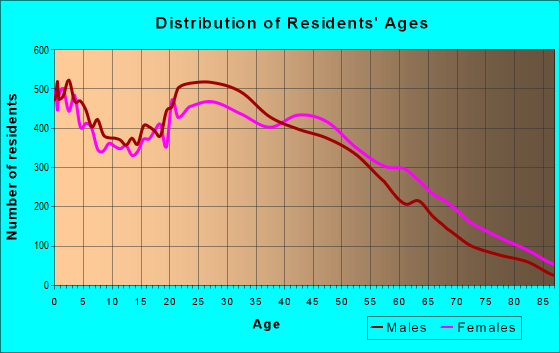
Median resident age:
This zip code:
36.7 years
New York median age:
40.0 years
Average household size:
This zip code:
3.2 people
New York:
2.5 people
Averages for the 2020 tax year for zip code 11550, filed in 2021:
Average Adjusted Gross Income (AGI) in 2020: $44,111 (Individual Income Tax Returns)
Here:
$44,111
State:
$90,930
Salary/wage: $43,110 (reported on 81.1% of returns)
Here:
$43,110
State:
$72,104
(% of AGI for various income ranges: 1240.5% for AGIs below $25k, 3663.6% for AGIs $25k-50k, 6990.1% for AGIs $50k-75k, 10195.8% for AGIs $75k-100k, 17686.5% for AGIs $100k-200k, 68130.7% for AGIs over 200k)
Taxable interest for individuals: $514 (reported on 19.0% of returns)
This zip code:
$514
New York:
$3,075
(% of AGI for various income ranges: 4.3% for AGIs below $25k, 6.9% for AGIs $25k-50k, 13.0% for AGIs $50k-75k, 27.5% for AGIs $75k-100k, 52.8% for AGIs $100k-200k, 440.0% for AGIs over 200k)
Ordinary dividends: $2,689 (reported on 6.0% of returns)
Here:
$2,689
State:
$11,095
(% of AGI for various income ranges: 4.0% for AGIs below $25k, 4.6% for AGIs $25k-50k, 19.4% for AGIs $50k-75k, 38.6% for AGIs $75k-100k, 80.4% for AGIs $100k-200k, 1444.3% for AGIs over 200k)
Net capital gain/loss in AGI: +$6,871 (reported on 5.8% of returns)
Here:
+$6,871
State:
+$44,925
(% of AGI for various income ranges: 1.8% for AGIs below $25k, 6.4% for AGIs $25k-50k, 19.2% for AGIs $50k-75k, 57.8% for AGIs $75k-100k, 187.0% for AGIs $100k-200k, 5503.6% for AGIs over 200k)
Profit/loss from business: +$6,804 (reported on 20.5% of returns)
Here:
+$6,804
State:
+$14,940
(% of AGI for various income ranges: 328.0% for AGIs below $25k, 73.3% for AGIs $25k-50k, 89.2% for AGIs $50k-75k, 132.4% for AGIs $75k-100k, 223.7% for AGIs $100k-200k, 2844.3% for AGIs over 200k)
Taxable individual retirement arrangement distribution: $14,919 (reported on 2.4% of returns)
11550:
$14,919
New York:
$19,609
(% of AGI for various income ranges: 12.4% for AGIs below $25k, 20.4% for AGIs $25k-50k, 47.5% for AGIs $50k-75k, 92.8% for AGIs $75k-100k, 262.1% for AGIs $100k-200k, 1416.4% for AGIs over 200k)
Self-employed (Keogh) retirement plans: $18,350 (reported on 0.1% of returns)
11550:
$18,350
New York:
$32,497
(% of AGI for various income ranges: 11.9% for AGIs $50k-75k)
Total itemized deductions: $25,776 (reported on 10.0% of returns)
Here:
$25,776
State:
$39,326
(% of AGI for various income ranges: 55.0% for AGIs below $25k, 150.9% for AGIs $25k-50k, 522.4% for AGIs $50k-75k, 1031.3% for AGIs $75k-100k, 1785.9% for AGIs $100k-200k, 5721.4% for AGIs over 200k)
Charity contributions: $5,807 (reported on 7.9% of returns)
Here:
$5,807
State:
$15,420
(% of AGI for various income ranges: 3.2% for AGIs below $25k, 16.9% for AGIs $25k-50k, 73.5% for AGIs $50k-75k, 164.5% for AGIs $75k-100k, 405.8% for AGIs $100k-200k, 1565.7% for AGIs over 200k)
Taxes paid: $9,564 (reported on 10.0% of returns)
11550:
$9,564
State:
$9,183
(% of AGI for various income ranges: 22.2% for AGIs below $25k, 61.2% for AGIs $25k-50k, 201.3% for AGIs $50k-75k, 394.2% for AGIs $75k-100k, 630.0% for AGIs $100k-200k, 1660.7% for AGIs over 200k)
Earned income credit: $2,357 (reported on 22.5% of returns)
Here:
$2,357
State:
$2,138
(% of AGI for various income ranges: 135.4% for AGIs below $25k, 75.8% for AGIs $25k-50k, 0.7% for AGIs $50k-75k)
Percentage of individuals using paid preparers for their 2020 taxes: 92.1%
Here:
92%
State:
95%
(% for various income ranges: 87.4% for AGIs below $25k, 96.2% for AGIs $25k-50k, 94.7% for AGIs $50k-75k, 94.1% for AGIs $75k-100k, 94.7% for AGIs $100k-200k, 93.0% for AGIs over 200k)
Averages for the 2012 tax year for zip code 11550, filed in 2013:
Average Adjusted Gross Income (AGI) in 2012: $37,514 (Individual Income Tax Returns)
Here:
$37,514
State:
$77,088
Salary/wage: $37,268 (reported on 83.0% of returns)
Here:
$37,268
State:
$60,593
(% of AGI for various income ranges: 74.7% for AGIs below $25k, 89.3% for AGIs $25k-50k, 85.7% for AGIs $50k-75k, 81.6% for AGIs $75k-100k, 81.2% for AGIs $100k-200k, 75.0% for AGIs over 200k)
Taxable interest for individuals: $695 (reported on 19.1% of returns)
This zip code:
$695
New York:
$3,125
(% of AGI for various income ranges: 0.2% for AGIs below $25k, 0.2% for AGIs $25k-50k, 0.3% for AGIs $50k-75k, 0.3% for AGIs $75k-100k, 0.4% for AGIs $100k-200k, 1.4% for AGIs over 200k)
Ordinary dividends: $3,344 (reported on 6.4% of returns)
Here:
$3,344
State:
$10,299
(% of AGI for various income ranges: 0.3% for AGIs below $25k, 0.1% for AGIs $25k-50k, 0.3% for AGIs $50k-75k, 0.6% for AGIs $75k-100k, 0.5% for AGIs $100k-200k, 3.3% for AGIs over 200k)
Net capital gain/loss in AGI: +$1,174 (reported on 4.3% of returns)
Here:
+$1,174
State:
+$42,474
(% of AGI for various income ranges: 2.0% for AGIs over 200k)
Profit/loss from business: +$7,075 (reported on 19.0% of returns)
Here:
+$7,075
State:
+$16,168
(% of AGI for various income ranges: 16.1% for AGIs below $25k, 1.2% for AGIs $25k-50k, 0.8% for AGIs $50k-75k, 0.7% for AGIs $75k-100k, 1.0% for AGIs $100k-200k, 1.9% for AGIs over 200k)
Taxable individual retirement arrangement distribution: $13,713 (reported on 3.4% of returns)
11550:
$13,713
New York:
$17,621
(% of AGI for various income ranges: 0.6% for AGIs below $25k, 0.8% for AGIs $25k-50k, 1.1% for AGIs $50k-75k, 1.6% for AGIs $75k-100k, 2.0% for AGIs $100k-200k, 1.9% for AGIs over 200k)
Self-employment retirement plans: $16,833 (reported on 0.1% of returns)
11550:
$16,833
New York:
$27,330
Total itemized deductions: $24,238 (32% of AGI, reported on 28.7% of returns)
Here:
$24,238
State:
$34,985
Here:
31.9% of AGI
State:
21.3% of AGI
(% of AGI for various income ranges: 7.7% for AGIs below $25k, 15.3% for AGIs $25k-50k, 22.5% for AGIs $50k-75k, 24.7% for AGIs $75k-100k, 23.4% for AGIs $100k-200k, 19.4% for AGIs over 200k)
Charity contributions: $3,305 (reported on 24.0% of returns)
Here:
$3,305
State:
$5,572
(% of AGI for various income ranges: 0.6% for AGIs below $25k, 1.6% for AGIs $25k-50k, 2.6% for AGIs $50k-75k, 3.1% for AGIs $75k-100k, 2.8% for AGIs $100k-200k, 2.4% for AGIs over 200k)
Taxes paid: $10,591 (reported on 28.7% of returns)
11550:
$10,591
State:
$18,656
(% of AGI for various income ranges: 3.0% for AGIs below $25k, 5.5% for AGIs $25k-50k, 9.4% for AGIs $50k-75k, 11.1% for AGIs $75k-100k, 11.3% for AGIs $100k-200k, 10.8% for AGIs over 200k)
Earned income credit: $2,466 (reported on 30.8% of returns)
Here:
$2,466
State:
$2,230
(% of AGI for various income ranges: 10.0% for AGIs below $25k, 1.4% for AGIs $25k-50k)
Percentage of individuals using paid preparers for their 2012 taxes: 74.5%
Here:
75%
State:
66%
(% for various income ranges: 74.8% for AGIs below $25k, 72.4% for AGIs $25k-50k, 74.3% for AGIs $50k-75k, 76.7% for AGIs $75k-100k, 78.5% for AGIs $100k-200k, 78.3% for AGIs over 200k)
Averages for the 2004 tax year for zip code 11550, filed in 2005:
Average Adjusted Gross Income (AGI) in 2004: $34,505 (Individual Income Tax Returns)
Here:
$34,505
State:
$59,519
Salary/wage: $33,250 (reported on 89.3% of returns)
Here:
$33,250
State:
$50,673
(% of AGI for various income ranges: 78.6% for AGIs below $10k, 87.5% for AGIs $10k-25k, 91.3% for AGIs $25k-50k, 87.2% for AGIs $50k-75k, 84.5% for AGIs $75k-100k, 79.0% for AGIs over 100k)
Taxable interest for individuals: $715 (reported on 30.1% of returns)
This zip code:
$715
New York:
$2,377
(% of AGI for various income ranges: 1.0% for AGIs below $10k, 0.5% for AGIs $10k-25k, 0.4% for AGIs $25k-50k, 0.7% for AGIs $50k-75k, 0.6% for AGIs $75k-100k, 0.9% for AGIs over 100k)
Taxable dividends: $1,601 (reported on 9.8% of returns)
Here:
$1,601
State:
$5,394
(% of AGI for various income ranges: 0.7% for AGIs below $10k, 0.3% for AGIs $10k-25k, 0.2% for AGIs $25k-50k, 0.3% for AGIs $50k-75k, 0.6% for AGIs $75k-100k, 0.9% for AGIs over 100k)
Net capital gain/loss: +$5,098 (reported on 6.4% of returns)
Here:
+$5,098
State:
+$23,581
(% of AGI for various income ranges: -0.6% for AGIs below $10k, -0.1% for AGIs $10k-25k, 0.1% for AGIs $25k-50k, 0.1% for AGIs $50k-75k, 0.2% for AGIs $75k-100k, 4.1% for AGIs over 100k)
Profit/loss from business: +$6,729 (reported on 11.9% of returns)
Here:
+$6,729
State:
+$13,809
(% of AGI for various income ranges: 20.8% for AGIs below $10k, 4.9% for AGIs $10k-25k, 1.0% for AGIs $25k-50k, 1.0% for AGIs $50k-75k, 1.5% for AGIs $75k-100k, 1.1% for AGIs over 100k)
IRA payment deduction: $2,745 (reported on 1.2% of returns)
11550:
$2,745
New York:
$3,115
(% of AGI for various income ranges: 0.1% for AGIs below $10k, 0.1% for AGIs $10k-25k, 0.1% for AGIs $25k-50k, 0.1% for AGIs $50k-75k, 0.1% for AGIs $75k-100k, 0.1% for AGIs over 100k)
Self-employed pension: $12,087 (reported on 0.2% of returns)
Here:
$12,087
New York:
$19,016
Total itemized deductions: $20,852 (35% of AGI, reported on 38.0% of returns)
Here:
$20,852
State:
$25,864
Here:
35.1% of AGI
State:
21.9% of AGI
(% of AGI for various income ranges: 9.8% for AGIs below $10k, 16.7% for AGIs $10k-25k, 24.4% for AGIs $25k-50k, 28.4% for AGIs $50k-75k, 27.5% for AGIs $75k-100k, 20.1% for AGIs over 100k)
Charity contributions deductions: $3,179 (5% of AGI, reported on 33.9% of returns)
Here:
$3,179
State:
$4,439
Here:
5.1% of AGI
State:
3.6% of AGI
(% of AGI for various income ranges: 0.4% for AGIs below $10k, 1.8% for AGIs $10k-25k, 3.3% for AGIs $25k-50k, 3.9% for AGIs $50k-75k, 4.0% for AGIs $75k-100k, 3.1% for AGIs over 100k)
Total tax: $4,500 (reported on 64.4% of returns)
11550:
$4,500
State:
$11,730
(% of AGI for various income ranges: 3.6% for AGIs below $10k, 2.8% for AGIs $10k-25k, 5.0% for AGIs $25k-50k, 8.0% for AGIs $50k-75k, 9.8% for AGIs $75k-100k, 17.0% for AGIs over 100k)
Earned income credit: $1,792 (reported on 30.7% of returns)
Here:
$1,792
State:
$1,757
Percentage of individuals using paid preparers for their 2004 taxes: 73.8%
Here:
74%
State:
67%
(% for various income ranges: 71.0% for AGIs below $10k, 75.6% for AGIs $10k-25k, 73.1% for AGIs $25k-50k, 73.3% for AGIs $50k-75k, 76.7% for AGIs $75k-100k, 76.3% for AGIs over 100k)
Likely homosexual households (counted as self-reported same-sex unmarried-partner households)
Lesbian couples: 0.1% of all households
Gay men: 0.1% of all households
Household received Food Stamps/SNAP in the past 12 months: 3,973 Household did not receive Food Stamps/SNAP in the past 12 months: 14,322
Women who had a birth in the past 12 months: 655 (253 now married, 413 unmarried) Women who did not have a birth in the past 12 months: 14,636 (4,263 now married, 10,424 unmarried)
Housing units in zip code 11550 with a mortgage: 6,242 (447 second mortgage, 12 home equity loan, 238 both second mortgage and home equity loan) Houses without a mortgage: 109
Median monthly owner costs for units with a mortgage: $3,117 Median monthly owner costs for units without a mortgage: $1,446
Residents with income below the poverty level in 2022:
This zip code:
15.9%
Whole state:
14.3%
Residents with income below 50% of the poverty level in 2022:
This zip code:
9.6%
Whole state:
6.8%
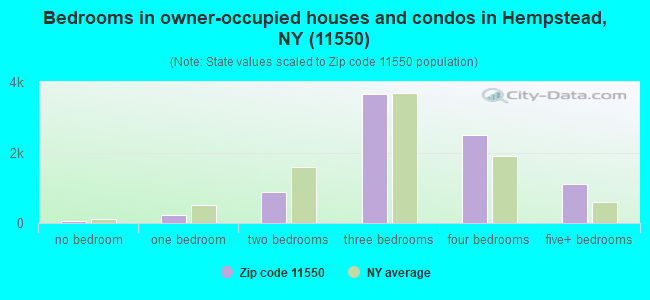
Median number of rooms in houses and condos:
Here:
6.5
State:
6.3
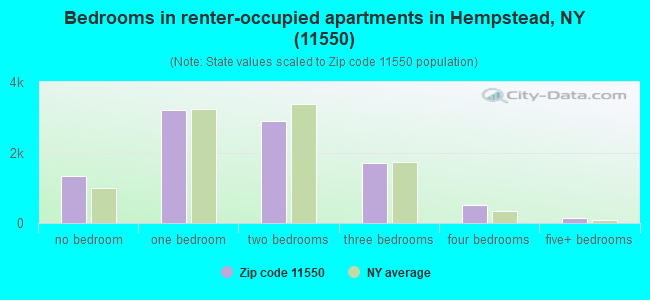
Median number of rooms in apartments:
Here:
4.0
State:
3.8
Notable locations in this zip code not listed on our city pages
Notable locations in zip code 11550: Hempstead Country Club (A), Rockville Country Club (B), Hempstead Station (C), Adams Hall (D), Adams Playhouse (E), Axinn Hall (F), Barnard Hall (G), Bernon Hall (H), Breslin Hall (I), Brower Hall (J), Calkins Hall (K), Davison Hall (L), Dempster Hall (M), Heger Hall (N), Hofstra Hall (O), Houser Hall (P), Jane Street House (Q), Kushner Hall (R), Lowe Hall (S), Mason Hall (T). Display/hide their locations on the map
Churches in zip code 11550 include: South Hempstead Congregational Church (A), All Nations Apostolic Tabernacle Church (B), All Saints Temple Church of God (C), Bible Vision Church of God (D), God's Miracle Temple (E), Hempstead Church of God of Prophecy (F), Hempstead Hispanic Methodist Church (G), Hempstead Pentecostal Church (H), Hempstead Seventh Day Adventist Church (I). Display/hide their locations on the map
4,367 married couples with children.
5,555 single-parent households (954 men, 4,601 women).
52.7% of residents of 11550 zip code speak English at home.
39.4% of residents speak Spanish at home (37% very well, 20% well, 30% not well, 13% not at all).
6.3% of residents speak other Indo-European language at home (54% very well, 25% well, 16% not well, 5% not at all).
0.5% of residents speak Asian or Pacific Island language at home (57% very well, 23% well, 19% not well, 1% not at all).
0.8% of residents speak other language at home (71% very well, 26% well, 3% not well).
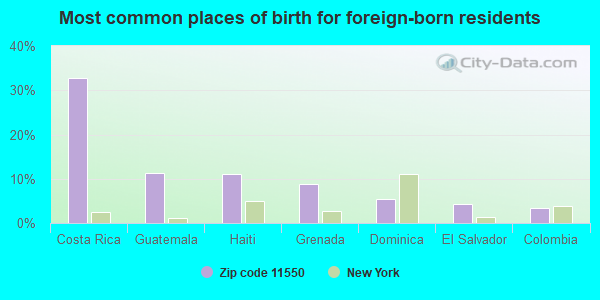
Foreign born population: 22,424 (37.6%) (45.4% of them are naturalized citizens)
This zip code:
37.6%
Whole state:
22.7%
33%Costa Rica
11%Guatemala
11%Haiti
9%Grenada
6%Dominica
4%El Salvador
3%Colombia
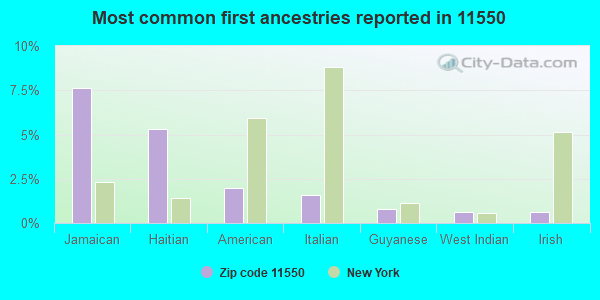
8%Jamaican
5%Haitian
2%American
2%Italian
1%Guyanese
1%West Indian
1%Irish
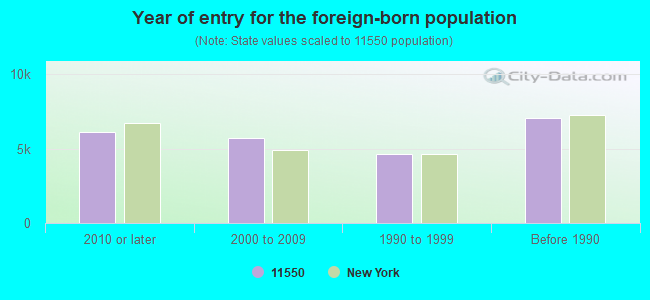
Year of entry for the foreign-born population
6,1262010 or later
5,7482000 to 2009
4,6491990 to 1999
7,034Before 1990
Major facilities with environmental interests located in this zip code:
INTERNATIONAL LEATHER CARE CORPORATION (393 SOUTH FRANKLIN STREET in HEMPSTEAD, NY)
AIR MINOR (AIRS/AFS) STATE MASTER (New York facility tracking) - AIR PROGRAM Conditionally Exempt Small Quantity Generators, less than 100 kg/month of hazardous waste (Resource Conservation and Recovery Act (tracking hazardous waste)) Business SIC classification: DRYCLEANING PLANTS, EXCEPT RUG CLEANING Business NAICS classification: DRYCLEANING AND LAUNDRY SERVICES (EXCEPT COIN-OPERATED). Organizations: ILCC CORP (AIR PERMITTING FACILITY OWNER CONTACT)
, YAE-HAN KIM (CONTACT/OWNER)
, ILCC CORP (LEGALLY RESPONSIBLE PARTY)
Alternative names: ILCC CORP
HEMPSTEAD TOP NOTCH CLEANERS (378 FULTON AVE in HEMPSTEAD, NY)
AIR MINOR (AIRS/AFS) STATE MASTER (New York facility tracking) - AIR PROGRAM Small Quantity Generators, between 100 kg and 1000 kg of hazardous waste/month (Resource Conservation and Recovery Act (tracking hazardous waste)) - notification Business SIC classification: DRYCLEANING PLANTS, EXCEPT RUG CLEANING Business NAICS classification: DRYCLEANING AND LAUNDRY SERVICES (EXCEPT COIN-OPERATED). Organizations: TAI PARK YOUNG (CONTACT/OWNER)
CLEVELAND CLEANERS (514 FULTON AVENUE in HEMPSTEAD, NY)
AIR MINOR (AIRS/AFS) STATE MASTER (New York facility tracking) - AIR PROGRAM, HAZARDOUS WASTE PROGRAM Small Quantity Generators, between 100 kg and 1000 kg of hazardous waste/month (Resource Conservation and Recovery Act (tracking hazardous waste)) - notification Business SIC classification: DRYCLEANING PLANTS, EXCEPT RUG CLEANING Business NAICS classification: DRYCLEANING AND LAUNDRY SERVICES (EXCEPT COIN-OPERATED). Organizations: YAM CLEVELAND CORP (CONTACT/OWNER)
HEMPSTEAD SCHOOL DIST (185 PENINSULA BLVD in HEMPSTEAD, NY)
(Integrated Compliance Information System) - ICIS-02-1987-0429, FORMAL ENFORCEMENT ACTION COMPLIANCE ACTIVITY (Tracking inspections of insecticide, fungicide, and rodenticide, and toxic substances) (Resource Conservation and Recovery Act (tracking hazardous waste)) Business SIC classification: ELEMENTARY AND SECONDARY SCHOOLS Alternative names: HEMPSTEAD UF SCHOOL DISTRICT, HEMPSTEAD UNION FREE SCHOOL DIST
HOFSTRA UNIVERSITY (1000 FULTON AVE in HEMPSTEAD, NY)
AIR MAJOR (AIRS/AFS) STATE MASTER (New York facility tracking) - AIR MAJOR, HAZARDOUS WASTE PROGRAM CRITERIA AND HAZARDOUS AIR POLLUTANT INVENTORY (Inventory of air pollution sources) Business SIC classification: ELEMENTARY AND SECONDARY SCHOOLS; COLLEGES, UNIVERSITIES, AND PROFESSIONAL SCHOOLS Business NAICS classification: COLLEGES, UNIVERSITIES, AND PROFESSIONAL SCHOOLS. Organizations: AIR RESOURCES GROUP LLC (FACILITY APPLICATION CONTACT)
HEMPSTEAD DIST COURT (99 MAIN ST in HEMPSTEAD, NY)
STATE MASTER (New York facility tracking) - AIR PROGRAM Conditionally Exempt Small Quantity Generators, less than 100 kg/month of hazardous waste (Resource Conservation and Recovery Act (tracking hazardous waste)) - notification Business SIC classification: ELECTRIC SERVICES; GENERAL GOVERNMENT Organizations: LONG ISLAND POWER AUTHORITY (AIR FEE BILLING CONTACT)
, COUNTY OF NASSAU (CONTACT/OWNER)
, NASSAU COUNTY (LEGALLY RESPONSIBLE PARTY)
Alternative names: NASSAU COUNTY DPW HEMPSTEAD DIST COURT
ADT 72 (35 JERUSALEM AVENUE in HEMPSTEAD, NY)
(Integrated Compliance Information System) - ICIS-HQ-2002-6000, FORMAL ENFORCEMENT ACTION (Resource Conservation and Recovery Act (tracking hazardous waste)) Alternative names: WELLS FARGO ALARM SERVICES
HOFSTRA UNIVERSITY (GROUNDS DEPT HOFSTRA UNIVERSIT in HEMPSTEAD, NY)
(Integrated Compliance Information System) - ICIS-02-1987-0418, FORMAL ENFORCEMENT ACTION Small Quantity Generators, between 100 kg and 1000 kg of hazardous waste/month (Resource Conservation and Recovery Act (tracking hazardous waste)) - notification Organizations: OWNERNAME (CONTACT/OWNER)
ALVERTA B. GRAY SCHULTZ MS ( in HEMPSTEAD, NY)
(National Center for Education Statistics) - STATE ID-280201030010 Organizations: HEMPSTEAD UFSD (SCHOOL DISTRICT)
HEMPSTEAD HS ( in HEMPSTEAD, NY)
(National Center for Education Statistics) - STATE ID-280201030007 Organizations: HEMPSTEAD UFSD (SCHOOL DISTRICT)
HEMPSTEAD EARLY CHLDHD CTR ( in HEMPSTEAD, NY)
(National Center for Education Statistics) - STATE ID-280201030011 Organizations: HEMPSTEAD UFSD (SCHOOL DISTRICT)
HOFSTRA UNIVERSITY (MAIN ST in HEMPSTEAD, NY)
(Tracking inspections of insecticide, fungicide, and rodenticide, and toxic substances) - ICIS-02-2004-0814, FORMAL ENFORCEMENT ACTION, ICIS-, ENFORCEMENT/COMPLIANCE ACTIVITY COMPLIANCE ACTIVITY (Tracking inspections of insecticide, fungicide, and rodenticide, and toxic substances)
257 MAIN STREET (257 MAIN ST in HEMPSTEAD, NY)
(Integrated Compliance Information System) - ICIS-02-2001-0013, FORMAL ENFORCEMENT ACTION Business SIC classification: AUTOMOTIVE TRANSMISSION REPAIR SHOPS; GENERAL AUTOMOTIVE REPAIR SHOPS
Housing units lacking complete plumbing facilities: 0.8% Housing units lacking complete kitchen facilities: 1.0%
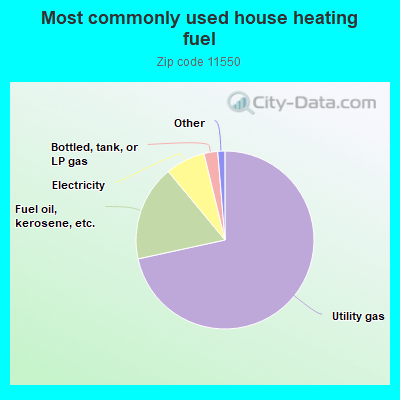
71.6%Utility gas
17.4%Fuel oil, kerosene, etc.
7.2%Electricity
2.5%Bottled, tank, or LP gas
0.6%No fuel used
0.6%Other fuel
Population in 1990: 50,933. Population change in the 1990s: +8,089 (+15.9%).
Place of birth for U.S.-born residents:
This state: 32,637
Northeast: 308
Midwest: 252
South: 2,479
West: 336
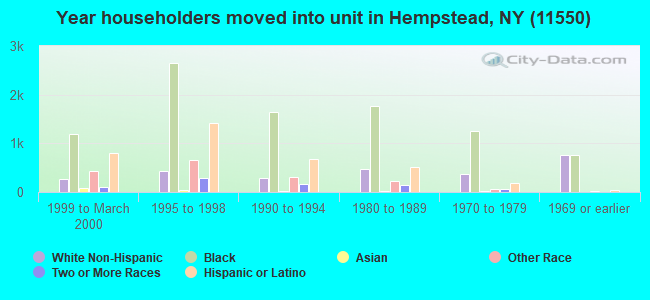
60% of the 11550 zip code residents lived in the same house 5 years ago. Out of people who lived in different houses, 62% lived in this county. Out of people who lived in different counties, 50% lived in New York.
91% of the 11550 zip code residents lived in the same house 1 year ago. Out of people who lived in different houses, 49% moved from this county. Out of people who lived in different houses, 38% moved from different county within same state. Out of people who lived in different houses, 7% moved from different state. Out of people who lived in different houses, 7% moved from abroad.
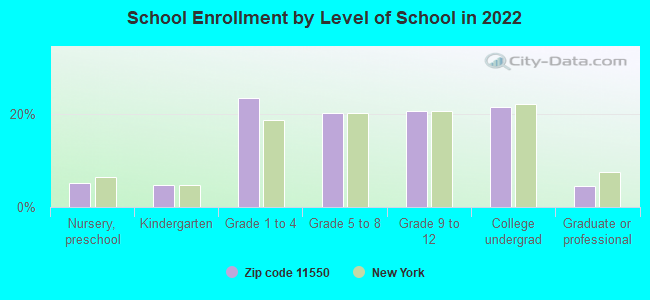
Private vs. public school enrollment:
Students in private schools in grades 1 to 8 (elementary and middle school): 384
Here:
6.3%
New York:
15.6%
Students in private schools in grades 9 to 12 (high school): 403
Here:
13.9%
New York:
15.0%
Students in private undergraduate colleges: 679
Here:
22.8%
New York:
39.2%
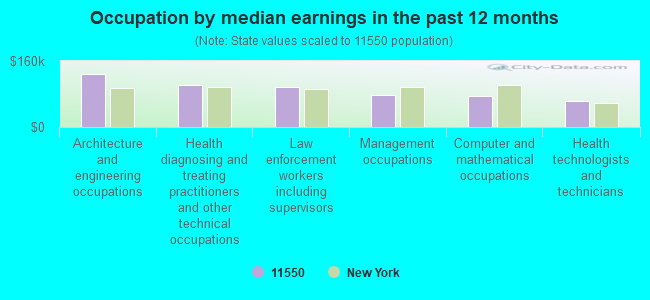
Occupation by median earnings in the past 12 months ($)
128,307Architecture and engineering occupations
101,488Health diagnosing and treating practitioners and other technical occupations
96,682Law enforcement workers including supervisors
76,514Management occupations
74,884Computer and mathematical occupations
63,726Health technologists and technicians
Companies with federal contracts located in this zip code (HEMPSTEAD, NY):
ALFA MEDICAL EQUIPMENT SPECIAL (59 MADISON AVENUE; small business) : $461,407 in 20 contractsfrom 2001 to 2006
Contracts for Hospital Furniture, Equipment, Utensils, and Supplies, Laboratory Equipment and Supplies, Medical and Surgical Instruments, Equipment, and Supplies, Combination and Miscellaneous Instruments, and moreby Army, Geological Survey, Animal and Plant Health Inspection Service (disused code), Agricultural Research Service, and others Signed by year:2000: $0; 2001: $54,300; 2002: $155,300; 2003: $95,508; 2004: $78,278; 2005: $48,892; 2006: $29,129.
Biggest contracts:
$45,472 with Army for Hospital Furniture, Equipment, Utensils, and Supplies. Taking place in DC. Signed on 2003-09-30. Completion date: 2003-08-21.
$45,472, same as above.Signed on 2003-09-30. Completion date: 2003-08-21.
$44,000 with Geological Survey for Laboratory Equipment and Supplies. Taking place in OH. Signed on 2002-04-15. Completion date: 2002-09-15.
$43,700 with Army for Medical and Surgical Instruments, Equipment, and Supplies. Signed on 2005-08-28. Completion date: 2005-09-12.
ZETA MACHINE CORP (268 N FRANKLIN ST; small business)
$161,700 with Army for Radar Equipment, Except Airborne. Signed on 2005-05-18. Completion date: 2005-08-31.
UPSCALE CLEANING SERVICE INC (254 BENNETT AVE; small business) : $23,384 in 2 contractsfrom 2005 to 2006
$20,500 with Army for Facilities Operations Support Services. Taking place in NJ. Signed on 2006-02-28. Completion date: 2007-02-28.
$2,884 with Department of State for Services -- Advanced Development (R&D). Signed on 2005-09-29. Completion date: 2005-12-01.
RADIANCE ELECTRONICS LLC (250 FULTON AVE; small business)
$9,078 with Air Force for ADP Input/Output and Storage Devices. Signed on 2005-05-19. Completion date: 2005-06-13.
NORTH SOUTH MACHINE SHOP INC (83 WHITSON ST; small business) : -$27,910 in 4 contractsfrom 2003 to 2005
$28,110 with Defense Logistics Agency for Guns, through 30 mm. Signed on 2003-11-04. Completion date: 2004-05-21.
$2,500 with Air Force for Parachutes; Aerial Pick Up, Delivery, Recovery Systems; and Cargo Tie Down Equipment. Taking place in AL. Signed on 2005-02-01. Completion date: 2005-02-02.
-$27,145 with Defense Logistics Agency for Airframe Structural Components. Signed on 2004-10-26. Completion date: 2004-10-26.
-$31,375, same as above.Signed on 2004-10-26. Completion date: 2004-10-26.
Top industries in this zip code by the number of employees in 2005:
Health Care and Social Assistance: Other Individual and Family Services (250-499 employees: 1 establishment, 100-249 employees: 1 establishment, 50-99 employees: 4 establishments, 20-49 employees: 2 establishments, 10-19 employees: 5 establishments, 5-9 employees: 7 establishments, 1-4 employees: 13 establishments)
Health Care and Social Assistance: Home Health Care Services (250-499: 1, 100-249: 3, 20-49: 1, 10-19: 1, 5-9: 1, 1-4: 2)
Other Services (except Public Administration): Linen Supply (500-999: 1)
Health Care and Social Assistance: Nursing Care Facilities (250-499: 1, 100-249: 2)
2002 - 2018 National Fire Incident Reporting System (NFIRS) incidents
Based on the data from the years 2002 - 2018 the average number of fire incidents per year is 132. The highest number of reported fires - 258 took place in 2016, and the least - 2 in 2003. The data has an increasing trend.
When looking into fire subcategories, the most reports belonged to: Structure Fires (63.3%), and Outside Fires (18.0%).
Fire incident types reported to NFIRS in Zip Code 11550


 Nearest zip codes: 11549, 11553, 11530, 11552, 11570, 11556.
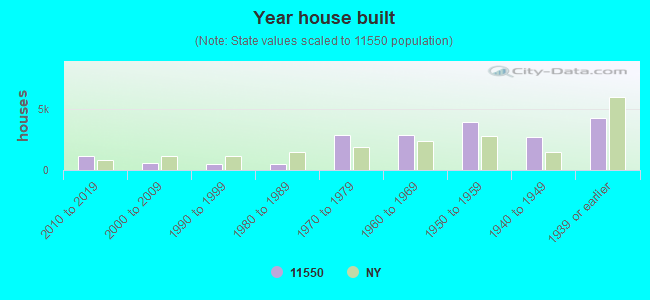


 Based on the data from the years 2002 - 2018 the average number of fire incidents per year is 132. The highest number of reported fires - 258 took place in 2016, and the least - 2 in 2003. The data has an increasing trend.
 When looking into fire subcategories, the most reports belonged to: Structure Fires (63.3%), and Outside Fires (18.0%).