Estimated zip code population in 2022: 27,443 Zip code population in 2010: 26,034 Zip code population in 2000: 23,452
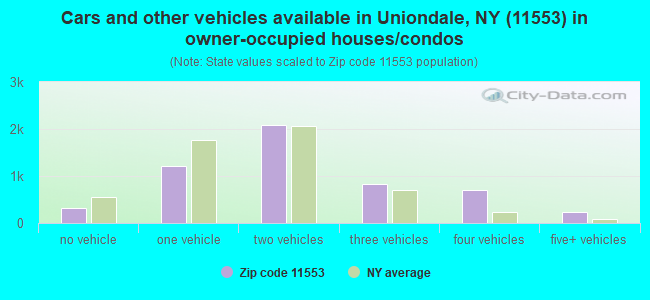
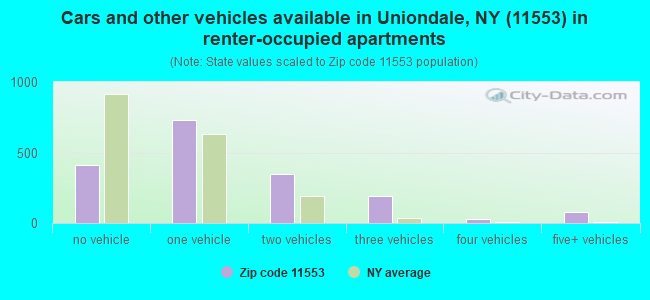
Houses and condos: 7,476 Renter-occupied apartments: 1,801
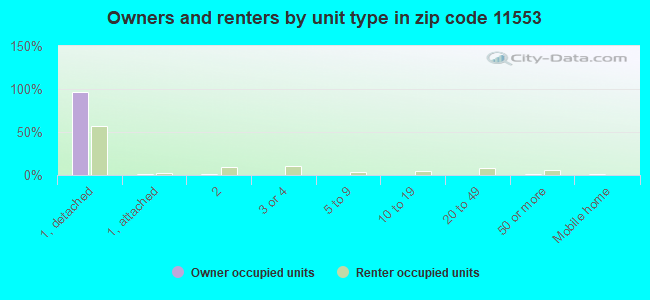
% of renters here:
25%
State:
46%
March 2022 cost of living index in zip code 11553: 149.3 (very high, U.S. average is 100)
Land area: 3.5 sq. mi. Water area: 0.0 sq. mi.
Population density: 7,836 people per square mile
(high).
OSM Map
General Map
Google Map
MSN Map
OSM Map
General Map
Google Map
MSN Map
OSM Map
General Map
Google Map
MSN Map
OSM Map
General Map
Google Map
MSN Map
Please wait while loading the map...
Real estate property taxes paid for housing units in 2022:
This zip code:
1.5% ($7,199)
New York:
1.5% ($6,180)
Median real estate property taxes paid for housing units with mortgages in 2022: $7,399 (1.5%) Median real estate property taxes paid for housing units with no mortgage in 2022: $6,381 (1.5%)
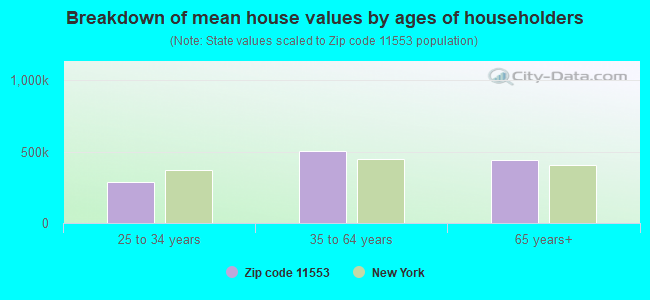
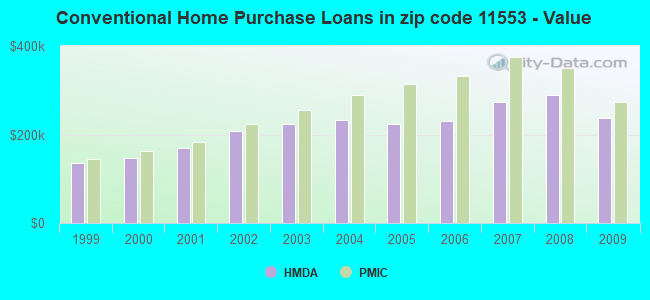
Estimated median house/condo value in 2022: $467,012
11553:
$467,012
New York:
$400,400
According to our research of New York and other state lists, there were 13 registered sex offenders living in 11553 zip code as of April 27, 2024. The ratio of all residents to sex offenders in zip code 11553 is 2,041 to 1. The ratio of registered sex offenders to all residents in this zip code is lower than the state average.
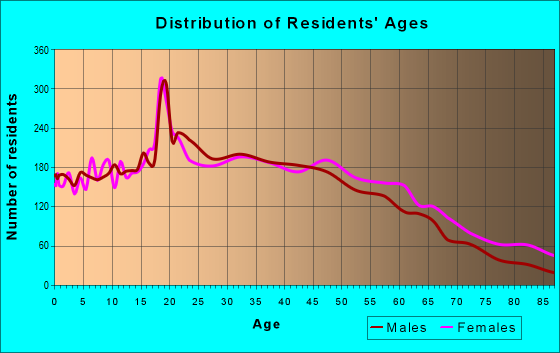
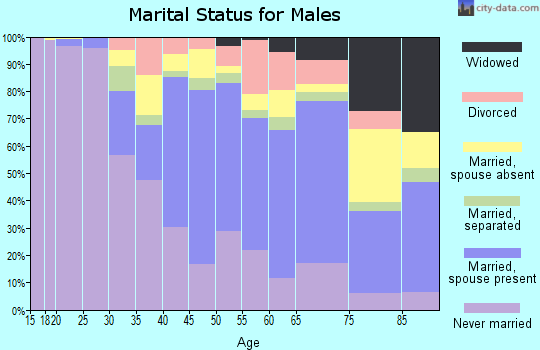
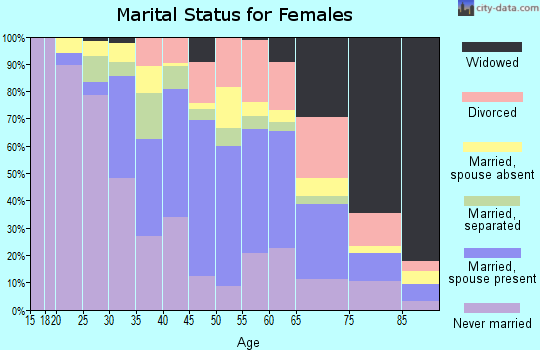
Median resident age:
This zip code:
36.2 years
New York median age:
40.0 years
Average household size:
This zip code:
3.6 people
New York:
2.5 people
Averages for the 2020 tax year for zip code 11553, filed in 2021:
Average Adjusted Gross Income (AGI) in 2020: $45,401 (Individual Income Tax Returns)
Here:
$45,401
State:
$90,930
Salary/wage: $43,510 (reported on 82.4% of returns)
Here:
$43,510
State:
$72,104
(% of AGI for various income ranges: 1251.2% for AGIs below $25k, 3724.0% for AGIs $25k-50k, 6831.0% for AGIs $50k-75k, 10176.0% for AGIs $75k-100k, 17407.7% for AGIs $100k-200k, 61020.0% for AGIs over 200k)
Taxable interest for individuals: $465 (reported on 22.3% of returns)
This zip code:
$465
New York:
$3,075
(% of AGI for various income ranges: 6.1% for AGIs below $25k, 6.9% for AGIs $25k-50k, 10.3% for AGIs $50k-75k, 34.2% for AGIs $75k-100k, 48.6% for AGIs $100k-200k, 562.0% for AGIs over 200k)
Ordinary dividends: $2,316 (reported on 6.6% of returns)
Here:
$2,316
State:
$11,095
(% of AGI for various income ranges: 6.2% for AGIs below $25k, 6.8% for AGIs $25k-50k, 15.1% for AGIs $50k-75k, 29.2% for AGIs $75k-100k, 90.6% for AGIs $100k-200k, 1396.0% for AGIs over 200k)
Net capital gain/loss in AGI: +$4,316 (reported on 6.4% of returns)
Here:
+$4,316
State:
+$44,925
(% of AGI for various income ranges: 0.6% for AGIs below $25k, 0.6% for AGIs $25k-50k, 13.3% for AGIs $50k-75k, 37.1% for AGIs $75k-100k, 127.0% for AGIs $100k-200k, 5472.0% for AGIs over 200k)
Profit/loss from business: +$6,296 (reported on 19.4% of returns)
Here:
+$6,296
State:
+$14,940
(% of AGI for various income ranges: 299.0% for AGIs below $25k, 103.2% for AGIs $25k-50k, 66.0% for AGIs $50k-75k, 80.9% for AGIs $75k-100k, 101.4% for AGIs $100k-200k, 2454.0% for AGIs over 200k)
Taxable individual retirement arrangement distribution: $13,979 (reported on 3.0% of returns)
11553:
$13,979
New York:
$19,609
(% of AGI for various income ranges: 11.7% for AGIs below $25k, 24.9% for AGIs $25k-50k, 47.3% for AGIs $50k-75k, 119.7% for AGIs $75k-100k, 315.6% for AGIs $100k-200k, 1778.0% for AGIs over 200k)
Total itemized deductions: $26,104 (reported on 12.1% of returns)
Here:
$26,104
State:
$39,326
(% of AGI for various income ranges: 61.4% for AGIs below $25k, 224.7% for AGIs $25k-50k, 585.9% for AGIs $50k-75k, 1049.4% for AGIs $75k-100k, 1988.1% for AGIs $100k-200k, 7542.0% for AGIs over 200k)
Charity contributions: $5,975 (reported on 9.1% of returns)
Here:
$5,975
State:
$15,420
(% of AGI for various income ranges: 4.9% for AGIs below $25k, 19.9% for AGIs $25k-50k, 78.4% for AGIs $50k-75k, 182.7% for AGIs $75k-100k, 432.3% for AGIs $100k-200k, 2500.0% for AGIs over 200k)
Taxes paid: $9,472 (reported on 12.0% of returns)
11553:
$9,472
State:
$9,183
(% of AGI for various income ranges: 23.0% for AGIs below $25k, 85.7% for AGIs $25k-50k, 224.9% for AGIs $50k-75k, 394.0% for AGIs $75k-100k, 707.3% for AGIs $100k-200k, 1736.0% for AGIs over 200k)
Earned income credit: $2,212 (reported on 19.8% of returns)
Here:
$2,212
State:
$2,138
(% of AGI for various income ranges: 109.4% for AGIs below $25k, 71.6% for AGIs $25k-50k, 0.7% for AGIs $50k-75k)
Percentage of individuals using paid preparers for their 2020 taxes: 92.5%
Here:
93%
State:
95%
(% for various income ranges: 88.3% for AGIs below $25k, 95.5% for AGIs $25k-50k, 94.5% for AGIs $50k-75k, 94.4% for AGIs $75k-100k, 94.6% for AGIs $100k-200k, 100.0% for AGIs over 200k)
Averages for the 2012 tax year for zip code 11553, filed in 2013:
Average Adjusted Gross Income (AGI) in 2012: $41,331 (Individual Income Tax Returns)
Here:
$41,331
State:
$77,088
Salary/wage: $38,675 (reported on 86.2% of returns)
Here:
$38,675
State:
$60,593
(% of AGI for various income ranges: 77.7% for AGIs below $25k, 90.5% for AGIs $25k-50k, 86.9% for AGIs $50k-75k, 84.9% for AGIs $75k-100k, 83.0% for AGIs $100k-200k, 32.6% for AGIs over 200k)
Taxable interest for individuals: $1,241 (reported on 23.3% of returns)
This zip code:
$1,241
New York:
$3,125
(% of AGI for various income ranges: 0.3% for AGIs below $25k, 0.2% for AGIs $25k-50k, 0.2% for AGIs $50k-75k, 0.3% for AGIs $75k-100k, 0.2% for AGIs $100k-200k, 5.7% for AGIs over 200k)
Ordinary dividends: $5,294 (reported on 6.9% of returns)
Here:
$5,294
State:
$10,299
(% of AGI for various income ranges: 0.4% for AGIs below $25k, 0.2% for AGIs $25k-50k, 0.2% for AGIs $50k-75k, 0.3% for AGIs $75k-100k, 0.5% for AGIs $100k-200k, 6.7% for AGIs over 200k)
Net capital gain/loss in AGI: +$16,992 (reported on 4.5% of returns)
Here:
+$16,992
State:
+$42,474
(% of AGI for various income ranges: 21.8% for AGIs over 200k)
Profit/loss from business: +$7,167 (reported on 15.7% of returns)
Here:
+$7,167
State:
+$16,168
(% of AGI for various income ranges: 12.2% for AGIs below $25k, 1.5% for AGIs $25k-50k, 0.8% for AGIs $50k-75k, 0.1% for AGIs $75k-100k, 2.5% for AGIs $100k-200k)
Taxable individual retirement arrangement distribution: $13,175 (reported on 3.7% of returns)
11553:
$13,175
New York:
$17,621
(% of AGI for various income ranges: 1.0% for AGIs below $25k, 0.6% for AGIs $25k-50k, 1.1% for AGIs $50k-75k, 1.2% for AGIs $75k-100k, 2.6% for AGIs $100k-200k)
Total itemized deductions: $23,282 (31% of AGI, reported on 34.8% of returns)
Here:
$23,282
State:
$34,985
Here:
31.2% of AGI
State:
21.3% of AGI
(% of AGI for various income ranges: 9.7% for AGIs below $25k, 18.1% for AGIs $25k-50k, 22.9% for AGIs $50k-75k, 24.3% for AGIs $75k-100k, 22.9% for AGIs $100k-200k, 17.3% for AGIs over 200k)
Charity contributions: $3,591 (reported on 28.2% of returns)
Here:
$3,591
State:
$5,572
(% of AGI for various income ranges: 0.8% for AGIs below $25k, 1.8% for AGIs $25k-50k, 2.9% for AGIs $50k-75k, 3.0% for AGIs $75k-100k, 3.3% for AGIs $100k-200k, 2.8% for AGIs over 200k)
Taxes paid: $8,683 (reported on 34.8% of returns)
11553:
$8,683
State:
$18,656
(% of AGI for various income ranges: 3.1% for AGIs below $25k, 5.6% for AGIs $25k-50k, 8.2% for AGIs $50k-75k, 9.1% for AGIs $75k-100k, 10.0% for AGIs $100k-200k, 7.7% for AGIs over 200k)
Earned income credit: $2,266 (reported on 26.8% of returns)
Here:
$2,266
State:
$2,230
(% of AGI for various income ranges: 8.3% for AGIs below $25k, 1.3% for AGIs $25k-50k)
Percentage of individuals using paid preparers for their 2012 taxes: 75.1%
Here:
75%
State:
66%
(% for various income ranges: 74.7% for AGIs below $25k, 74.2% for AGIs $25k-50k, 75.8% for AGIs $50k-75k, 77.1% for AGIs $75k-100k, 76.7% for AGIs $100k-200k, 87.5% for AGIs over 200k)
Averages for the 2004 tax year for zip code 11553, filed in 2005:
Average Adjusted Gross Income (AGI) in 2004: $36,565 (Individual Income Tax Returns)
Here:
$36,565
State:
$59,519
Salary/wage: $35,750 (reported on 89.7% of returns)
Here:
$35,750
State:
$50,673
(% of AGI for various income ranges: 86.7% for AGIs below $10k, 86.5% for AGIs $10k-25k, 92.5% for AGIs $25k-50k, 88.2% for AGIs $50k-75k, 86.3% for AGIs $75k-100k, 81.2% for AGIs over 100k)
Taxable interest for individuals: $725 (reported on 36.3% of returns)
This zip code:
$725
New York:
$2,377
(% of AGI for various income ranges: 1.8% for AGIs below $10k, 0.8% for AGIs $10k-25k, 0.5% for AGIs $25k-50k, 0.6% for AGIs $50k-75k, 0.9% for AGIs $75k-100k, 0.8% for AGIs over 100k)
Taxable dividends: $1,549 (reported on 11.4% of returns)
Here:
$1,549
State:
$5,394
(% of AGI for various income ranges: 1.2% for AGIs below $10k, 0.4% for AGIs $10k-25k, 0.3% for AGIs $25k-50k, 0.4% for AGIs $50k-75k, 0.3% for AGIs $75k-100k, 1.1% for AGIs over 100k)
Net capital gain/loss: +$4,634 (reported on 7.0% of returns)
Here:
+$4,634
State:
+$23,581
(% of AGI for various income ranges: -0.6% for AGIs below $10k, 0.0% for AGIs $10k-25k, -0.1% for AGIs $25k-50k, 0.0% for AGIs $50k-75k, 0.1% for AGIs $75k-100k, 5.0% for AGIs over 100k)
Profit/loss from business: +$6,663 (reported on 11.3% of returns)
Here:
+$6,663
State:
+$13,809
(% of AGI for various income ranges: 18.7% for AGIs below $10k, 5.0% for AGIs $10k-25k, 1.0% for AGIs $25k-50k, 0.9% for AGIs $50k-75k, 0.8% for AGIs $75k-100k, 1.9% for AGIs over 100k)
IRA payment deduction: $2,580 (reported on 1.5% of returns)
11553:
$2,580
New York:
$3,115
(% of AGI for various income ranges: 0.1% for AGIs $10k-25k, 0.1% for AGIs $25k-50k, 0.1% for AGIs $50k-75k, 0.1% for AGIs $75k-100k)
Total itemized deductions: $20,940 (37% of AGI, reported on 45.9% of returns)
Here:
$20,940
State:
$25,864
Here:
37.3% of AGI
State:
21.9% of AGI
(% of AGI for various income ranges: 12.0% for AGIs below $10k, 20.2% for AGIs $10k-25k, 28.7% for AGIs $25k-50k, 30.1% for AGIs $50k-75k, 28.3% for AGIs $75k-100k, 22.5% for AGIs over 100k)
Charity contributions deductions: $3,278 (6% of AGI, reported on 40.9% of returns)
Here:
$3,278
State:
$4,439
Here:
5.6% of AGI
State:
3.6% of AGI
(% of AGI for various income ranges: 0.7% for AGIs below $10k, 1.9% for AGIs $10k-25k, 3.5% for AGIs $25k-50k, 4.2% for AGIs $50k-75k, 4.1% for AGIs $75k-100k, 4.6% for AGIs over 100k)
Total tax: $4,043 (reported on 67.5% of returns)
11553:
$4,043
State:
$11,730
(% of AGI for various income ranges: 3.5% for AGIs below $10k, 2.8% for AGIs $10k-25k, 4.9% for AGIs $25k-50k, 7.2% for AGIs $50k-75k, 9.4% for AGIs $75k-100k, 14.2% for AGIs over 100k)
Earned income credit: $1,708 (reported on 23.6% of returns)
Here:
$1,708
State:
$1,757
Percentage of individuals using paid preparers for their 2004 taxes: 72.4%
Here:
72%
State:
67%
(% for various income ranges: 67.9% for AGIs below $10k, 73.3% for AGIs $10k-25k, 72.8% for AGIs $25k-50k, 74.5% for AGIs $50k-75k, 74.1% for AGIs $75k-100k, 74.8% for AGIs over 100k)
Likely homosexual households (counted as self-reported same-sex unmarried-partner households)
Lesbian couples: 0.0% of all households
Gay men: 0.2% of all households
Household received Food Stamps/SNAP in the past 12 months: 596 Household did not receive Food Stamps/SNAP in the past 12 months: 6,644
Women who had a birth in the past 12 months: 704 (417 now married, 291 unmarried) Women who did not have a birth in the past 12 months: 5,962 (1,477 now married, 4,518 unmarried)
Housing units in zip code 11553 with a mortgage: 4,234 (229 second mortgage, 166 both second mortgage and home equity loan) Houses without a mortgage: 76
Median monthly owner costs for units with a mortgage: $2,713 Median monthly owner costs for units without a mortgage: $1,092
Residents with income below the poverty level in 2022:
This zip code:
10.3%
Whole state:
14.3%
Residents with income below 50% of the poverty level in 2022:
This zip code:
4.3%
Whole state:
6.8%
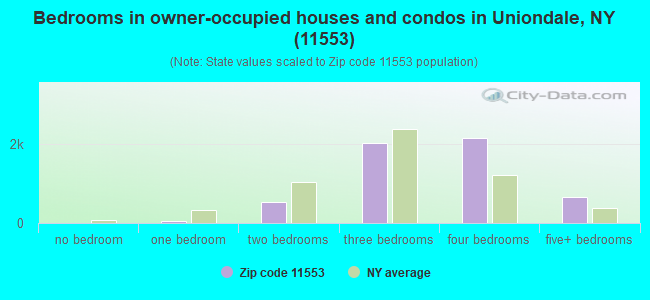
Median number of rooms in houses and condos:
Here:
6.8
State:
6.3
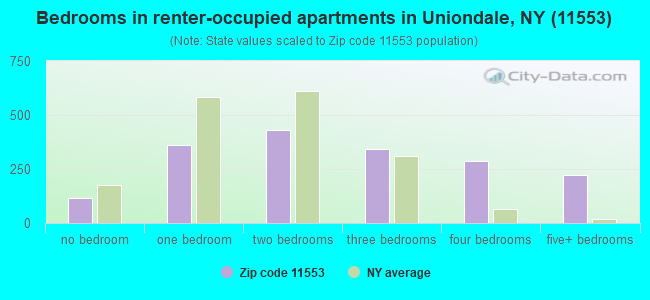
Median number of rooms in apartments:
Here:
5.1
State:
3.8
Notable locations in this zip code not listed on our city pages
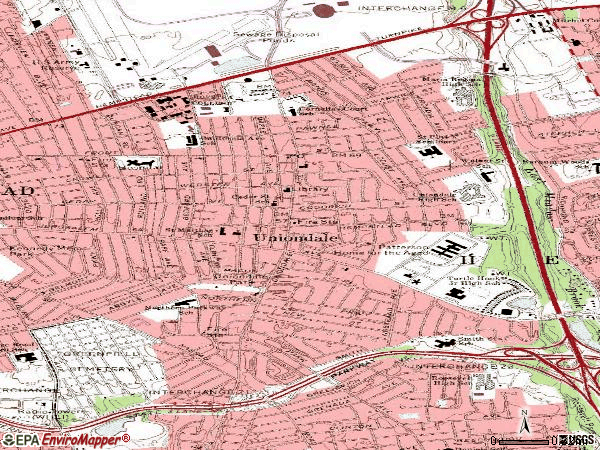
Notable locations in zip code 11553: James M Shuart Stadium (A), Nassau County Veterans Memorial Coliseum (B), Butler Annex (C), C V Starr Hall (D), Gittleson Hall (E), Hagedorn Hall (F), Hofstra Arena (G), Hofstra Dome (H), M Robert Lowe Hall (I), Mack Hall (J), Margiotta Hall (K), Monroe Lecture Center (L), Nassau Hall (M), Suffolk Hall (N), Uniondale Public Library (O), Cradle of Aviation Museum (P), South Hall (Q), A Holly Patterson Geriatric Facility (R), A Holly Patterson Extended Care Facility (S), Long Island Children's Museum (T). Display/hide their locations on the map
Churches in zip code 11553 include: Grace Cathedral International (A), Guiding Light Tabernacle Church (B), Iglesia Profetica La Cuida (C), Saint John the Baptist Orthodox Church (D), Tabernacle of Joy Baptist Church (E), United Methodist Church of Uniondale (F), Fountain of Life Church (G), Grace Lutheran Church (H), Holy Trinity Baptist Church of Uniondale (I). Display/hide their locations on the map
2,281 married couples with children.
1,734 single-parent households (760 men, 974 women).
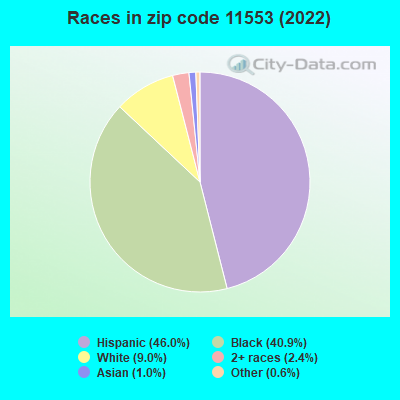
47.3% of residents of 11553 zip code speak English at home.
44.4% of residents speak Spanish at home (39% very well, 24% well, 31% not well, 5% not at all).
6.5% of residents speak other Indo-European language at home (66% very well, 26% well, 7% not well, 1% not at all).
0.7% of residents speak Asian or Pacific Island language at home (32% very well, 12% well, 41% not well, 16% not at all).
1.2% of residents speak other language at home (64% very well, 20% well, 13% not well, 3% not at all).
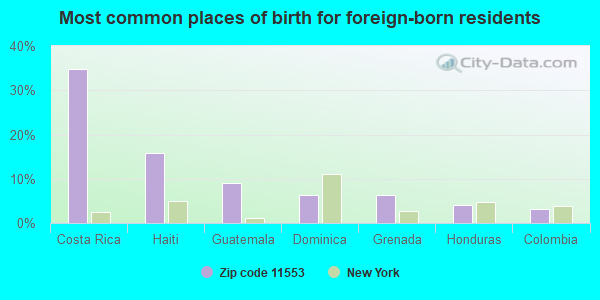
Foreign born population: 11,028 (40.2%) (58.5% of them are naturalized citizens)
This zip code:
40.2%
Whole state:
22.7%
35%Costa Rica
16%Haiti
9%Guatemala
6%Dominica
6%Grenada
4%Honduras
3%Colombia
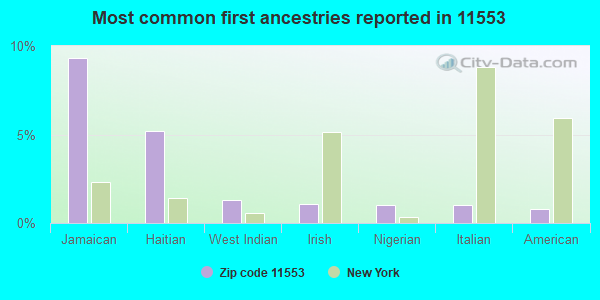
9%Jamaican
5%Haitian
1%West Indian
1%Irish
1%Nigerian
1%Italian
1%American
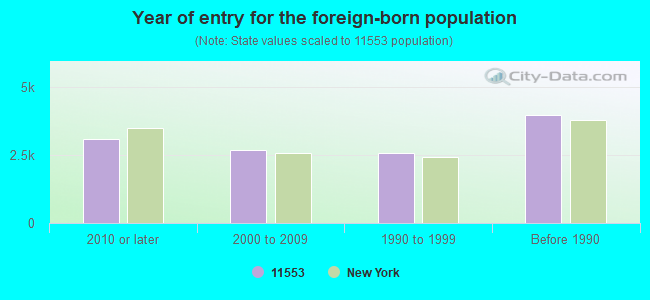
Year of entry for the foreign-born population
3,0982010 or later
2,6862000 to 2009
2,5811990 to 1999
3,985Before 1990
Facilities with environmental interests located in this zip code:
A. HOLLY PATTERSON GERIATRIC CTR. (875 JERUSALEM AVE in UNIONDALE, NY)
STATE MASTER (New York facility tracking) - REFUSE DISPOSAL, AIR PROGRAM, HAZARDOUS WASTE PROGRAM HAZARDOUS WASTE BIENNIAL REPORTER (Resource Conservation and Recovery Act (tracking hazardous waste)) Small Quantity Generators, between 100 kg and 1000 kg of hazardous waste/month (Resource Conservation and Recovery Act (tracking hazardous waste)) - notification Business SIC classification: SKILLED NURSING CARE FACILITIES; NURSING AND PERSONAL CARE FACILITIES Organizations: NASSAU HEALTH CARE CORPORATION (AIR PERMITTING FACILITY OWNER CONTACT)
, NASSAU COUNTY (CONTACT/OWNER)
, NASSAU HEALTH CARE CORPORATION (LEGALLY RESPONSIBLE PARTY)
Alternative names: A HOLLY PATTERSON EXTENDED CARE FACILITY
ARTIES DRY CLEANING (480 JERUSALEM AVE in UNIONDALE, NY)
AIR MINOR (AIRS/AFS) STATE MASTER (New York facility tracking) - AIR PROGRAM Small Quantity Generators, between 100 kg and 1000 kg of hazardous waste/month (Resource Conservation and Recovery Act (tracking hazardous waste)) Business SIC classification: DRYCLEANING PLANTS, EXCEPT RUG CLEANING Business NAICS classification: DRYCLEANING AND LAUNDRY SERVICES (EXCEPT COIN-OPERATED). Alternative names: ARTIES CLEANERS
HANSEN S CLEANERS (433 JERUSALEM AVENUE in UNIONDALE, NY)
AIR MINOR (AIRS/AFS) STATE MASTER (New York facility tracking) - AIR PROGRAM Small Quantity Generators, between 100 kg and 1000 kg of hazardous waste/month (Resource Conservation and Recovery Act (tracking hazardous waste)) Business SIC classification: DRYCLEANING PLANTS, EXCEPT RUG CLEANING Business NAICS classification: DRYCLEANING AND LAUNDRY SERVICES (EXCEPT COIN-OPERATED). Organizations: ABC CLEANERS INC (LEGALLY RESPONSIBLE PARTY)
Alternative names: HANSEN'S CLEANERS, JOONGWOO CLEANERS INC
AMERICAN PRINTING CONVERTERS (635 NASSAU ROAD in UNIONDALE, NY)
AIR MINOR (AIRS/AFS) (Resource Conservation and Recovery Act (tracking hazardous waste)) Business SIC classification: COMMERCIAL PRINTING, LITHOGRAPHIC
GUTTMAN DANIEL (907-915 NASSAU RD in UNIONDALE, NY)
(Resource Conservation and Recovery Act (tracking hazardous waste)) Organizations: DANIEL GUTTMAN (CONTACT/OPERATOR)
HEMPSTEAD TOWN OF UNIONDALE TANK (EASTERN TERMINUS OF in UNIONDALE, NY)
Large Quantity Generators, more that 1000 kg of hazardous waste/month (Resource Conservation and Recovery Act (tracking hazardous waste)) - notification TRANSPORTER (Resource Conservation and Recovery Act (tracking hazardous waste)) - notification Organizations: TOWN OF HEMPSTEAD (CONTACT/OWNER)
J B P PROPERTIES INC (1201 FRONT ST in UNIONDALE, NY)
Large Quantity Generators, more that 1000 kg of hazardous waste/month (Resource Conservation and Recovery Act (tracking hazardous waste)) - notification
HEMPSTEAD TOWN OF MITCHELL STREET (MITCHELL ST - N 40 41 55 in UNIONDALE, NY)
(Resource Conservation and Recovery Act (tracking hazardous waste))
ANIMAL DOCTORS CLINIC (258 WARREN ST in UNIONDALE, NY)
Conditionally Exempt Small Quantity Generators, less than 100 kg/month of hazardous waste (Resource Conservation and Recovery Act (tracking hazardous waste)) - notification Organizations: DR MARK BECKERMAN (CONTACT/OWNER)
HEMPSTEAD TOWN OF GREENFIELD CEMETERY (650 NASSAU RD in UNIONDALE, NY)
Small Quantity Generators, between 100 kg and 1000 kg of hazardous waste/month (Resource Conservation and Recovery Act (tracking hazardous waste)) - notification Organizations: TOWN OF HEMPSTEAD GENERAL SERVICES (CONTACT/OWNER)
COUNTY OF NASSAU - EXPANSION (NASSAU RD & UNIONDALE AVE in UNIONDALE, NY)
Conditionally Exempt Small Quantity Generators, less than 100 kg/month of hazardous waste (Resource Conservation and Recovery Act (tracking hazardous waste)) - notification Alternative names: NASSAU COUNTY ROAD EXPANSION
Housing units lacking complete plumbing facilities: 0.6% Housing units lacking complete kitchen facilities: 0.8%
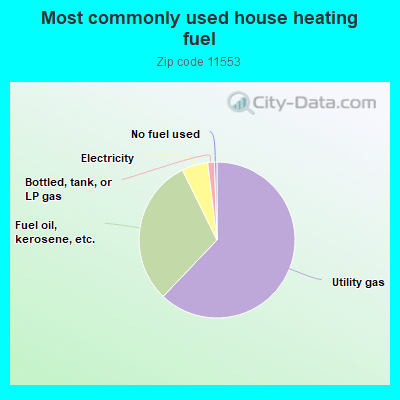
62.0%Utility gas
30.5%Fuel oil, kerosene, etc.
5.4%Electricity
1.4%Bottled, tank, or LP gas
0.5%No fuel used
Population in 1990: 20,397. Population change in the 1990s: +3,055 (+15.0%).
Place of birth for U.S.-born residents:
This state: 13,466
Northeast: 260
Midwest: 321
South: 670
West: 326
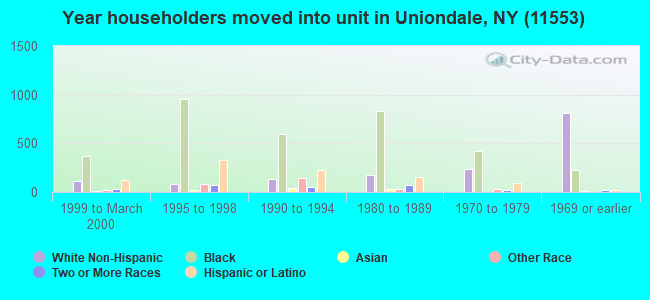
69% of the 11553 zip code residents lived in the same house 5 years ago. Out of people who lived in different houses, 60% lived in this county. Out of people who lived in different counties, 50% lived in New York.
95% of the 11553 zip code residents lived in the same house 1 year ago. Out of people who lived in different houses, 61% moved from this county. Out of people who lived in different houses, 21% moved from different county within same state. Out of people who lived in different houses, 3% moved from different state. Out of people who lived in different houses, 13% moved from abroad.
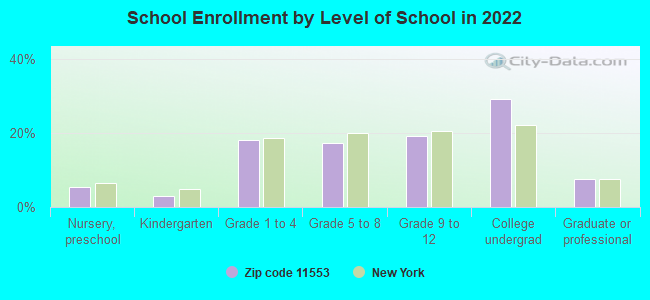
Private vs. public school enrollment:
Students in private schools in grades 1 to 8 (elementary and middle school): 270
Here:
10.5%
New York:
15.6%
Students in private schools in grades 9 to 12 (high school): 134
Here:
9.7%
New York:
15.0%
Students in private undergraduate colleges: 1,104
Here:
52.1%
New York:
39.2%
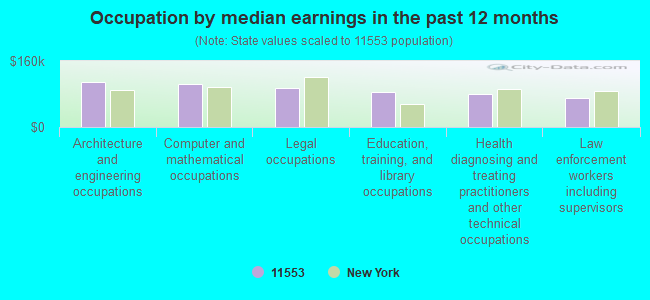
Occupation by median earnings in the past 12 months ($)
107,968Architecture and engineering occupations
104,784Computer and mathematical occupations
94,043Legal occupations
84,883Education, training, and library occupations
80,824Health diagnosing and treating practitioners and other technical occupations
70,521Law enforcement workers including supervisors
Companies with federal contracts located in this zip code (UNIONDALE, NY):
FREQUENCY ELECTRONICS INC (55 CHARLES LINDBERGH BLVD; small business) : $2,495,876 in 25 contractsfrom 1999 to 2006
Contracts for Defense Missile and Space Systems -- Applied Research and Exploratory Development (R&D), Oscillators and Piezoelectric Crystals, Electron Tubes and Associated Hardware, Miscellaneous Communication Equipment, and moreby Air Force, Navy, Army, NASA, and others Signed by year:2000: $108,100; 2001: $251,067; 2002: $33,085; 2003: $21,662; 2004: $135,421; 2005: $799,903; 2006: $1,067,000.
Biggest contracts:
$663,000 with Air Force for Defense Missile and Space Systems -- Applied Research and Exploratory Development (R&D). Signed on 2006-02-24. Completion date: 2008-09-30.
$407,520, same as above.Signed on 2005-05-27. Completion date: 2008-09-30.
$204,000, same as above.Signed on 2006-03-14. Completion date: 2008-09-30.
$200,000, same as above.Signed on 2006-01-27. Completion date: 2008-09-30.
TILETON MULTIPLE SERVICE (491 COOPER CT; small business) : $263,880 in 17 contractsfrom 2005 to 2006
Contracts for Construction of Structures and Facilities -- Miscellaneous Buildings, Maintenance, Repair or Alteration of Real Property -- Family Housing Facilities by Navy Signed by year:2000: $0; 2001: $0; 2002: $0; 2003: $0; 2004: $0; 2005: $249,051; 2006: $14,829.
Biggest contracts:
$24,924 with Navy for Construction of Structures and Facilities -- Miscellaneous Buildings. Signed on 2005-08-01. Completion date: 2005-08-25.
$24,702, same as above.Signed on 2005-08-31. Completion date: 2005-09-30.
$24,479 with Navy for Construction of Structures and Facilities -- Miscellaneous Buildings. Taking place in CT. Signed on 2005-05-24. Completion date: 2005-06-13.
$24,000 with Navy for Construction of Structures and Facilities -- Miscellaneous Buildings. Signed on 2005-08-01. Completion date: 2005-08-25.
GUZMAN, VICTOR (170 STANTON BLVD; small business) : $215,567 in 21 contractsfrom 2003 to 2005
Contracts for Maintenance, Repair or Alteration of Real Property -- Family Housing Facilities, Maintenance, Repair or Alteration of Real Property -- Miscellaneous Buildings by Navy Signed by year:2000: $0; 2001: $0; 2002: $0; 2003: $20,600; 2004: $98,028; 2005: $96,939; 2006: $0.
Biggest contracts:
$24,000 with Navy for Maintenance, Repair or Alteration of Real Property -- Family Housing Facilities. Signed on 2005-08-01. Completion date: 2005-08-30.
$22,375, same as above.Signed on 2004-09-16. Completion date: 2004-10-16.
$20,000, same as above.Signed on 2005-08-05. Completion date: 2005-08-12.
$18,192 with Navy for Maintenance, Repair or Alteration of Real Property -- Family Housing Facilities. Taking place in CT. Signed on 2005-05-24. Completion date: 2005-06-15.
THE MONTROSE ORGANIZATION (929B NASSAU ROAD; small business)
$120,888 with Defense Logistics Agency for ADP Software. Signed on 1999-10-01. Completion date: 1999-10-30.
MARRIOTT INTERNATIONAL, INC (101 JAMES DOOLITTLE BLVD) : $34,701 in 4 contractsin 2004
$17,135 with Army for Lodging - Hotel/Motel. Signed on 2004-10-08. Completion date: 2004-10-28.
$15,500, same as above.Signed on 2004-09-08. Completion date: 2004-09-27.
$1,790, same as above.Signed on 2004-02-25. Completion date: 2004-02-27.
$276, same as above.Signed on 2004-11-23. Completion date: 2004-10-28.
GANIS BROS INC (972 NASSAU RD; small business)
$25,137 with Air Force for Underwear and Nightwear, Women's. Signed on 2000-12-27. Completion date: 2001-03-30.
FEI GOVERNMENT SYSTEMS, INC (55 CHARLES LINDBERGH BLVD)
$500 with Army for Miscellaneous Communication Equipment. Signed on 2003-01-08. Completion date: 2003-03-17.
Top industries in this zip code by the number of employees in 2005:
Health Care and Social Assistance: Nursing Care Facilities (500-999 employees: 1 establishment, 250-499 employees: 1 establishment)
Management of Companies and Enterprises: Corporate, Subsidiary, and Regional Managing Offices (250-499: 2, 100-249: 1, 50-99: 1, 1-4: 2)
Arts, Entertainment, and Recreation: Promoters of Performing Arts, Sports, and Similar Events with Facilities (500-999: 1)
Other Services (except Public Administration): Religious Organizations (250-499: 1, 20-49: 1, 5-9: 1, 1-4: 5)
Arts, Entertainment, and Recreation: Sports Teams and Clubs (250-499: 1, 20-49: 1)
2002 - 2018 National Fire Incident Reporting System (NFIRS) incidents
Based on the data from the years 2002 - 2018 the average number of fire incidents per year is 24. The highest number of reported fires - 82 took place in 2006, and the least - 0 in 2004. The data has a decreasing trend.
When looking into fire subcategories, the most reports belonged to: Outside Fires (34.1%), and Structure Fires (23.3%).
Fire incident types reported to NFIRS in Zip Code 11553


 Nearest zip codes: 11556, 11549, 11575, 11550, 11554, 11514.
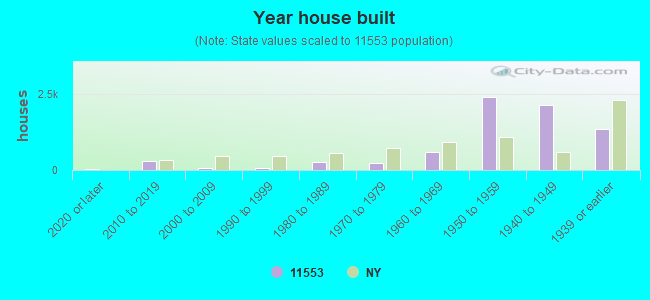


 Based on the data from the years 2002 - 2018 the average number of fire incidents per year is 24. The highest number of reported fires - 82 took place in 2006, and the least - 0 in 2004. The data has a decreasing trend.
 When looking into fire subcategories, the most reports belonged to: Outside Fires (34.1%), and Structure Fires (23.3%).