Estimated zip code population in 2022: 18,798
Zip code population in 2010: 16,272
Zip code population in 2000: 15,975
Houses and condos: 4,761
Renter-occupied apartments: 1,126
% of renters here:
24%State:
46%
March 2022 cost of living index in zip code 11575: 149.6
(very high, U.S. average is 100)
Land area: 1.8
sq. mi.
Water area: 0.0
sq. mi.
Population density: 10,558 people per square mile (high).
OSM Map
General Map
Google Map
MSN Map
OSM Map
General Map
Google Map
MSN Map
OSM Map
General Map
Google Map
MSN Map
OSM Map
General Map
Google Map
MSN Map
Please wait while loading the map...
Real estate property taxes paid for housing units in 2022:
This zip code:
1.9% ($8,150)New York:
1.5% ($6,180)
Median real estate property taxes paid for housing units with mortgages in 2022: $8,305 (1.9%)
Median real estate property taxes paid for housing units with no mortgage in 2022: $7,631 (1.9%)
Profiles of local businesses
Business Search - 14 Million verified businesses
Males: 9,226 Females: 9,571
For population 25 years and over in 11575:
High school or higher: 81.8%Bachelor's degree or higher: 25.5%Graduate or professional degree: 7.3%Unemployed: 3.8%Mean travel time to work (commute): 35.1 minutes
For population 15 years and over in 11575:
Never married: 43.2%Now married: 40.6%Separated: 2.3%Widowed: 5.1%Divorced: 8.8%
Zip code 11575 compared to state average:
Median household income above state average. Black race population percentage significantly above state average. Hispanic race population percentage above state average. Median age below state average. Foreign-born population percentage above state average. Renting percentage below state average. Number of rooms per house above state average. Percentage of population with a bachelor's degree or higher below state average. 9,269 49.3% Black 8,104 43.1% Hispanic or Latino 447 2.4% Asian 453 2.4% Two or more races 388 2.1% White 128 0.7% Some other race 5 0.03% American Indian
Data:
Median household income ($)
Median household income (% change since 2000)
Household income diversity
Ratio of average income to average house value (%)
Ratio of average income to average rent
Median household income ($) - White
Median household income ($) - Black or African American
Median household income ($) - Asian
Median household income ($) - Hispanic or Latino
Median household income ($) - American Indian and Alaska Native
Median household income ($) - Multirace
Median household income ($) - Other Race
Median household income for houses/condos with a mortgage ($)
Median household income for apartments without a mortgage ($)
Races - White alone (%)
Races - White alone (% change since 2000)
Races - Black alone (%)
Races - Black alone (% change since 2000)
Races - American Indian alone (%)
Races - American Indian alone (% change since 2000)
Races - Asian alone (%)
Races - Asian alone (% change since 2000)
Races - Hispanic (%)
Races - Hispanic (% change since 2000)
Races - Native Hawaiian and Other Pacific Islander alone (%)
Races - Native Hawaiian and Other Pacific Islander alone (% change since 2000)
Races - Two or more races (%)
Races - Two or more races (% change since 2000)
Races - Other race alone (%)
Races - Other race alone (% change since 2000)
Racial diversity
Unemployment (%)
Unemployment (% change since 2000)
Unemployment (%) - White
Unemployment (%) - Black or African American
Unemployment (%) - Asian
Unemployment (%) - Hispanic or Latino
Unemployment (%) - American Indian and Alaska Native
Unemployment (%) - Multirace
Unemployment (%) - Other Race
Population density (people per square mile)
Population - Males (%)
Population - Females (%)
Population - Males (%) - White
Population - Males (%) - Black or African American
Population - Males (%) - Asian
Population - Males (%) - Hispanic or Latino
Population - Males (%) - American Indian and Alaska Native
Population - Males (%) - Multirace
Population - Males (%) - Other Race
Population - Females (%) - White
Population - Females (%) - Black or African American
Population - Females (%) - Asian
Population - Females (%) - Hispanic or Latino
Population - Females (%) - American Indian and Alaska Native
Population - Females (%) - Multirace
Population - Females (%) - Other Race
Coronavirus confirmed cases (May 07, 2024)
Deaths caused by coronavirus (May 07, 2024)
Coronavirus confirmed cases (per 100k population) (May 07, 2024)
Deaths caused by coronavirus (per 100k population) (May 07, 2024)
Daily increase in number of cases (May 07, 2024)
Weekly increase in number of cases (May 07, 2024)
Cases doubled (in days) (May 07, 2024)
Hospitalized patients (Apr 18, 2022)
Negative test results (Apr 18, 2022)
Total test results (Apr 18, 2022)
COVID Vaccine doses distributed (per 100k population) (Sep 19, 2023)
COVID Vaccine doses administered (per 100k population) (Sep 19, 2023)
COVID Vaccine doses distributed (Sep 19, 2023)
COVID Vaccine doses administered (Sep 19, 2023)
Likely homosexual households (%)
Likely homosexual households (% change since 2000)
Likely homosexual households - Lesbian couples (%)
Likely homosexual households - Lesbian couples (% change since 2000)
Likely homosexual households - Gay men (%)
Likely homosexual households - Gay men (% change since 2000)
Cost of living index
Median gross rent ($)
Median contract rent ($)
Median monthly housing costs ($)
Median house or condo value ($)
Median house or condo value ($ change since 2000)
Mean house or condo value by units in structure - 1, detached ($)
Mean house or condo value by units in structure - 1, attached ($)
Mean house or condo value by units in structure - 2 ($)
Mean house or condo value by units in structure by units in structure - 3 or 4 ($)
Mean house or condo value by units in structure - 5 or more ($)
Mean house or condo value by units in structure - Boat, RV, van, etc. ($)
Mean house or condo value by units in structure - Mobile home ($)
Median house or condo value ($) - White
Median house or condo value ($) - Black or African American
Median house or condo value ($) - Asian
Median house or condo value ($) - Hispanic or Latino
Median house or condo value ($) - American Indian and Alaska Native
Median house or condo value ($) - Multirace
Median house or condo value ($) - Other Race
Median resident age
Resident age diversity
Median resident age - Males
Median resident age - Females
Median resident age - White
Median resident age - Black or African American
Median resident age - Asian
Median resident age - Hispanic or Latino
Median resident age - American Indian and Alaska Native
Median resident age - Multirace
Median resident age - Other Race
Median resident age - Males - White
Median resident age - Males - Black or African American
Median resident age - Males - Asian
Median resident age - Males - Hispanic or Latino
Median resident age - Males - American Indian and Alaska Native
Median resident age - Males - Multirace
Median resident age - Males - Other Race
Median resident age - Females - White
Median resident age - Females - Black or African American
Median resident age - Females - Asian
Median resident age - Females - Hispanic or Latino
Median resident age - Females - American Indian and Alaska Native
Median resident age - Females - Multirace
Median resident age - Females - Other Race
Commute - mean travel time to work (minutes)
Travel time to work - Less than 5 minutes (%)
Travel time to work - Less than 5 minutes (% change since 2000)
Travel time to work - 5 to 9 minutes (%)
Travel time to work - 5 to 9 minutes (% change since 2000)
Travel time to work - 10 to 19 minutes (%)
Travel time to work - 10 to 19 minutes (% change since 2000)
Travel time to work - 20 to 29 minutes (%)
Travel time to work - 20 to 29 minutes (% change since 2000)
Travel time to work - 30 to 39 minutes (%)
Travel time to work - 30 to 39 minutes (% change since 2000)
Travel time to work - 40 to 59 minutes (%)
Travel time to work - 40 to 59 minutes (% change since 2000)
Travel time to work - 60 to 89 minutes (%)
Travel time to work - 60 to 89 minutes (% change since 2000)
Travel time to work - 90 or more minutes (%)
Travel time to work - 90 or more minutes (% change since 2000)
Marital status - Never married (%)
Marital status - Now married (%)
Marital status - Separated (%)
Marital status - Widowed (%)
Marital status - Divorced (%)
Median family income ($)
Median family income (% change since 2000)
Median non-family income ($)
Median non-family income (% change since 2000)
Median per capita income ($)
Median per capita income (% change since 2000)
Median family income ($) - White
Median family income ($) - Black or African American
Median family income ($) - Asian
Median family income ($) - Hispanic or Latino
Median family income ($) - American Indian and Alaska Native
Median family income ($) - Multirace
Median family income ($) - Other Race
Median year house/condo built
Median year apartment built
Year house built - Built 2005 or later (%)
Year house built - Built 2000 to 2004 (%)
Year house built - Built 1990 to 1999 (%)
Year house built - Built 1980 to 1989 (%)
Year house built - Built 1970 to 1979 (%)
Year house built - Built 1960 to 1969 (%)
Year house built - Built 1950 to 1959 (%)
Year house built - Built 1940 to 1949 (%)
Year house built - Built 1939 or earlier (%)
Average household size
Household density (households per square mile)
Average household size - White
Average household size - Black or African American
Average household size - Asian
Average household size - Hispanic or Latino
Average household size - American Indian and Alaska Native
Average household size - Multirace
Average household size - Other Race
Occupied housing units (%)
Vacant housing units (%)
Owner occupied housing units (%)
Renter occupied housing units (%)
Vacancy status - For rent (%)
Vacancy status - For sale only (%)
Vacancy status - Rented or sold, not occupied (%)
Vacancy status - For seasonal, recreational, or occasional use (%)
Vacancy status - For migrant workers (%)
Vacancy status - Other vacant (%)
Residents with income below the poverty level (%)
Residents with income below 50% of the poverty level (%)
Children below poverty level (%)
Poor families by family type - Married-couple family (%)
Poor families by family type - Male, no wife present (%)
Poor families by family type - Female, no husband present (%)
Poverty status for native-born residents (%)
Poverty status for foreign-born residents (%)
Poverty among high school graduates not in families (%)
Poverty among people who did not graduate high school not in families (%)
Residents with income below the poverty level (%) - White
Residents with income below the poverty level (%) - Black or African American
Residents with income below the poverty level (%) - Asian
Residents with income below the poverty level (%) - Hispanic or Latino
Residents with income below the poverty level (%) - American Indian and Alaska Native
Residents with income below the poverty level (%) - Multirace
Residents with income below the poverty level (%) - Other Race
Air pollution - Air Quality Index (AQI)
Air pollution - CO
Air pollution - NO2
Air pollution - SO2
Air pollution - Ozone
Air pollution - PM10
Air pollution - PM25
Air pollution - Pb
Crime - Murders per 100,000 population
Crime - Rapes per 100,000 population
Crime - Robberies per 100,000 population
Crime - Assaults per 100,000 population
Crime - Burglaries per 100,000 population
Crime - Thefts per 100,000 population
Crime - Auto thefts per 100,000 population
Crime - Arson per 100,000 population
Crime - City-data.com crime index
Crime - Violent crime index
Crime - Property crime index
Crime - Murders per 100,000 population (5 year average)
Crime - Rapes per 100,000 population (5 year average)
Crime - Robberies per 100,000 population (5 year average)
Crime - Assaults per 100,000 population (5 year average)
Crime - Burglaries per 100,000 population (5 year average)
Crime - Thefts per 100,000 population (5 year average)
Crime - Auto thefts per 100,000 population (5 year average)
Crime - Arson per 100,000 population (5 year average)
Crime - City-data.com crime index (5 year average)
Crime - Violent crime index (5 year average)
Crime - Property crime index (5 year average)
1996 Presidential Elections Results (%) - Democratic Party (Clinton)
1996 Presidential Elections Results (%) - Republican Party (Dole)
1996 Presidential Elections Results (%) - Other
2000 Presidential Elections Results (%) - Democratic Party (Gore)
2000 Presidential Elections Results (%) - Republican Party (Bush)
2000 Presidential Elections Results (%) - Other
2004 Presidential Elections Results (%) - Democratic Party (Kerry)
2004 Presidential Elections Results (%) - Republican Party (Bush)
2004 Presidential Elections Results (%) - Other
2008 Presidential Elections Results (%) - Democratic Party (Obama)
2008 Presidential Elections Results (%) - Republican Party (McCain)
2008 Presidential Elections Results (%) - Other
2012 Presidential Elections Results (%) - Democratic Party (Obama)
2012 Presidential Elections Results (%) - Republican Party (Romney)
2012 Presidential Elections Results (%) - Other
2016 Presidential Elections Results (%) - Democratic Party (Clinton)
2016 Presidential Elections Results (%) - Republican Party (Trump)
2016 Presidential Elections Results (%) - Other
2020 Presidential Elections Results (%) - Democratic Party (Biden)
2020 Presidential Elections Results (%) - Republican Party (Trump)
2020 Presidential Elections Results (%) - Other
Ancestries Reported - Arab (%)
Ancestries Reported - Czech (%)
Ancestries Reported - Danish (%)
Ancestries Reported - Dutch (%)
Ancestries Reported - English (%)
Ancestries Reported - French (%)
Ancestries Reported - French Canadian (%)
Ancestries Reported - German (%)
Ancestries Reported - Greek (%)
Ancestries Reported - Hungarian (%)
Ancestries Reported - Irish (%)
Ancestries Reported - Italian (%)
Ancestries Reported - Lithuanian (%)
Ancestries Reported - Norwegian (%)
Ancestries Reported - Polish (%)
Ancestries Reported - Portuguese (%)
Ancestries Reported - Russian (%)
Ancestries Reported - Scotch-Irish (%)
Ancestries Reported - Scottish (%)
Ancestries Reported - Slovak (%)
Ancestries Reported - Subsaharan African (%)
Ancestries Reported - Swedish (%)
Ancestries Reported - Swiss (%)
Ancestries Reported - Ukrainian (%)
Ancestries Reported - United States (%)
Ancestries Reported - Welsh (%)
Ancestries Reported - West Indian (%)
Ancestries Reported - Other (%)
Educational Attainment - No schooling completed (%)
Educational Attainment - Less than high school (%)
Educational Attainment - High school or equivalent (%)
Educational Attainment - Less than 1 year of college (%)
Educational Attainment - 1 or more years of college (%)
Educational Attainment - Associate degree (%)
Educational Attainment - Bachelor's degree (%)
Educational Attainment - Master's degree (%)
Educational Attainment - Professional school degree (%)
Educational Attainment - Doctorate degree (%)
School Enrollment - Nursery, preschool (%)
School Enrollment - Kindergarten (%)
School Enrollment - Grade 1 to 4 (%)
School Enrollment - Grade 5 to 8 (%)
School Enrollment - Grade 9 to 12 (%)
School Enrollment - College undergrad (%)
School Enrollment - Graduate or professional (%)
School Enrollment - Not enrolled in school (%)
School enrollment - Public schools (%)
School enrollment - Private schools (%)
School enrollment - Not enrolled (%)
Median number of rooms in houses and condos
Median number of rooms in apartments
Housing units lacking complete plumbing facilities (%)
Housing units lacking complete kitchen facilities (%)
Density of houses
Urban houses (%)
Rural houses (%)
Households with people 60 years and over (%)
Households with people 65 years and over (%)
Households with people 75 years and over (%)
Households with one or more nonrelatives (%)
Households with no nonrelatives (%)
Population in households (%)
Family households (%)
Nonfamily households (%)
Population in families (%)
Family households with own children (%)
Median number of bedrooms in owner occupied houses
Mean number of bedrooms in owner occupied houses
Median number of bedrooms in renter occupied houses
Mean number of bedrooms in renter occupied houses
Median number of vehichles in owner occupied houses
Mean number of vehichles in owner occupied houses
Median number of vehichles in renter occupied houses
Mean number of vehichles in renter occupied houses
Mortgage status - with mortgage (%)
Mortgage status - with second mortgage (%)
Mortgage status - with home equity loan (%)
Mortgage status - with both second mortgage and home equity loan (%)
Mortgage status - without a mortgage (%)
Average family size
Average family size - White
Average family size - Black or African American
Average family size - Asian
Average family size - Hispanic or Latino
Average family size - American Indian and Alaska Native
Average family size - Multirace
Average family size - Other Race
Geographical mobility - Same house 1 year ago (%)
Geographical mobility - Moved within same county (%)
Geographical mobility - Moved from different county within same state (%)
Geographical mobility - Moved from different state (%)
Geographical mobility - Moved from abroad (%)
Place of birth - Born in state of residence (%)
Place of birth - Born in other state (%)
Place of birth - Native, outside of US (%)
Place of birth - Foreign born (%)
Housing units in structures - 1, detached (%)
Housing units in structures - 1, attached (%)
Housing units in structures - 2 (%)
Housing units in structures - 3 or 4 (%)
Housing units in structures - 5 to 9 (%)
Housing units in structures - 10 to 19 (%)
Housing units in structures - 20 to 49 (%)
Housing units in structures - 50 or more (%)
Housing units in structures - Mobile home (%)
Housing units in structures - Boat, RV, van, etc. (%)
House/condo owner moved in on average (years ago)
Renter moved in on average (years ago)
Year householder moved into unit - Moved in 1999 to March 2000 (%)
Year householder moved into unit - Moved in 1995 to 1998 (%)
Year householder moved into unit - Moved in 1990 to 1994 (%)
Year householder moved into unit - Moved in 1980 to 1989 (%)
Year householder moved into unit - Moved in 1970 to 1979 (%)
Year householder moved into unit - Moved in 1969 or earlier (%)
Means of transportation to work - Drove car alone (%)
Means of transportation to work - Carpooled (%)
Means of transportation to work - Public transportation (%)
Means of transportation to work - Bus or trolley bus (%)
Means of transportation to work - Streetcar or trolley car (%)
Means of transportation to work - Subway or elevated (%)
Means of transportation to work - Railroad (%)
Means of transportation to work - Ferryboat (%)
Means of transportation to work - Taxicab (%)
Means of transportation to work - Motorcycle (%)
Means of transportation to work - Bicycle (%)
Means of transportation to work - Walked (%)
Means of transportation to work - Other means (%)
Working at home (%)
Industry diversity
Most Common Industries - Agriculture, forestry, fishing and hunting, and mining (%)
Most Common Industries - Agriculture, forestry, fishing and hunting (%)
Most Common Industries - Mining, quarrying, and oil and gas extraction (%)
Most Common Industries - Construction (%)
Most Common Industries - Manufacturing (%)
Most Common Industries - Wholesale trade (%)
Most Common Industries - Retail trade (%)
Most Common Industries - Transportation and warehousing, and utilities (%)
Most Common Industries - Transportation and warehousing (%)
Most Common Industries - Utilities (%)
Most Common Industries - Information (%)
Most Common Industries - Finance and insurance, and real estate and rental and leasing (%)
Most Common Industries - Finance and insurance (%)
Most Common Industries - Real estate and rental and leasing (%)
Most Common Industries - Professional, scientific, and management, and administrative and waste management services (%)
Most Common Industries - Professional, scientific, and technical services (%)
Most Common Industries - Management of companies and enterprises (%)
Most Common Industries - Administrative and support and waste management services (%)
Most Common Industries - Educational services, and health care and social assistance (%)
Most Common Industries - Educational services (%)
Most Common Industries - Health care and social assistance (%)
Most Common Industries - Arts, entertainment, and recreation, and accommodation and food services (%)
Most Common Industries - Arts, entertainment, and recreation (%)
Most Common Industries - Accommodation and food services (%)
Most Common Industries - Other services, except public administration (%)
Most Common Industries - Public administration (%)
Occupation diversity
Most Common Occupations - Management, business, science, and arts occupations (%)
Most Common Occupations - Management, business, and financial occupations (%)
Most Common Occupations - Management occupations (%)
Most Common Occupations - Business and financial operations occupations (%)
Most Common Occupations - Computer, engineering, and science occupations (%)
Most Common Occupations - Computer and mathematical occupations (%)
Most Common Occupations - Architecture and engineering occupations (%)
Most Common Occupations - Life, physical, and social science occupations (%)
Most Common Occupations - Education, legal, community service, arts, and media occupations (%)
Most Common Occupations - Community and social service occupations (%)
Most Common Occupations - Legal occupations (%)
Most Common Occupations - Education, training, and library occupations (%)
Most Common Occupations - Arts, design, entertainment, sports, and media occupations (%)
Most Common Occupations - Healthcare practitioners and technical occupations (%)
Most Common Occupations - Health diagnosing and treating practitioners and other technical occupations (%)
Most Common Occupations - Health technologists and technicians (%)
Most Common Occupations - Service occupations (%)
Most Common Occupations - Healthcare support occupations (%)
Most Common Occupations - Protective service occupations (%)
Most Common Occupations - Fire fighting and prevention, and other protective service workers including supervisors (%)
Most Common Occupations - Law enforcement workers including supervisors (%)
Most Common Occupations - Food preparation and serving related occupations (%)
Most Common Occupations - Building and grounds cleaning and maintenance occupations (%)
Most Common Occupations - Personal care and service occupations (%)
Most Common Occupations - Sales and office occupations (%)
Most Common Occupations - Sales and related occupations (%)
Most Common Occupations - Office and administrative support occupations (%)
Most Common Occupations - Natural resources, construction, and maintenance occupations (%)
Most Common Occupations - Farming, fishing, and forestry occupations (%)
Most Common Occupations - Construction and extraction occupations (%)
Most Common Occupations - Installation, maintenance, and repair occupations (%)
Most Common Occupations - Production, transportation, and material moving occupations (%)
Most Common Occupations - Production occupations (%)
Most Common Occupations - Transportation occupations (%)
Most Common Occupations - Material moving occupations (%)
People in Group quarters - Institutionalized population (%)
People in Group quarters - Correctional institutions (%)
People in Group quarters - Federal prisons and detention centers (%)
People in Group quarters - Halfway houses (%)
People in Group quarters - Local jails and other confinement facilities (including police lockups) (%)
People in Group quarters - Military disciplinary barracks (%)
People in Group quarters - State prisons (%)
People in Group quarters - Other types of correctional institutions (%)
People in Group quarters - Nursing homes (%)
People in Group quarters - Hospitals/wards, hospices, and schools for the handicapped (%)
People in Group quarters - Hospitals/wards and hospices for chronically ill (%)
People in Group quarters - Hospices or homes for chronically ill (%)
People in Group quarters - Military hospitals or wards for chronically ill (%)
People in Group quarters - Other hospitals or wards for chronically ill (%)
People in Group quarters - Hospitals or wards for drug/alcohol abuse (%)
People in Group quarters - Mental (Psychiatric) hospitals or wards (%)
People in Group quarters - Schools, hospitals, or wards for the mentally retarded (%)
People in Group quarters - Schools, hospitals, or wards for the physically handicapped (%)
People in Group quarters - Institutions for the deaf (%)
People in Group quarters - Institutions for the blind (%)
People in Group quarters - Orthopedic wards and institutions for the physically handicapped (%)
People in Group quarters - Wards in general hospitals for patients who have no usual home elsewhere (%)
People in Group quarters - Wards in military hospitals for patients who have no usual home elsewhere (%)
People in Group quarters - Juvenile institutions (%)
People in Group quarters - Long-term care (%)
People in Group quarters - Homes for abused, dependent, and neglected children (%)
People in Group quarters - Residential treatment centers for emotionally disturbed children (%)
People in Group quarters - Training schools for juvenile delinquents (%)
People in Group quarters - Short-term care, detention or diagnostic centers for delinquent children (%)
People in Group quarters - Type of juvenile institution unknown (%)
People in Group quarters - Noninstitutionalized population (%)
People in Group quarters - College dormitories (includes college quarters off campus) (%)
People in Group quarters - Military quarters (%)
People in Group quarters - On base (%)
People in Group quarters - Barracks, unaccompanied personnel housing (UPH), (Enlisted/Officer), ;and similar group living quarters for military personnel (%)
People in Group quarters - Transient quarters for temporary residents (%)
People in Group quarters - Military ships (%)
People in Group quarters - Group homes (%)
People in Group quarters - Homes or halfway houses for drug/alcohol abuse (%)
People in Group quarters - Homes for the mentally ill (%)
People in Group quarters - Homes for the mentally retarded (%)
People in Group quarters - Homes for the physically handicapped (%)
People in Group quarters - Other group homes (%)
People in Group quarters - Religious group quarters (%)
People in Group quarters - Dormitories (%)
People in Group quarters - Agriculture workers' dormitories on farms (%)
People in Group quarters - Job Corps and vocational training facilities (%)
People in Group quarters - Other workers' dormitories (%)
People in Group quarters - Crews of maritime vessels (%)
People in Group quarters - Other nonhousehold living situations (%)
People in Group quarters - Other noninstitutional group quarters (%)
Residents speaking English at home (%)
Residents speaking English at home - Born in the United States (%)
Residents speaking English at home - Native, born elsewhere (%)
Residents speaking English at home - Foreign born (%)
Residents speaking Spanish at home (%)
Residents speaking Spanish at home - Born in the United States (%)
Residents speaking Spanish at home - Native, born elsewhere (%)
Residents speaking Spanish at home - Foreign born (%)
Residents speaking other language at home (%)
Residents speaking other language at home - Born in the United States (%)
Residents speaking other language at home - Native, born elsewhere (%)
Residents speaking other language at home - Foreign born (%)
Class of Workers - Employee of private company (%)
Class of Workers - Self-employed in own incorporated business (%)
Class of Workers - Private not-for-profit wage and salary workers (%)
Class of Workers - Local government workers (%)
Class of Workers - State government workers (%)
Class of Workers - Federal government workers (%)
Class of Workers - Self-employed workers in own not incorporated business and Unpaid family workers (%)
House heating fuel used in houses and condos - Utility gas (%)
House heating fuel used in houses and condos - Bottled, tank, or LP gas (%)
House heating fuel used in houses and condos - Electricity (%)
House heating fuel used in houses and condos - Fuel oil, kerosene, etc. (%)
House heating fuel used in houses and condos - Coal or coke (%)
House heating fuel used in houses and condos - Wood (%)
House heating fuel used in houses and condos - Solar energy (%)
House heating fuel used in houses and condos - Other fuel (%)
House heating fuel used in houses and condos - No fuel used (%)
House heating fuel used in apartments - Utility gas (%)
House heating fuel used in apartments - Bottled, tank, or LP gas (%)
House heating fuel used in apartments - Electricity (%)
House heating fuel used in apartments - Fuel oil, kerosene, etc. (%)
House heating fuel used in apartments - Coal or coke (%)
House heating fuel used in apartments - Wood (%)
House heating fuel used in apartments - Solar energy (%)
House heating fuel used in apartments - Other fuel (%)
House heating fuel used in apartments - No fuel used (%)
Armed forces status - In Armed Forces (%)
Armed forces status - Civilian (%)
Armed forces status - Civilian - Veteran (%)
Armed forces status - Civilian - Nonveteran (%)
Fatal accidents locations in years 2005-2021
Fatal accidents locations in 2005
Fatal accidents locations in 2006
Fatal accidents locations in 2007
Fatal accidents locations in 2008
Fatal accidents locations in 2009
Fatal accidents locations in 2010
Fatal accidents locations in 2011
Fatal accidents locations in 2012
Fatal accidents locations in 2013
Fatal accidents locations in 2014
Fatal accidents locations in 2015
Fatal accidents locations in 2016
Fatal accidents locations in 2017
Fatal accidents locations in 2018
Fatal accidents locations in 2019
Fatal accidents locations in 2020
Fatal accidents locations in 2021
Alcohol use - People drinking some alcohol every month (%)
Alcohol use - People not drinking at all (%)
Alcohol use - Average days/month drinking alcohol
Alcohol use - Average drinks/week
Alcohol use - Average days/year people drink much
Audiometry - Average condition of hearing (%)
Audiometry - People that can hear a whisper from across a quiet room (%)
Audiometry - People that can hear normal voice from across a quiet room (%)
Audiometry - Ears ringing, roaring, buzzing (%)
Audiometry - Had a job exposure to loud noise (%)
Audiometry - Had off-work exposure to loud noise (%)
Blood Pressure & Cholesterol - Has high blood pressure (%)
Blood Pressure & Cholesterol - Checking blood pressure at home (%)
Blood Pressure & Cholesterol - Frequently checking blood cholesterol (%)
Blood Pressure & Cholesterol - Has high cholesterol level (%)
Consumer Behavior - Money monthly spent on food at supermarket/grocery store
Consumer Behavior - Money monthly spent on food at other stores
Consumer Behavior - Money monthly spent on eating out
Consumer Behavior - Money monthly spent on carryout/delivered foods
Consumer Behavior - Income spent on food at supermarket/grocery store (%)
Consumer Behavior - Income spent on food at other stores (%)
Consumer Behavior - Income spent on eating out (%)
Consumer Behavior - Income spent on carryout/delivered foods (%)
Current Health Status - General health condition (%)
Current Health Status - Blood donors (%)
Current Health Status - Has blood ever tested for HIV virus (%)
Current Health Status - Left-handed people (%)
Dermatology - People using sunscreen (%)
Diabetes - Diabetics (%)
Diabetes - Had a blood test for high blood sugar (%)
Diabetes - People taking insulin (%)
Diet Behavior & Nutrition - Diet health (%)
Diet Behavior & Nutrition - Milk product consumption (# of products/month)
Diet Behavior & Nutrition - Meals not home prepared (#/week)
Diet Behavior & Nutrition - Meals from fast food or pizza place (#/week)
Diet Behavior & Nutrition - Ready-to-eat foods (#/month)
Diet Behavior & Nutrition - Frozen meals/pizza (#/month)
Drug Use - People that ever used marijuana or hashish (%)
Drug Use - Ever used hard drugs (%)
Drug Use - Ever used any form of cocaine (%)
Drug Use - Ever used heroin (%)
Drug Use - Ever used methamphetamine (%)
Health Insurance - People covered by health insurance (%)
Kidney Conditions-Urology - Avg. # of times urinating at night
Medical Conditions - People with asthma (%)
Medical Conditions - People with anemia (%)
Medical Conditions - People with psoriasis (%)
Medical Conditions - People with overweight (%)
Medical Conditions - Elderly people having difficulties in thinking or remembering (%)
Medical Conditions - People who ever received blood transfusion (%)
Medical Conditions - People having trouble seeing even with glass/contacts (%)
Medical Conditions - People with arthritis (%)
Medical Conditions - People with gout (%)
Medical Conditions - People with congestive heart failure (%)
Medical Conditions - People with coronary heart disease (%)
Medical Conditions - People with angina pectoris (%)
Medical Conditions - People who ever had heart attack (%)
Medical Conditions - People who ever had stroke (%)
Medical Conditions - People with emphysema (%)
Medical Conditions - People with thyroid problem (%)
Medical Conditions - People with chronic bronchitis (%)
Medical Conditions - People with any liver condition (%)
Medical Conditions - People who ever had cancer or malignancy (%)
Mental Health - People who have little interest in doing things (%)
Mental Health - People feeling down, depressed, or hopeless (%)
Mental Health - People who have trouble sleeping or sleeping too much (%)
Mental Health - People feeling tired or having little energy (%)
Mental Health - People with poor appetite or overeating (%)
Mental Health - People feeling bad about themself (%)
Mental Health - People who have trouble concentrating on things (%)
Mental Health - People moving or speaking slowly or too fast (%)
Mental Health - People having thoughts they would be better off dead (%)
Oral Health - Average years since last visit a dentist
Oral Health - People embarrassed because of mouth (%)
Oral Health - People with gum disease (%)
Oral Health - General health of teeth and gums (%)
Oral Health - Average days a week using dental floss/device
Oral Health - Average days a week using mouthwash for dental problem
Oral Health - Average number of teeth
Pesticide Use - Households using pesticides to control insects (%)
Pesticide Use - Households using pesticides to kill weeds (%)
Physical Activity - People doing vigorous-intensity work activities (%)
Physical Activity - People doing moderate-intensity work activities (%)
Physical Activity - People walking or bicycling (%)
Physical Activity - People doing vigorous-intensity recreational activities (%)
Physical Activity - People doing moderate-intensity recreational activities (%)
Physical Activity - Average hours a day doing sedentary activities
Physical Activity - Average hours a day watching TV or videos
Physical Activity - Average hours a day using computer
Physical Functioning - People having limitations keeping them from working (%)
Physical Functioning - People limited in amount of work they can do (%)
Physical Functioning - People that need special equipment to walk (%)
Physical Functioning - People experiencing confusion/memory problems (%)
Physical Functioning - People requiring special healthcare equipment (%)
Prescription Medications - Average number of prescription medicines taking
Preventive Aspirin Use - Adults 40+ taking low-dose aspirin (%)
Reproductive Health - Vaginal deliveries (%)
Reproductive Health - Cesarean deliveries (%)
Reproductive Health - Deliveries resulted in a live birth (%)
Reproductive Health - Pregnancies resulted in a delivery (%)
Reproductive Health - Women breastfeeding newborns (%)
Reproductive Health - Women that had a hysterectomy (%)
Reproductive Health - Women that had both ovaries removed (%)
Reproductive Health - Women that have ever taken birth control pills (%)
Reproductive Health - Women taking birth control pills (%)
Reproductive Health - Women that have ever used Depo-Provera or injectables (%)
Reproductive Health - Women that have ever used female hormones (%)
Sexual Behavior - People 18+ that ever had sex (vaginal, anal, or oral) (%)
Sexual Behavior - Males 18+ that ever had vaginal sex with a woman (%)
Sexual Behavior - Males 18+ that ever performed oral sex on a woman (%)
Sexual Behavior - Males 18+ that ever had anal sex with a woman (%)
Sexual Behavior - Males 18+ that ever had any sex with a man (%)
Sexual Behavior - Females 18+ that ever had vaginal sex with a man (%)
Sexual Behavior - Females 18+ that ever performed oral sex on a man (%)
Sexual Behavior - Females 18+ that ever had anal sex with a man (%)
Sexual Behavior - Females 18+ that ever had any kind of sex with a woman (%)
Sexual Behavior - Average age people first had sex
Sexual Behavior - Average number of female sex partners in lifetime (males 18+)
Sexual Behavior - Average number of female vaginal sex partners in lifetime (males 18+)
Sexual Behavior - Average age people first performed oral sex on a woman (18+)
Sexual Behavior - Average number of woman performed oral sex on in lifetime (18+)
Sexual Behavior - Average number of male sex partners in lifetime (males 18+)
Sexual Behavior - Average number of male anal sex partners in lifetime (males 18+)
Sexual Behavior - Average age people first performed oral sex on a man (18+)
Sexual Behavior - Average number of male oral sex partners in lifetime (18+)
Sexual Behavior - People using protection when performing oral sex (%)
Sexual Behavior - Average number of times people have vaginal or anal sex a year
Sexual Behavior - People having sex without condom (%)
Sexual Behavior - Average number of male sex partners in lifetime (females 18+)
Sexual Behavior - Average number of male vaginal sex partners in lifetime (females 18+)
Sexual Behavior - Average number of female sex partners in lifetime (females 18+)
Sexual Behavior - Circumcised males 18+ (%)
Sleep Disorders - Average hours sleeping at night
Sleep Disorders - People that has trouble sleeping (%)
Smoking-Cigarette Use - People smoking cigarettes (%)
Taste & Smell - People 40+ having problems with smell (%)
Taste & Smell - People 40+ having problems with taste (%)
Taste & Smell - People 40+ that ever had wisdom teeth removed (%)
Taste & Smell - People 40+ that ever had tonsils teeth removed (%)
Taste & Smell - People 40+ that ever had a loss of consciousness because of a head injury (%)
Taste & Smell - People 40+ that ever had a broken nose or other serious injury to face or skull (%)
Taste & Smell - People 40+ that ever had two or more sinus infections (%)
Weight - Average height (inches)
Weight - Average weight (pounds)
Weight - Average BMI
Weight - People that are obese (%)
Weight - People that ever were obese (%)
Weight - People trying to lose weight (%)
100%
urban population.
Estimated median house/condo value in 2022: $430,631
11575:
$430,631New York:
$400,400
According to our research of New York and other state lists, there were 21 registered sex offenders living in 11575 zip code as of May 07, 2024 . The ratio of all residents to sex offenders in zip code 11575 is 800 to 1.The ratio of registered sex offenders to all residents in this zip code is near the state average.
Median resident age: This zip code:
33.4 yearsNew York median age:
40.0 years
Average household size: This zip code:
4.0 peopleNew York:
2.5 people
Averages for the 2020 tax year for zip code 11575, filed in 2021:
Average Adjusted Gross Income (AGI) in 2020: $43,678 (Individual Income Tax Returns) Here:
$43,678State:
$90,930
Salary/wage: $43,311 (reported on 80.7% of returns )Here:
$43,311State:
$72,104
(% of AGI for various income ranges: 1142.1% for AGIs below $25k , 3624.0% for AGIs $25k-50k , 6914.5% for AGIs $50k-75k , 10098.4% for AGIs $75k-100k , 17671.0% for AGIs $100k-200k , 47416.7% for AGIs over 200k ) Taxable interest for individuals: $255 (reported on 21.3% of returns )This zip code:
$255New York:
$3,075
(% of AGI for various income ranges: 3.6% for AGIs below $25k , 3.6% for AGIs $25k-50k , 7.1% for AGIs $50k-75k , 22.1% for AGIs $75k-100k , 29.8% for AGIs $100k-200k , 73.3% for AGIs over 200k ) Ordinary dividends: $1,049 (reported on 4.6% of returns )(% of AGI for various income ranges: 1.3% for AGIs below $25k , 3.4% for AGIs $25k-50k , 4.6% for AGIs $50k-75k , 6.7% for AGIs $75k-100k , 58.8% for AGIs $100k-200k ) Net capital gain/loss in AGI: +$2,221 (reported on 4.7% of returns )Here:
+$2,221State:
+$44,925
(% of AGI for various income ranges: 2.5% for AGIs below $25k , 3.7% for AGIs $25k-50k , 2.5% for AGIs $50k-75k , 1.1% for AGIs $75k-100k , 127.1% for AGIs $100k-200k , 866.7% for AGIs over 200k ) Profit/loss from business: +$6,104 (reported on 20.7% of returns )Here:
+$6,104State:
+$14,940
(% of AGI for various income ranges: 305.8% for AGIs below $25k , 104.2% for AGIs $25k-50k , 113.4% for AGIs $50k-75k , 83.9% for AGIs $75k-100k , 141.5% for AGIs $100k-200k ) Taxable individual retirement arrangement distribution: $14,581 (reported on 2.0% of returns )11575:
$14,581New York:
$19,609
(% of AGI for various income ranges: 14.2% for AGIs below $25k , 22.2% for AGIs $25k-50k , 40.2% for AGIs $50k-75k , 59.3% for AGIs $75k-100k , 274.6% for AGIs $100k-200k ) Total itemized deductions: $25,161 (reported on 13.3% of returns )Here:
$25,161State:
$39,326
(% of AGI for various income ranges: 59.9% for AGIs below $25k , 222.0% for AGIs $25k-50k , 719.0% for AGIs $50k-75k , 1198.2% for AGIs $75k-100k , 2236.0% for AGIs $100k-200k , 4280.0% for AGIs over 200k ) Charity contributions: $5,581 (reported on 10.3% of returns )(% of AGI for various income ranges: 3.4% for AGIs below $25k , 29.1% for AGIs $25k-50k , 102.9% for AGIs $50k-75k , 186.0% for AGIs $75k-100k , 531.9% for AGIs $100k-200k , 896.7% for AGIs over 200k ) Taxes paid: $9,373 (reported on 13.2% of returns )(% of AGI for various income ranges: 22.7% for AGIs below $25k , 81.0% for AGIs $25k-50k , 284.6% for AGIs $50k-75k , 460.7% for AGIs $75k-100k , 780.8% for AGIs $100k-200k , 1303.3% for AGIs over 200k ) Earned income credit: $2,270 (reported on 21.7% of returns )(% of AGI for various income ranges: 124.6% for AGIs below $25k , 71.9% for AGIs $25k-50k , 1.0% for AGIs $50k-75k ) Percentage of individuals using paid preparers for their 2020 taxes: 92.7%(% for various income ranges: 89.1% for AGIs below $25k , 95.9% for AGIs $25k-50k , 94.8% for AGIs $50k-75k , 94.9% for AGIs $75k-100k , 92.6% for AGIs $100k-200k , 85.7% for AGIs over 200k )
Averages for the 2012 tax year for zip code 11575, filed in 2013:
Average Adjusted Gross Income (AGI) in 2012: $36,644 (Individual Income Tax Returns) Here:
$36,644State:
$77,088
Salary/wage: $36,386 (reported on 83.2% of returns )Here:
$36,386State:
$60,593
(% of AGI for various income ranges: 73.4% for AGIs below $25k , 87.0% for AGIs $25k-50k , 84.6% for AGIs $50k-75k , 84.4% for AGIs $75k-100k , 81.6% for AGIs $100k-200k , 78.4% for AGIs over 200k ) Taxable interest for individuals: $260 (reported on 19.7% of returns )This zip code:
$260New York:
$3,125
(% of AGI for various income ranges: 0.2% for AGIs below $25k , 0.1% for AGIs $25k-50k , 0.1% for AGIs $50k-75k , 0.2% for AGIs $75k-100k , 0.1% for AGIs $100k-200k ) Ordinary dividends: $865 (reported on 5.3% of returns )(% of AGI for various income ranges: 0.2% for AGIs below $25k , 0.1% for AGIs $25k-50k , 0.1% for AGIs $100k-200k ) Profit/loss from business: +$6,634 (reported on 17.7% of returns )Here:
+$6,634State:
+$16,168
(% of AGI for various income ranges: 15.2% for AGIs below $25k , 1.6% for AGIs $25k-50k , 0.7% for AGIs $50k-75k , 0.3% for AGIs $75k-100k , 0.4% for AGIs $100k-200k ) Taxable individual retirement arrangement distribution: $11,335 (reported on 3.0% of returns )11575:
$11,335New York:
$17,621
(% of AGI for various income ranges: 0.5% for AGIs below $25k , 0.7% for AGIs $25k-50k , 1.1% for AGIs $50k-75k , 1.3% for AGIs $75k-100k , 1.3% for AGIs $100k-200k ) Total itemized deductions: $22,332 (34% of AGI, reported on 32.5% of returns )Here:
$22,332State:
$34,985
Here:
33.6% of AGIState:
21.3% of AGI
(% of AGI for various income ranges: 9.2% for AGIs below $25k , 17.4% for AGIs $25k-50k , 23.2% for AGIs $50k-75k , 25.9% for AGIs $75k-100k , 23.8% for AGIs $100k-200k , 18.9% for AGIs over 200k ) Charity contributions: $3,512 (reported on 26.8% of returns )(% of AGI for various income ranges: 0.6% for AGIs below $25k , 2.1% for AGIs $25k-50k , 3.2% for AGIs $50k-75k , 3.5% for AGIs $75k-100k , 3.4% for AGIs $100k-200k , 2.4% for AGIs over 200k ) Taxes paid: $8,725 (reported on 32.3% of returns )11575:
$8,725State:
$18,656
(% of AGI for various income ranges: 3.5% for AGIs below $25k , 6.0% for AGIs $25k-50k , 8.8% for AGIs $50k-75k , 10.2% for AGIs $75k-100k , 10.2% for AGIs $100k-200k , 9.4% for AGIs over 200k ) Earned income credit: $2,429 (reported on 31.6% of returns )(% of AGI for various income ranges: 10.5% for AGIs below $25k , 1.4% for AGIs $25k-50k ) Percentage of individuals using paid preparers for their 2012 taxes: 74.5%(% for various income ranges: 76.1% for AGIs below $25k , 70.3% for AGIs $25k-50k , 73.8% for AGIs $50k-75k , 77.8% for AGIs $75k-100k , 78.0% for AGIs $100k-200k , 66.7% for AGIs over 200k )
Averages for the 2004 tax year for zip code 11575, filed in 2005:
Average Adjusted Gross Income (AGI) in 2004: $33,250 (Individual Income Tax Returns) Here:
$33,250State:
$59,519
Salary/wage: $32,081 (reported on 89.4% of returns )Here:
$32,081State:
$50,673
(% of AGI for various income ranges: 84.0% for AGIs below $10k , 86.5% for AGIs $10k-25k , 90.4% for AGIs $25k-50k , 86.3% for AGIs $50k-75k , 81.2% for AGIs $75k-100k , 81.1% for AGIs over 100k ) Taxable interest for individuals: $326 (reported on 30.8% of returns )This zip code:
$326New York:
$2,377
(% of AGI for various income ranges: 0.7% for AGIs below $10k , 0.4% for AGIs $10k-25k , 0.2% for AGIs $25k-50k , 0.3% for AGIs $50k-75k , 0.3% for AGIs $75k-100k , 0.3% for AGIs over 100k ) Taxable dividends: $613 (reported on 7.6% of returns )(% of AGI for various income ranges: 0.3% for AGIs below $10k , 0.1% for AGIs $10k-25k , 0.1% for AGIs $25k-50k , 0.2% for AGIs $50k-75k , 0.1% for AGIs $75k-100k , 0.3% for AGIs over 100k ) Net capital gain/loss: +$4,362 (reported on 4.5% of returns )Here:
+$4,362State:
+$23,581
(% of AGI for various income ranges: 0.2% for AGIs below $10k , 0.1% for AGIs $10k-25k , -0.1% for AGIs $25k-50k , -0.0% for AGIs $50k-75k , 0.5% for AGIs $75k-100k , 4.0% for AGIs over 100k ) Profit/loss from business: +$4,847 (reported on 10.9% of returns )Here:
+$4,847State:
+$13,809
(% of AGI for various income ranges: 17.2% for AGIs below $10k , 4.4% for AGIs $10k-25k , 0.7% for AGIs $25k-50k , 0.5% for AGIs $50k-75k , 0.2% for AGIs $75k-100k , 0.3% for AGIs over 100k ) IRA payment deduction: $1,812 (reported on 1.1% of returns )11575:
$1,812New York:
$3,115
Total itemized deductions: $20,047 (39% of AGI, reported on 42.3% of returns )Here:
$20,047State:
$25,864
Here:
38.5% of AGIState:
21.9% of AGI
(% of AGI for various income ranges: 11.1% for AGIs below $10k , 17.9% for AGIs $10k-25k , 26.6% for AGIs $25k-50k , 30.3% for AGIs $50k-75k , 27.9% for AGIs $75k-100k , 24.3% for AGIs over 100k ) Charity contributions deductions: $3,388 (6% of AGI, reported on 38.4% of returns )Here:
6.3% of AGIState:
3.6% of AGI
(% of AGI for various income ranges: 0.7% for AGIs below $10k , 2.1% for AGIs $10k-25k , 3.7% for AGIs $25k-50k , 4.9% for AGIs $50k-75k , 5.0% for AGIs $75k-100k , 4.6% for AGIs over 100k ) Total tax: $3,516 (reported on 64.8% of returns )11575:
$3,516State:
$11,730
(% of AGI for various income ranges: 3.1% for AGIs below $10k , 2.6% for AGIs $10k-25k , 4.8% for AGIs $25k-50k , 7.6% for AGIs $50k-75k , 9.7% for AGIs $75k-100k , 13.5% for AGIs over 100k ) Earned income credit: $1,813 (reported on 29.0% of returns )Percentage of individuals using paid preparers for their 2004 taxes: 73.8%(% for various income ranges: 67.1% for AGIs below $10k , 76.7% for AGIs $10k-25k , 73.4% for AGIs $25k-50k , 75.9% for AGIs $50k-75k , 75.2% for AGIs $75k-100k , 82.0% for AGIs over 100k )
Estimated median household income in 2022: This zip code:
$120,291New York:
$79,557
Nearest zip codes: 11553 ,
11520 ,
11566 ,
11510 ,
11556 ,
11549 .
Roosevelt Zip Code Map
Percentage of family households: This zip code:
56.4%New York:
41.3%
Percentage of households with unmarried partners: This zip code:
4.3%New York:
42.3%
No gay or lesbian households reported
Household received Food Stamps/SNAP in the past 12 months: 552Household did not receive Food Stamps/SNAP in the past 12 months: 4,059
Women who had a birth in the past 12 months: 393 (216 now married , 179 unmarried) Women who did not have a birth in the past 12 months: 4,398 (1,282 now married , 3,131 unmarried)
Housing units in zip code 11575 with a mortgage: 2,767 (238
second mortgage , 20
home equity loan , 155
both second mortgage and home equity loan )
Houses without a mortgage: 35
Median monthly owner costs for units with a mortgage: $2,782
Median monthly owner costs for units without a mortgage: $1,332
Residents with income below the poverty level in 2022:
This zip code:
7.7%Whole state:
14.3%
Residents with income below 50% of the poverty level in 2022:
This zip code:
5.9%Whole state:
6.8%
Median number of rooms in houses and condos: Median number of rooms in apartments: Notable locations in this zip code not listed on our city pages
Click to draw/clear zip code borders Notable location: (A) . Display/hide its location on the map
Churches in zip code 11575 include: (A) , Eglise De Dieu (B) , Ebenezer Seventh Day Adventist Church (C) , Church of God (D) , Calvary Baptist Church (E) , Eglise Pentecotiste De Pecheur (F) , Fellowship Missionary Baptist Church (G) , French Speaking Baptist Church of Nassau County (H) , Good Shepherd Lutheran Church (I) . Display/hide their locations on the map
Lake: (A) . Display/hide its location on the map
Parks in zip code 11575 include: (1) , Henry Street Park (2) , Centennial Park (3) . Display/hide their locations on the map
Year house built (houses)
0 2020 or later106 2010 to 201936 2000 to 2009264 1990 to 1999217 1980 to 198993 1970 to 1979668 1960 to 19691,310 1950 to 1959586 1940 to 19491,395 1939 or earlier
Zip code 11575 household income distribution in 2022 68 Less than $10,000112 $10,000 to $14,99937 $15,000 to $19,999147 $20,000 to $24,99955 $30,000 to $34,999140 $35,000 to $39,99973 $40,000 to $44,999410 $45,000 to $49,99970 $50,000 to $59,999228 $60,000 to $74,999418 $75,000 to $99,999553 $100,000 to $124,999691 $125,000 to $149,999628 $150,000 to $199,999919 $200,000 or moreEstimate of home value of owner-occupied houses/condos in 2022 in zip code 11575 47 $40,000 to $49,9994 $90,000 to $99,999340 $200,000 to $249,999286 $250,000 to $299,999985 $300,000 to $399,999982 $400,000 to $499,999797 $500,000 to $749,999109 $750,000 to $999,99911 $2,000,000 or moreRent paid by renters in 2022 in zip code 11575 71 $1,000 to $1,24961 $1,250 to $1,499275 $1,500 to $1,999396 $2,000 to $2,49984 $2,500 to $2,99970 $3,000 to $3,49932 $3,500 or more112 No cash rent
Median gross rent in 2022: $2,569.
Median price asked for vacant for-sale houses and condos in 2022: $524,516.
Estimated median house (or condo) value in 2022 for: White Non-Hispanic householders: $445,422Black or African American householders: $428,397American Indian or Alaska Native householders: $399,652Some other race householders: $453,515Two or more races householders: $454,353Hispanic or Latino householders: $462,446Estimated median house or condo value in 2022: $430,631
11575:
$430,631New York:
$400,400
Lower value quartile - upper value quartile: $342,127 - $506,641
Mean price in 2022: Detached houses: $835,207Here:
$835,207State:
$476,719
Townhouses or other attached units: $903,454Here:
$903,454State:
$699,270
In 2-unit structures: $617,412Here:
$617,412State:
$713,077
In 3-to-4-unit structures: $288,066Here:
$288,066State:
$764,568
In 5-or-more-unit structures: $450,684Here:
$450,684State:
$912,009
Mobile homes: $1,988,032Here:
$1,988,032State:
$88,925
Housing units in structures:
One, detached: 3,986One, attached: 11Two: 3863 or 4: 3035 to 9: 2250 or more: 6Unemployment : 3.8%
Means of transportation to work in zip code 11575 60.7% 5,995 Drove a car alone13.1% 1,291 Carpooled7.2% 711 Bus or trolley bus3.3% 329 Streetcar or trolley car3.2% 313 Subway or elevated0.3% 31 Bicycle1.3% 131 Walked1.5% 146 Other means8.7% 857 Worked at homeTravel time to work (commute) in zip code 11575 219 Less than 5 minutes497 5 to 9 minutes234 10 to 14 minutes1,116 15 to 19 minutes1,300 20 to 24 minutes820 25 to 29 minutes1,764 30 to 34 minutes181 35 to 39 minutes264 40 to 44 minutes540 45 to 59 minutes1,388 60 to 89 minutes556 90 or more minutes
Percentage of zip code residents living and working in this county: 64.1%
Household type by relationship:
Households: 18,798
Male householders: 2,176 (115 living alone ), Female householders: 2,460 (305 living alone )2,083 spouses (2,073 opposite-sex spouses ), 382 unmarried partners , (367 opposite-sex unmarried partners ), 6,478 children (5,924 natural , 170 adopted , 367 stepchildren ), 1,712 grandchildren , 444 brothers or sisters , 331 parents , 0 foster children , 1,211 other relatives , 978 non-relatives In group quarters: 154 (-1 institutionalized population )
Size of family households: 691 2-persons , 556 3-persons , 1,193 4-persons , 536 5-persons , 321 6-persons , 660 7-or-more-persons
Size of nonfamily households: 419 1-person , 93 2-persons , 38 4-persons , 42 7-or-more-persons
1,569 married couples with children. single-parent households (241 men , 692 women ).
58.3% of residents of 11575 zip code speak English at home. of residents speak Spanish at home (38% very well, 24% well, 30% not well, 8% not at all ).of residents speak other Indo-European language at home (62% very well, 34% well, 4% not well ).of residents speak other language at home (100% very well ).
Foreign born population: 6,723 (35.8%)
(57.7%
of them are naturalized citizens )
This zip code:
35.8%Whole state:
22.7%
34% Costa Rica 14% Haiti 7% Grenada 6% Dominica 5% St. Vincent and the Grenadines 5% Colombia 5% Guatemala 10% Jamaican 4% Haitian 2% American 2% African 1% Trinidadian and Tobagonian 1% Guyanese 0% West Indian
Year of entry for the foreign-born population
1,829 2010 or later 2,005 2000 to 2009 1,272 1990 to 1999 2,170 Before 1990
Facilities with environmental interests located in this zip code:
HEMPSTEAD TOWN OF HIGHWAY DEPT (390 EAST CLINTON AVENUE in ROOSEVELT, NY)
(Integrated Compliance Information System) - ICIS-02-1995-0080, FORMAL ENFORCEMENT ACTION Conditionally Exempt Small Quantity Generators, less than 100 kg/month of hazardous waste (Resource Conservation and Recovery Act (tracking hazardous waste)) - notification HAZARDOUS WASTE BIENNIAL REPORTER (Resource Conservation and Recovery Act (tracking hazardous waste)) Business SIC classification: REGULATION AND ADMINISTRATION OF TRANSPORTATION PROGRAMSOrganizations: TOWN OF HEMPSTEAD (CONTACT/OWNER)
HARRY D. DANIELS SCHOOL ( in ROOSEVELT, NY)
(National Center for Education Statistics) - STATE ID-280208030001 Organizations: ROOSEVELT UFSD (SCHOOL DISTRICT)
J D TRANSPORTATION (43 DEBOVISE AVE in ROOSEVELT, NY)
(Resource Conservation and Recovery Act (tracking hazardous waste))
AMOCO GAS STATION (533 NASSAU RD in ROOSEVELT, NY)
(Resource Conservation and Recovery Act (tracking hazardous waste))
ISLAND UNIFORM RENTAL (20 W CENNTENIAL AVE in ROOSEVELT, NY)
(Resource Conservation and Recovery Act (tracking hazardous waste))
Housing units lacking complete plumbing facilities: 1.2%
Housing units lacking complete kitchen facilities: 0.9%
70.4% Utility gas 25.4% Fuel oil, kerosene, etc. 2.1% Electricity 1.3% Bottled, tank, or LP gas 0.9% Other fuel
Population in 1990: 14,595. Population change in the 1990s: +1,380 (+9.5%).
Place of birth for U.S.-born residents:
This state: 10,529Northeast: 102Midwest: 73South: 688West: 77
69% of the 11575 zip code residents lived in the same house 5 years ago.
Out of people who lived in different houses, 64% lived in this county.
Out of people who lived in different counties, 50% lived in New York.
91% of the 11575 zip code residents lived in the same house 1 year ago.
Out of people who lived in different houses, 54% moved from this county.
Out of people who lived in different houses, 39% moved from different county within same state.
Out of people who lived in different houses, 6% moved from different state.
Out of people who lived in different houses, 1% moved from abroad.
Private vs. public school enrollment:
Students in private schools in grades 1 to 8 (elementary and middle school): 47
Students in private schools in grades 9 to 12 (high school): 59
Students in private undergraduate colleges: 299
Occupation by median earnings in the past 12 months ($)
87,403 Architecture and engineering occupations 85,563 Computer and mathematical occupations 79,029 Business and financial operations occupations 67,049 Law enforcement workers including supervisors 66,270 Installation, maintenance, and repair occupations 65,126 Health diagnosing and treating practitioners and other technical occupations
Companies with federal contracts located in this zip code:
FIELD ASSOCIATES PC, INC (379 NASSAU RD in ROOSEVELT, NY; small business) in 2 contracts from 2003 to 2005
$477,410 with Army for Architect - Engineer Services (including landscaping, interior layout, and designing). Signed on 2003-01-10. Completion date: 2003-11-03.
, same as above. Signed on 2005-07-05. Completion date: 2003-11-03.
J W MACHINE COMPANY (8 GOMBERT PL in ROOSEVELT, NY; small business) in 19 contracts from 2003 to 2006
Contracts for Nails, Machine Keys, and Pins, Antennas, Waveguides, and Related Equipment, Studs, Hardware, Commercial, and more by Defense Logistics AgencySigned by year: 2000: $0; 2001: $0; 2002: $0; 2003: $48,750; 2004: $3,200; 2005: $80,150; 2006: $44,486.
Biggest contracts: with Defense Logistics Agency for Nails, Machine Keys, and Pins. Signed on 2003-11-05. Completion date: 2003-11-10.
with Defense Logistics Agency for Antennas, Waveguides, and Related Equipment. Signed on 2005-05-25. Completion date: 2005-08-16.
with Defense Logistics Agency for Nails, Machine Keys, and Pins. Signed on 2006-02-28. Completion date: 2006-11-06.
with Defense Logistics Agency for Studs. Signed on 2005-02-11. Completion date: 2005-07-12.
Top industries in this zip code by the number of employees in 2005:
Health Care and Social Assistance: All Other Outpatient Care Centers (500-999 employees: 1 establishment, 1-4 employees: 1 establishment)Health Care and Social Assistance: Child Day Care Services (50-99: 1, 20-49: 1, 10-19: 2, 5-9: 2, 1-4: 4)Wholesale Trade: Other Miscellaneous Nondurable Goods Merchant Wholesalers (20-49: 2, 1-4: 1)Accommodation and Food Services: Limited-Service Restaurants (20-49: 1, 1-4: 4)Educational Services: Elementary and Secondary Schools (20-49: 1, 5-9: 1)Accommodation and Food Services: Food Service Contractors (20-49: 1, 1-4: 1)Administrative and Support and Waste Management and Remediation Services: Packaging and Labeling Services (20-49: 1)Information: Newspaper Publishers (20-49: 1)
People in group quarters in 2010:
56 people in group homes intended for adults
46 people in emergency and transitional shelters (with sleeping facilities) for people experiencing homelessness
26 people in correctional facilities intended for juveniles
6 people in correctional residential facilities
6 people in residential treatment centers for adults
3 people in other noninstitutional facilities
People in group quarters in 2000:
61 people in other noninstitutional group quarters
23 people in homes for the physically handicapped
14 people in homes or halfway houses for drug/alcohol abuse
11 people in religious group quarters
8 people in other group homes
Fatal accident statistics in 2014:
Fatal accident count: 2Vehicles involved in fatal accidents: 2Fatal accidents caused by drunken drivers: 0Fatalities: 2Persons involved in fatal accidents: 4Pedestrians involved in fatal accidents: 2
Fatal accident statistics in 2013:
Fatal accident count: 1Vehicles involved in fatal accidents: 1Fatal accidents caused by drunken drivers: 0Fatalities: 1Persons involved in fatal accidents: 1Pedestrians involved in fatal accidents: 1
Home Mortgage Disclosure Act Aggregated Statistics For Year 2009(Based on 1 full and 4 partial tracts) A) FHA, FSA/RHS & VA B) Conventional C) Refinancings D) Home Improvement Loans E) Loans on Dwellings For 5+ Families F) Non-occupant Loans on Number Average Value Number Average Value Number Average Value Number Average Value Number Average Value Number Average Value
LOANS ORIGINATED 55 $237,709 54 $205,374 139 $229,082 11 $102,863 2 $194,870 12 $171,141 APPLICATIONS APPROVED, NOT ACCEPTED 12 $239,667 6 $142,378 24 $244,676 11 $15,885 0 $0 3 $66,660 APPLICATIONS DENIED 43 $249,744 24 $169,521 175 $245,775 22 $83,987 0 $0 11 $164,800 APPLICATIONS WITHDRAWN 34 $255,681 14 $246,201 56 $248,630 1 $80,000 0 $0 6 $188,908 FILES CLOSED FOR INCOMPLETENESS 12 $307,400 8 $250,645 27 $236,430 0 $0 0 $0 2 $170,855
Aggregated Statistics For Year 2008(Based on 1 full and 4 partial tracts) A) FHA, FSA/RHS & VA B) Conventional C) Refinancings D) Home Improvement Loans F) Non-occupant Loans on Number Average Value Number Average Value Number Average Value Number Average Value Number Average Value
LOANS ORIGINATED 34 $326,407 73 $276,396 209 $264,599 45 $77,487 29 $241,353 APPLICATIONS APPROVED, NOT ACCEPTED 7 $205,967 31 $304,278 56 $270,518 25 $33,676 4 $321,960 APPLICATIONS DENIED 9 $323,339 96 $317,324 293 $292,378 112 $61,877 26 $250,974 APPLICATIONS WITHDRAWN 14 $301,012 22 $262,093 103 $288,816 6 $128,943 9 $195,111 FILES CLOSED FOR INCOMPLETENESS 2 $347,375 14 $331,960 53 $284,632 5 $164,718 8 $232,489
Aggregated Statistics For Year 2007(Based on 1 full and 4 partial tracts) A) FHA, FSA/RHS & VA B) Conventional C) Refinancings D) Home Improvement Loans E) Loans on Dwellings For 5+ Families F) Non-occupant Loans on Number Average Value Number Average Value Number Average Value Number Average Value Number Average Value Number Average Value
LOANS ORIGINATED 9 $375,117 341 $261,637 552 $271,708 118 $121,318 0 $0 72 $285,610 APPLICATIONS APPROVED, NOT ACCEPTED 2 $346,435 144 $265,605 165 $277,575 35 $131,572 0 $0 14 $329,353 APPLICATIONS DENIED 6 $314,663 453 $279,672 682 $293,497 198 $126,721 0 $0 93 $284,350 APPLICATIONS WITHDRAWN 4 $277,242 75 $294,740 235 $265,716 46 $192,753 2 $370,190 20 $228,263 FILES CLOSED FOR INCOMPLETENESS 0 $0 45 $309,742 64 $312,640 4 $306,118 0 $0 7 $270,403
Aggregated Statistics For Year 2006(Based on 1 full and 4 partial tracts) A) FHA, FSA/RHS & VA B) Conventional C) Refinancings D) Home Improvement Loans F) Non-occupant Loans on Number Average Value Number Average Value Number Average Value Number Average Value Number Average Value
LOANS ORIGINATED 14 $364,084 970 $216,739 891 $248,871 110 $151,637 124 $245,097 APPLICATIONS APPROVED, NOT ACCEPTED 2 $330,430 149 $206,443 166 $230,122 23 $109,117 19 $293,172 APPLICATIONS DENIED 2 $339,845 681 $229,110 692 $262,539 202 $115,428 116 $276,139 APPLICATIONS WITHDRAWN 10 $299,223 286 $226,966 430 $245,085 43 $175,301 50 $238,041 FILES CLOSED FOR INCOMPLETENESS 0 $0 62 $197,363 138 $269,986 6 $106,692 5 $169,684
Aggregated Statistics For Year 2005(Based on 1 full and 4 partial tracts) A) FHA, FSA/RHS & VA B) Conventional C) Refinancings D) Home Improvement Loans E) Loans on Dwellings For 5+ Families F) Non-occupant Loans on G) Loans On Manufactured Number Average Value Number Average Value Number Average Value Number Average Value Number Average Value Number Average Value Number Average Value
LOANS ORIGINATED 9 $287,131 808 $210,119 1,148 $233,894 105 $113,496 0 $0 167 $233,172 0 $0 APPLICATIONS APPROVED, NOT ACCEPTED 4 $253,975 133 $216,343 180 $242,549 15 $131,575 0 $0 23 $253,838 0 $0 APPLICATIONS DENIED 0 $0 404 $204,198 832 $230,989 142 $93,961 0 $0 94 $192,117 3 $84,083 APPLICATIONS WITHDRAWN 5 $273,586 249 $210,837 562 $220,174 42 $158,211 2 $282,420 71 $201,184 0 $0 FILES CLOSED FOR INCOMPLETENESS 0 $0 59 $213,618 257 $236,899 3 $55,103 0 $0 15 $205,472 0 $0
Aggregated Statistics For Year 2004(Based on 1 full and 4 partial tracts) A) FHA, FSA/RHS & VA B) Conventional C) Refinancings D) Home Improvement Loans F) Non-occupant Loans on G) Loans On Manufactured Number Average Value Number Average Value Number Average Value Number Average Value Number Average Value Number Average Value
LOANS ORIGINATED 38 $248,436 588 $206,228 1,041 $200,090 97 $131,159 188 $194,535 4 $12,238 APPLICATIONS APPROVED, NOT ACCEPTED 2 $198,000 158 $219,979 243 $200,457 35 $61,397 30 $185,319 0 $0 APPLICATIONS DENIED 8 $214,011 222 $199,498 689 $199,371 124 $79,860 71 $183,141 2 $138,385 APPLICATIONS WITHDRAWN 7 $257,629 161 $196,589 564 $192,108 35 $117,018 55 $186,535 0 $0 FILES CLOSED FOR INCOMPLETENESS 2 $273,005 37 $240,741 182 $214,317 0 $0 6 $203,130 0 $0
Aggregated Statistics For Year 2003(Based on 1 full and 4 partial tracts) A) FHA, FSA/RHS & VA B) Conventional C) Refinancings D) Home Improvement Loans F) Non-occupant Loans on Number Average Value Number Average Value Number Average Value Number Average Value Number Average Value
LOANS ORIGINATED 95 $221,626 355 $193,571 1,135 $162,556 44 $36,545 136 $145,423 APPLICATIONS APPROVED, NOT ACCEPTED 11 $225,013 91 $193,000 263 $160,309 24 $28,386 31 $150,487 APPLICATIONS DENIED 16 $238,394 194 $197,872 836 $163,830 63 $37,396 87 $141,918 APPLICATIONS WITHDRAWN 28 $225,654 82 $174,856 432 $166,768 20 $40,144 50 $135,742 FILES CLOSED FOR INCOMPLETENESS 4 $167,060 17 $190,927 66 $165,075 4 $61,145 7 $172,850
Aggregated Statistics For Year 2002(Based on 1 full and 4 partial tracts) A) FHA, FSA/RHS & VA B) Conventional C) Refinancings D) Home Improvement Loans F) Non-occupant Loans on Number Average Value Number Average Value Number Average Value Number Average Value Number Average Value
LOANS ORIGINATED 84 $187,699 253 $161,743 683 $140,971 60 $27,754 78 $132,589 APPLICATIONS APPROVED, NOT ACCEPTED 14 $180,604 81 $154,942 193 $145,869 31 $22,119 18 $100,626 APPLICATIONS DENIED 29 $189,096 112 $168,028 553 $178,407 103 $27,905 35 $118,850 APPLICATIONS WITHDRAWN 32 $176,677 62 $168,267 475 $144,146 74 $46,947 16 $146,112 FILES CLOSED FOR INCOMPLETENESS 0 $0 14 $200,135 242 $144,366 6 $19,770 8 $132,972
Aggregated Statistics For Year 2001(Based on 1 full and 4 partial tracts) A) FHA, FSA/RHS & VA B) Conventional C) Refinancings D) Home Improvement Loans E) Loans on Dwellings For 5+ Families F) Non-occupant Loans on Number Average Value Number Average Value Number Average Value Number Average Value Number Average Value Number Average Value
LOANS ORIGINATED 126 $183,553 165 $144,594 472 $124,505 65 $47,169 4 $166,350 54 $105,075 APPLICATIONS APPROVED, NOT ACCEPTED 7 $159,774 41 $120,355 195 $103,952 33 $33,108 0 $0 17 $117,314 APPLICATIONS DENIED 39 $160,699 99 $150,995 602 $116,524 150 $29,018 2 $114,855 53 $106,914 APPLICATIONS WITHDRAWN 31 $167,729 48 $149,727 490 $128,859 50 $33,613 0 $0 11 $109,347 FILES CLOSED FOR INCOMPLETENESS 2 $197,435 12 $137,626 74 $127,167 3 $11,497 0 $0 2 $124,345
Aggregated Statistics For Year 2000(Based on 1 full and 4 partial tracts) A) FHA, FSA/RHS & VA B) Conventional C) Refinancings D) Home Improvement Loans E) Loans on Dwellings For 5+ Families F) Non-occupant Loans on Number Average Value Number Average Value Number Average Value Number Average Value Number Average Value Number Average Value
LOANS ORIGINATED 129 $155,952 122 $136,295 278 $100,510 91 $20,326 0 $0 12 $112,702 APPLICATIONS APPROVED, NOT ACCEPTED 15 $155,330 55 $128,236 93 $109,305 85 $22,918 0 $0 9 $121,787 APPLICATIONS DENIED 34 $170,162 136 $118,036 547 $105,056 175 $26,254 2 $122,380 31 $103,678 APPLICATIONS WITHDRAWN 49 $549,567 62 $122,670 464 $89,113 19 $46,682 2 $28,475 20 $112,010 FILES CLOSED FOR INCOMPLETENESS 10 $143,462 22 $126,097 119 $117,231 9 $15,179 0 $0 8 $129,618
Aggregated Statistics For Year 1999(Based on 1 full and 2 partial tracts) A) FHA, FSA/RHS & VA B) Conventional C) Refinancings D) Home Improvement Loans E) Loans on Dwellings For 5+ Families F) Non-occupant Loans on Number Average Value Number Average Value Number Average Value Number Average Value Number Average Value Number Average Value
LOANS ORIGINATED 83 $140,704 70 $118,918 212 $95,288 77 $11,689 8 $131,712 20 $88,744 APPLICATIONS APPROVED, NOT ACCEPTED 3 $136,313 36 $115,292 157 $106,525 34 $28,286 0 $0 17 $102,625 APPLICATIONS DENIED 33 $135,151 67 $125,734 257 $92,037 127 $26,050 4 $96,442 24 $85,324 APPLICATIONS WITHDRAWN 20 $146,904 30 $115,065 216 $79,899 16 $54,307 4 $151,632 13 $89,028 FILES CLOSED FOR INCOMPLETENESS 5 $138,694 3 $108,083 55 $116,412 1 $32,900 1 $181,980 7 $87,541
Detailed HMDA statistics for the following Tracts:
4139.00
,
4140.01 ,
4140.02
Private Mortgage Insurance Companies Aggregated Statistics For Year 2009(Based on 1 full and 4 partial tracts) A) Conventional B) Refinancings Number Average Value Number Average Value
LOANS ORIGINATED 16 $269,388 0 $0 APPLICATIONS APPROVED, NOT ACCEPTED 13 $305,020 2 $316,085 APPLICATIONS DENIED 0 $0 2 $368,290 APPLICATIONS WITHDRAWN 8 $301,890 0 $0 FILES CLOSED FOR INCOMPLETENESS 0 $0 0 $0
Aggregated Statistics For Year 2008(Based on 1 full and 4 partial tracts) A) Conventional B) Refinancings C) Non-occupant Loans on Number Average Value Number Average Value Number Average Value
LOANS ORIGINATED 50 $360,744 20 $359,908 3 $356,900 APPLICATIONS APPROVED, NOT ACCEPTED 73 $368,575 35 $363,815 6 $325,428 APPLICATIONS DENIED 40 $320,639 4 $328,548 11 $327,852 APPLICATIONS WITHDRAWN 9 $369,306 16 $349,674 2 $360,555 FILES CLOSED FOR INCOMPLETENESS 11 $362,325 3 $371,710 5 $374,574
Aggregated Statistics For Year 2007(Based on 1 full and 4 partial tracts) A) Conventional B) Refinancings C) Non-occupant Loans on Number Average Value Number Average Value Number Average Value
LOANS ORIGINATED 84 $361,112 54 $364,319 6 $366,850 APPLICATIONS APPROVED, NOT ACCEPTED 19 $331,025 10 $377,993 5 $264,620 APPLICATIONS DENIED 10 $389,855 2 $392,565 8 $368,058 APPLICATIONS WITHDRAWN 15 $426,273 3 $371,030 0 $0 FILES CLOSED FOR INCOMPLETENESS 0 $0 0 $0 0 $0
Aggregated Statistics For Year 2006(Based on 1 full and 4 partial tracts) A) Conventional B) Refinancings C) Non-occupant Loans on Number Average Value Number Average Value Number Average Value
LOANS ORIGINATED 32 $335,597 4 $315,730 3 $242,973 APPLICATIONS APPROVED, NOT ACCEPTED 13 $299,425 6 $292,390 2 $313,485 APPLICATIONS DENIED 1 $255,000 0 $0 0 $0 APPLICATIONS WITHDRAWN 2 $346,435 2 $249,470 0 $0 FILES CLOSED FOR INCOMPLETENESS 9 $153,759 0 $0 0 $0
Aggregated Statistics For Year 2005(Based on 1 full and 4 partial tracts) A) Conventional B) Refinancings C) Non-occupant Loans on Number Average Value Number Average Value Number Average Value
LOANS ORIGINATED 42 $289,571 16 $278,618 0 $0 APPLICATIONS APPROVED, NOT ACCEPTED 13 $261,206 8 $282,818 0 $0 APPLICATIONS DENIED 0 $0 0 $0 0 $0 APPLICATIONS WITHDRAWN 6 $254,742 2 $243,945 2 $205,975 FILES CLOSED FOR INCOMPLETENESS 1 $207,000 0 $0 1 $207,000
Aggregated Statistics For Year 2004(Based on 1 full and 4 partial tracts) A) Conventional B) Refinancings C) Non-occupant Loans on Number Average Value Number Average Value Number Average Value
LOANS ORIGINATED 127 $242,983 25 $242,100 23 $182,634 APPLICATIONS APPROVED, NOT ACCEPTED 51 $237,779 12 $213,823 8 $202,636 APPLICATIONS DENIED 4 $174,105 1 $270,000 0 $0 APPLICATIONS WITHDRAWN 4 $234,715 1 $194,000 2 $193,930 FILES CLOSED FOR INCOMPLETENESS 2 $289,950 0 $0 0 $0
Aggregated Statistics For Year 2003(Based on 1 full and 4 partial tracts) A) Conventional B) Refinancings C) Non-occupant Loans on Number Average Value Number Average Value Number Average Value
LOANS ORIGINATED 141 $211,913 48 $190,470 16 $192,652 APPLICATIONS APPROVED, NOT ACCEPTED 50 $213,347 20 $196,454 0 $0 APPLICATIONS DENIED 21 $237,342 0 $0 4 $262,910 APPLICATIONS WITHDRAWN 18 $198,216 6 $212,172 0 $0 FILES CLOSED FOR INCOMPLETENESS 0 $0 3 $153,197 0 $0
Aggregated Statistics For Year 2002(Based on 1 full and 4 partial tracts) A) Conventional B) Refinancings C) Non-occupant Loans on Number Average Value Number Average Value Number Average Value
LOANS ORIGINATED 123 $185,748 38 $177,519 11 $184,129 APPLICATIONS APPROVED, NOT ACCEPTED 49 $159,560 38 $165,435 6 $158,507 APPLICATIONS DENIED 14 $230,103 2 $213,570 2 $180,750 APPLICATIONS WITHDRAWN 11 $172,125 7 $189,104 2 $166,630 FILES CLOSED FOR INCOMPLETENESS 2 $95,870 0 $0 0 $0
Aggregated Statistics For Year 2001(Based on 1 full and 4 partial tracts) A) Conventional B) Refinancings C) Non-occupant Loans on Number Average Value Number Average Value Number Average Value
LOANS ORIGINATED 105 $152,592 38 $158,775 20 $130,782 APPLICATIONS APPROVED, NOT ACCEPTED 32 $155,236 19 $166,387 6 $134,307 APPLICATIONS DENIED 7 $138,093 7 $146,144 5 $139,134 APPLICATIONS WITHDRAWN 1 $149,000 2 $173,220 1 $149,000 FILES CLOSED FOR INCOMPLETENESS 2 $131,795 2 $168,510 0 $0
Aggregated Statistics For Year 2000(Based on 1 full and 4 partial tracts) A) Conventional B) Refinancings C) Non-occupant Loans on Number Average Value Number Average Value Number Average Value
LOANS ORIGINATED 62 $138,786 28 $122,534 7 $101,579 APPLICATIONS APPROVED, NOT ACCEPTED 18 $142,552 10 $127,568 1 $84,000 APPLICATIONS DENIED 5 $149,270 7 $133,089 0 $0 APPLICATIONS WITHDRAWN 2 $121,500 0 $0 0 $0 FILES CLOSED FOR INCOMPLETENESS 2 $136,505 0 $0 0 $0
Aggregated Statistics For Year 1999(Based on 1 full and 2 partial tracts) A) Conventional B) Refinancings C) Non-occupant Loans on Number Average Value Number Average Value Number Average Value
LOANS ORIGINATED 36 $126,209 14 $131,066 2 $135,445 APPLICATIONS APPROVED, NOT ACCEPTED 7 $108,486 2 $125,790 1 $41,820 APPLICATIONS DENIED 1 $133,830 1 $125,290 0 $0 APPLICATIONS WITHDRAWN 1 $158,930 1 $130,120 0 $0 FILES CLOSED FOR INCOMPLETENESS 0 $0 0 $0 0 $0
Detailed PMIC statistics for the following Tracts:
4139.00
,
4140.01 ,
4140.02
2002 - 2018 National Fire Incident Reporting System (NFIRS) incidents See full 2006 National Fire Incident Reporting System statistics for zip code 11575, New York
Most common first names in zip code 11575 among deceased individuals Name Count Lived (average)
John 81 73.4 years James 73 69.2 years William 71 67.6 years Mary 57 75.5 years Robert 45 65.2 years Charles 42 75.6 years George 38 67.2 years Joseph 35 70.7 years Willie 31 67.0 years Edward 30 69.7 years
Most common last names in zip code 11575 among deceased individuals Last name Count Lived (average)
Williams 44 64.1 years Smith 43 69.2 years Jones 39 67.8 years Brown 36 65.0 years Johnson 32 71.0 years Robinson 23 63.4 years Jackson 21 66.6 years Davis 17 64.4 years Thomas 16 71.6 years Moore 15 66.7 years
Businesses in zip code 11575
Name Count Name Count
Baskin-Robbins 1 FedEx 1 Dunkin Donuts 1 McDonald's 1

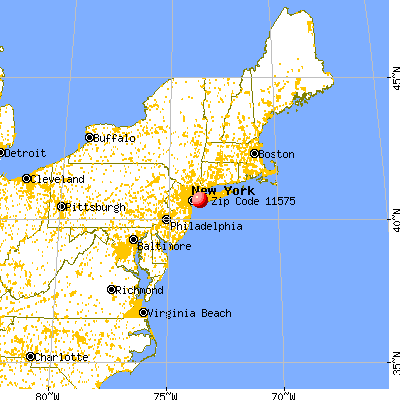


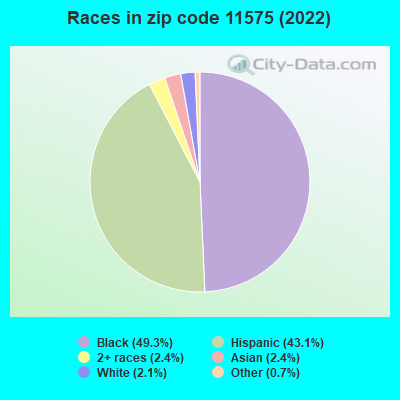


 Nearest zip codes: 11553, 11520, 11566, 11510, 11556, 11549.
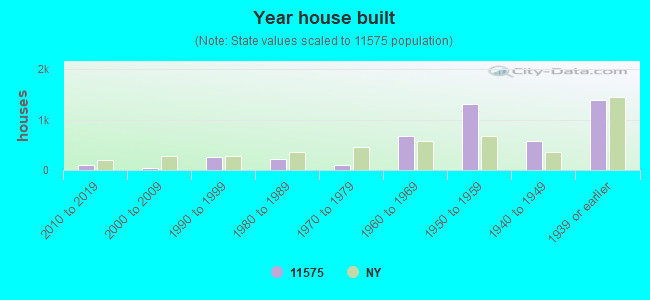

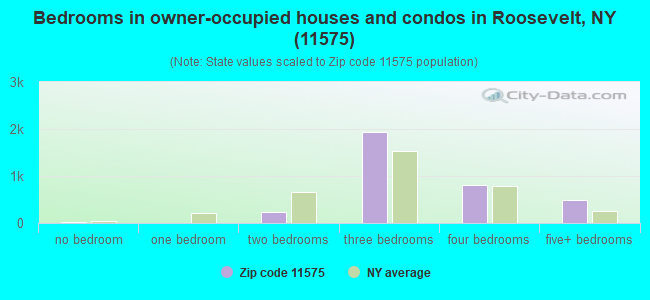
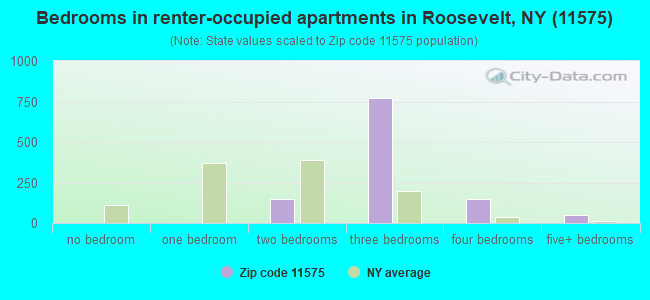
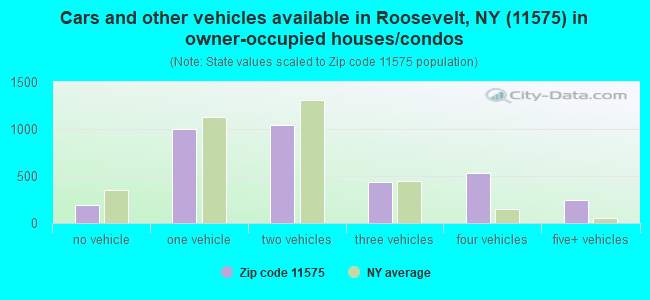
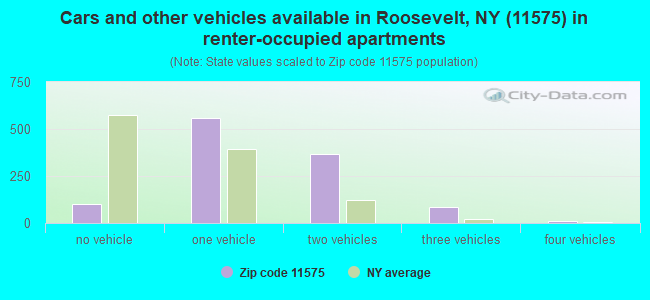


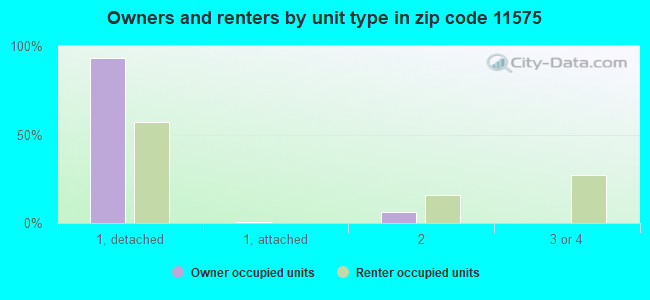
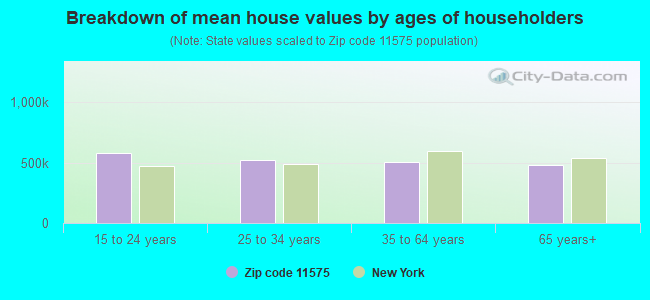


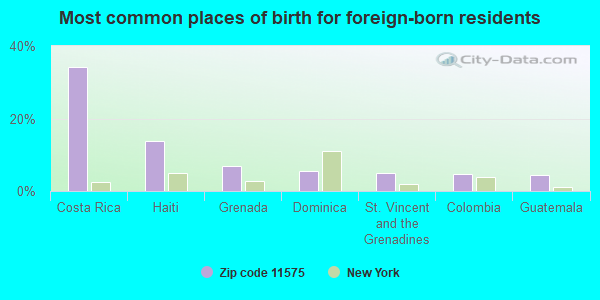
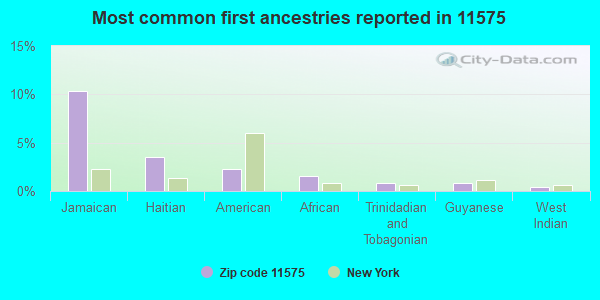
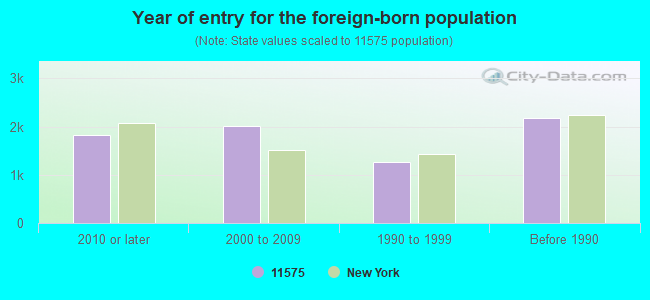


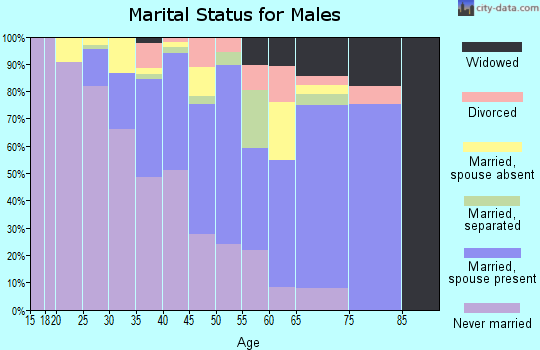

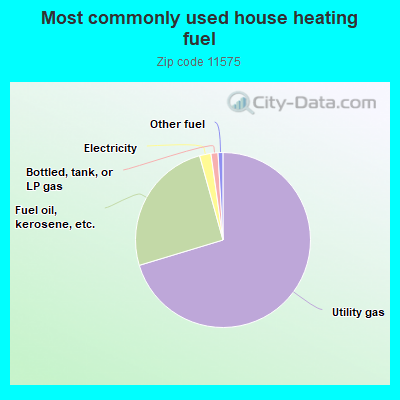
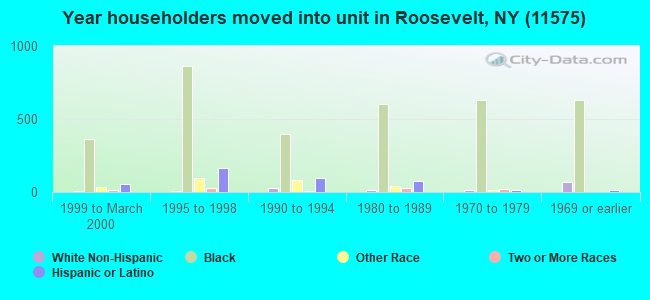
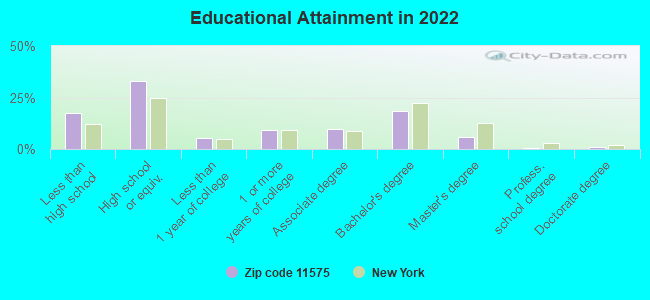
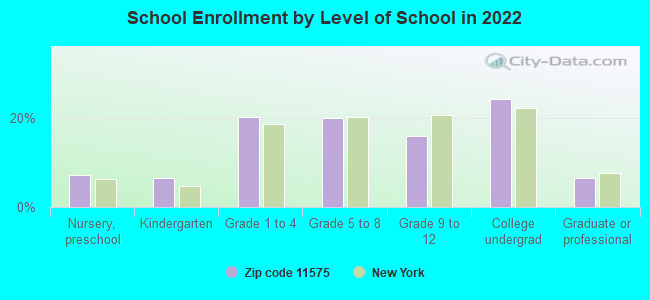
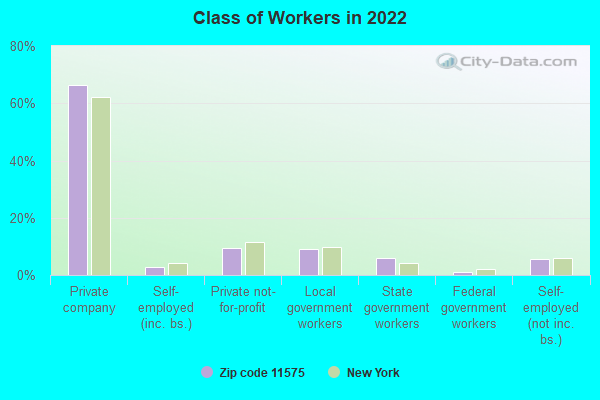
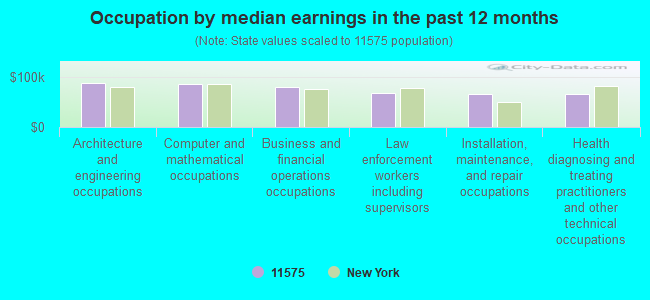
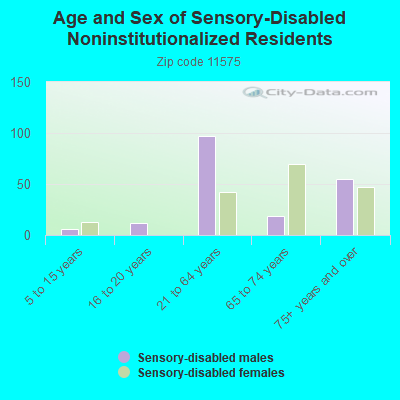
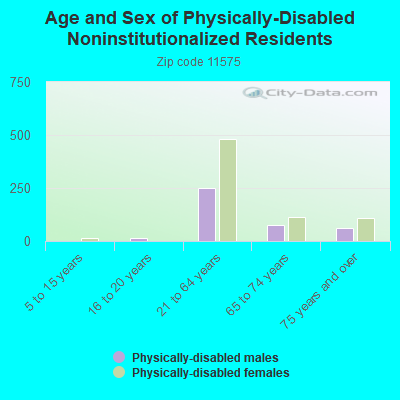
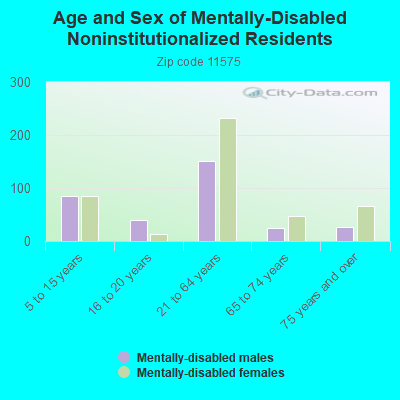
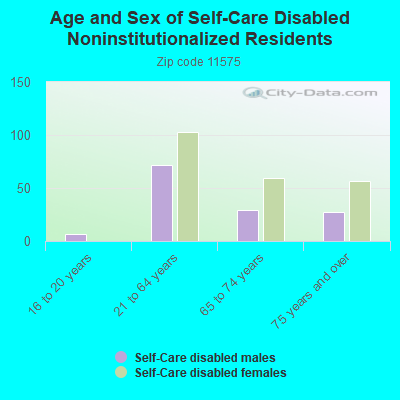
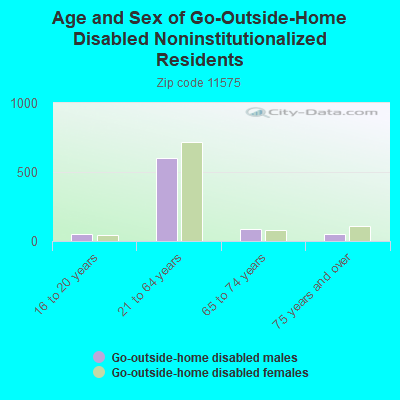
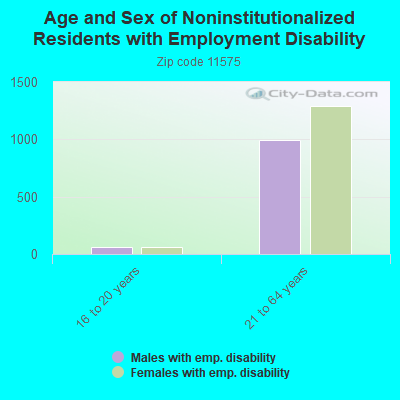
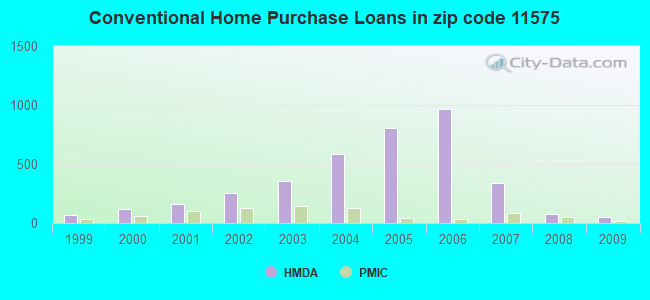
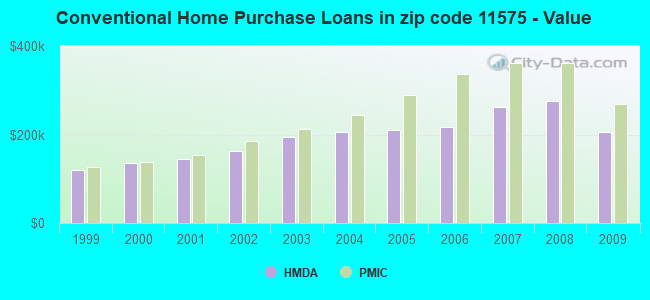
 Based on the data from the years 2002 - 2018 the average number of fire incidents per year is 25. The highest number of fire incidents - 113 took place in 2016, and the least - 0 in 2003. The data has a growing trend.
 When looking into fire subcategories, the most incidents belonged to: Structure Fires (79.4%), and Outside Fires (10.0%).