Estimated zip code population in 2022: 33,436 Zip code population in 2010: 35,321 Zip code population in 2000: 35,606
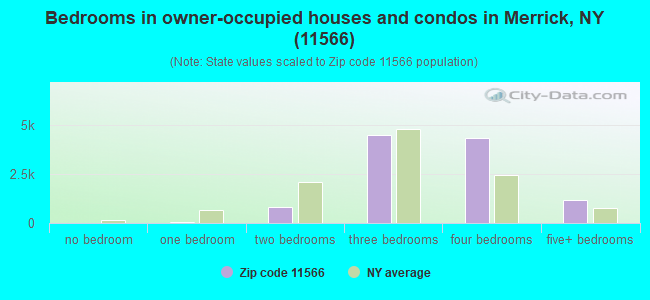
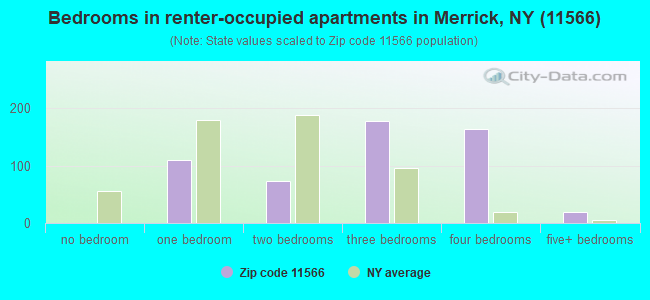
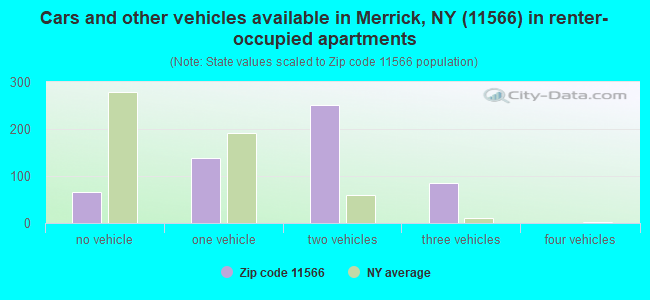
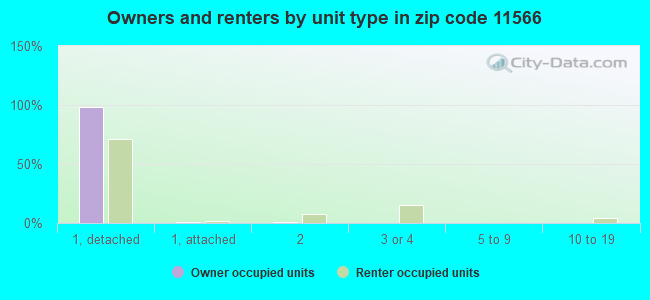
Houses and condos: 11,744 Renter-occupied apartments: 552
% of renters here:
5%
State:
46%
March 2022 cost of living index in zip code 11566: 150.5 (very high, U.S. average is 100)
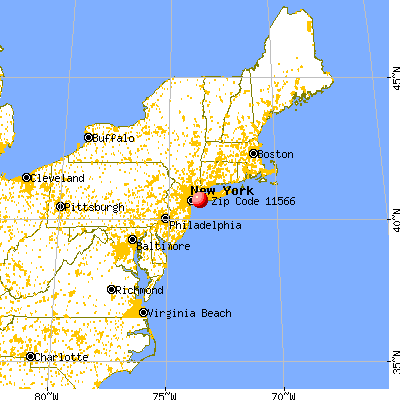
Land area: 5.5 sq. mi. Water area: 1.0 sq. mi.
Population density: 6,133 people per square mile
(high).
OSM Map
General Map
Google Map
MSN Map
OSM Map
General Map
Google Map
MSN Map
OSM Map
General Map
Google Map
MSN Map
OSM Map
General Map
Google Map
MSN Map
Please wait while loading the map...
Real estate property taxes paid for housing units in 2022:
This zip code:
1.4% ($9,805)
New York:
1.5% ($6,180)
Median real estate property taxes paid for housing units with mortgages in 2022: $9,858 (1.4%) Median real estate property taxes paid for housing units with no mortgage in 2022: $9,755 (1.5%)
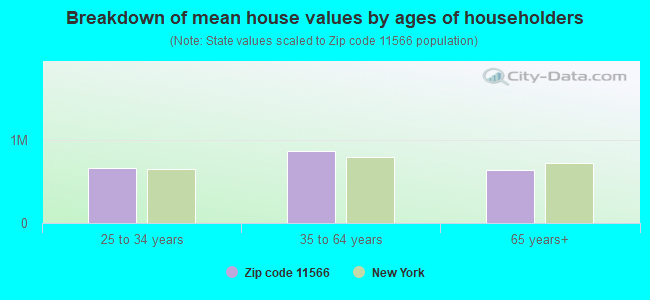
Estimated median house/condo value in 2022: $683,943
11566:
$683,943
New York:
$400,400
According to our research of New York and other state lists, there were 2 registered sex offenders living in 11566 zip code as of April 27, 2024. The ratio of all residents to sex offenders in zip code 11566 is 17,362 to 1. The ratio of registered sex offenders to all residents in this zip code is much lower than the state average.
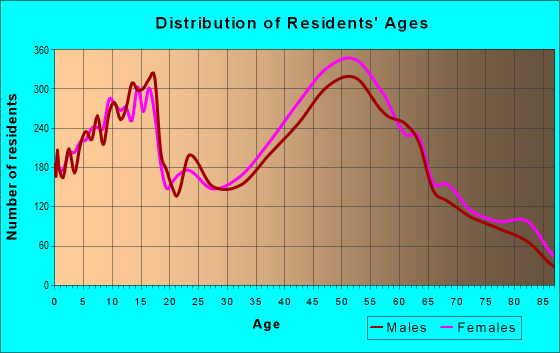
Median resident age:
This zip code:
43.1 years
New York median age:
40.0 years
Average household size:
This zip code:
2.9 people
New York:
2.5 people
Averages for the 2020 tax year for zip code 11566, filed in 2021:
Average Adjusted Gross Income (AGI) in 2020: $135,001 (Individual Income Tax Returns)
Here:
$135,001
State:
$90,930
Salary/wage: $112,345 (reported on 80.7% of returns)
Here:
$112,345
State:
$72,104
(% of AGI for various income ranges: 1208.3% for AGIs below $25k, 3847.9% for AGIs $25k-50k, 6512.7% for AGIs $50k-75k, 9836.2% for AGIs $75k-100k, 18812.7% for AGIs $100k-200k, 77837.7% for AGIs over 200k)
Taxable interest for individuals: $2,500 (reported on 59.7% of returns)
This zip code:
$2,500
New York:
$3,075
(% of AGI for various income ranges: 55.9% for AGIs below $25k, 70.1% for AGIs $25k-50k, 126.8% for AGIs $50k-75k, 172.5% for AGIs $75k-100k, 258.4% for AGIs $100k-200k, 1283.9% for AGIs over 200k)
Ordinary dividends: $6,780 (reported on 42.2% of returns)
Here:
$6,780
State:
$11,095
(% of AGI for various income ranges: 86.2% for AGIs below $25k, 115.1% for AGIs $25k-50k, 187.7% for AGIs $50k-75k, 340.8% for AGIs $75k-100k, 517.4% for AGIs $100k-200k, 2533.5% for AGIs over 200k)
Net capital gain/loss in AGI: +$22,244 (reported on 38.3% of returns)
Here:
+$22,244
State:
+$44,925
(% of AGI for various income ranges: 47.5% for AGIs below $25k, 90.7% for AGIs $25k-50k, 137.6% for AGIs $50k-75k, 293.1% for AGIs $75k-100k, 562.8% for AGIs $100k-200k, 11384.4% for AGIs over 200k)
Profit/loss from business: +$27,072 (reported on 15.5% of returns)
Here:
+$27,072
State:
+$14,940
(% of AGI for various income ranges: 137.0% for AGIs below $25k, 191.2% for AGIs $25k-50k, 241.7% for AGIs $50k-75k, 366.0% for AGIs $75k-100k, 622.7% for AGIs $100k-200k, 4084.0% for AGIs over 200k)
Taxable individual retirement arrangement distribution: $20,646 (reported on 11.3% of returns)
11566:
$20,646
New York:
$19,609
(% of AGI for various income ranges: 61.6% for AGIs below $25k, 144.9% for AGIs $25k-50k, 257.6% for AGIs $50k-75k, 475.2% for AGIs $75k-100k, 658.0% for AGIs $100k-200k, 1227.0% for AGIs over 200k)
Self-employed (Keogh) retirement plans: $26,588 (reported on 2.2% of returns)
11566:
$26,588
New York:
$32,497
(% of AGI for various income ranges: 34.5% for AGIs $50k-75k, 53.4% for AGIs $100k-200k, 743.1% for AGIs over 200k)
Total itemized deductions: $32,815 (reported on 24.9% of returns)
Here:
$32,815
State:
$39,326
(% of AGI for various income ranges: 225.0% for AGIs below $25k, 375.9% for AGIs $25k-50k, 698.6% for AGIs $50k-75k, 1132.6% for AGIs $75k-100k, 1850.7% for AGIs $100k-200k, 6134.5% for AGIs over 200k)
Charity contributions: $4,782 (reported on 22.6% of returns)
Here:
$4,782
State:
$15,420
(% of AGI for various income ranges: 8.0% for AGIs below $25k, 25.5% for AGIs $25k-50k, 67.3% for AGIs $50k-75k, 113.1% for AGIs $75k-100k, 217.6% for AGIs $100k-200k, 1000.5% for AGIs over 200k)
Taxes paid: $9,641 (reported on 24.9% of returns)
11566:
$9,641
State:
$9,183
(% of AGI for various income ranges: 67.8% for AGIs below $25k, 132.9% for AGIs $25k-50k, 247.1% for AGIs $50k-75k, 389.7% for AGIs $75k-100k, 638.4% for AGIs $100k-200k, 1476.3% for AGIs over 200k)
Earned income credit: $1,500 (reported on 4.4% of returns)
Here:
$1,500
State:
$2,138
(% of AGI for various income ranges: 35.5% for AGIs below $25k, 29.0% for AGIs $25k-50k)
Percentage of individuals using paid preparers for their 2020 taxes: 95.8%
Here:
96%
State:
95%
(% for various income ranges: 94.4% for AGIs below $25k, 96.0% for AGIs $25k-50k, 95.7% for AGIs $50k-75k, 95.9% for AGIs $75k-100k, 96.5% for AGIs $100k-200k, 96.1% for AGIs over 200k)
Averages for the 2012 tax year for zip code 11566, filed in 2013:
Average Adjusted Gross Income (AGI) in 2012: $108,778 (Individual Income Tax Returns)
Here:
$108,778
State:
$77,088
Salary/wage: $93,051 (reported on 82.1% of returns)
Here:
$93,051
State:
$60,593
(% of AGI for various income ranges: 67.8% for AGIs below $25k, 71.8% for AGIs $25k-50k, 70.2% for AGIs $50k-75k, 68.0% for AGIs $75k-100k, 75.4% for AGIs $100k-200k, 66.9% for AGIs over 200k)
Taxable interest for individuals: $2,127 (reported on 63.1% of returns)
This zip code:
$2,127
New York:
$3,125
(% of AGI for various income ranges: 3.1% for AGIs below $25k, 1.4% for AGIs $25k-50k, 1.2% for AGIs $50k-75k, 1.3% for AGIs $75k-100k, 1.0% for AGIs $100k-200k, 1.3% for AGIs over 200k)
Ordinary dividends: $6,730 (reported on 41.6% of returns)
Here:
$6,730
State:
$10,299
(% of AGI for various income ranges: 4.5% for AGIs below $25k, 2.1% for AGIs $25k-50k, 2.2% for AGIs $50k-75k, 2.2% for AGIs $75k-100k, 1.4% for AGIs $100k-200k, 3.4% for AGIs over 200k)
Net capital gain/loss in AGI: +$8,398 (reported on 34.5% of returns)
Here:
+$8,398
State:
+$42,474
(% of AGI for various income ranges: 0.5% for AGIs $75k-100k, 0.6% for AGIs $100k-200k, 5.3% for AGIs over 200k)
Profit/loss from business: +$28,205 (reported on 15.8% of returns)
Here:
+$28,205
State:
+$16,168
(% of AGI for various income ranges: 8.2% for AGIs below $25k, 5.3% for AGIs $25k-50k, 3.4% for AGIs $50k-75k, 3.5% for AGIs $75k-100k, 3.3% for AGIs $100k-200k, 4.5% for AGIs over 200k)
Taxable individual retirement arrangement distribution: $16,838 (reported on 14.2% of returns)
11566:
$16,838
New York:
$17,621
(% of AGI for various income ranges: 5.1% for AGIs below $25k, 3.6% for AGIs $25k-50k, 3.4% for AGIs $50k-75k, 3.1% for AGIs $75k-100k, 2.6% for AGIs $100k-200k, 1.3% for AGIs over 200k)
Self-employment retirement plans: $24,102 (reported on 2.3% of returns)
11566:
$24,102
New York:
$27,330
(% of AGI for various income ranges: 0.3% for AGIs $25k-50k, 0.2% for AGIs $75k-100k, 0.3% for AGIs $100k-200k, 0.8% for AGIs over 200k)
Total itemized deductions: $38,266 (24% of AGI, reported on 61.1% of returns)
Here:
$38,266
State:
$34,985
Here:
23.8% of AGI
State:
21.3% of AGI
(% of AGI for various income ranges: 28.6% for AGIs below $25k, 21.3% for AGIs $25k-50k, 25.7% for AGIs $50k-75k, 26.2% for AGIs $75k-100k, 24.3% for AGIs $100k-200k, 17.8% for AGIs over 200k)
Charity contributions: $3,072 (reported on 56.9% of returns)
Here:
$3,072
State:
$5,572
(% of AGI for various income ranges: 1.1% for AGIs below $25k, 1.4% for AGIs $25k-50k, 1.9% for AGIs $50k-75k, 1.9% for AGIs $75k-100k, 1.8% for AGIs $100k-200k, 1.5% for AGIs over 200k)
Taxes paid: $20,730 (reported on 61.0% of returns)
11566:
$20,730
State:
$18,656
(% of AGI for various income ranges: 11.9% for AGIs below $25k, 9.7% for AGIs $25k-50k, 11.7% for AGIs $50k-75k, 12.8% for AGIs $75k-100k, 12.6% for AGIs $100k-200k, 11.0% for AGIs over 200k)
Earned income credit: $1,723 (reported on 5.3% of returns)
Here:
$1,723
State:
$2,230
(% of AGI for various income ranges: 2.6% for AGIs below $25k, 0.4% for AGIs $25k-50k)
Percentage of individuals using paid preparers for their 2012 taxes: 74.8%
Here:
75%
State:
66%
(% for various income ranges: 69.9% for AGIs below $25k, 70.4% for AGIs $25k-50k, 76.3% for AGIs $50k-75k, 75.8% for AGIs $75k-100k, 79.4% for AGIs $100k-200k, 79.5% for AGIs over 200k)
Averages for the 2004 tax year for zip code 11566, filed in 2005:
Average Adjusted Gross Income (AGI) in 2004: $100,422 (Individual Income Tax Returns)
Here:
$100,422
State:
$59,519
Salary/wage: $85,216 (reported on 82.0% of returns)
Here:
$85,216
State:
$50,673
(% of AGI for various income ranges: 211.9% for AGIs below $10k, 59.9% for AGIs $10k-25k, 72.6% for AGIs $25k-50k, 73.2% for AGIs $50k-75k, 75.5% for AGIs $75k-100k, 68.1% for AGIs over 100k)
Taxable interest for individuals: $2,552 (reported on 79.7% of returns)
This zip code:
$2,552
New York:
$2,377
(% of AGI for various income ranges: 38.4% for AGIs below $10k, 6.8% for AGIs $10k-25k, 2.8% for AGIs $25k-50k, 2.5% for AGIs $50k-75k, 2.0% for AGIs $75k-100k, 1.7% for AGIs over 100k)
Taxable dividends: $3,721 (reported on 50.8% of returns)
Here:
$3,721
State:
$5,394
(% of AGI for various income ranges: 41.5% for AGIs below $10k, 4.2% for AGIs $10k-25k, 2.0% for AGIs $25k-50k, 2.0% for AGIs $50k-75k, 1.4% for AGIs $75k-100k, 1.8% for AGIs over 100k)
Net capital gain/loss: +$12,043 (reported on 43.3% of returns)
Here:
+$12,043
State:
+$23,581
(% of AGI for various income ranges: -87.9% for AGIs below $10k, -0.1% for AGIs $10k-25k, 0.2% for AGIs $25k-50k, 0.1% for AGIs $50k-75k, 0.5% for AGIs $75k-100k, 7.3% for AGIs over 100k)
Profit/loss from business: +$25,655 (reported on 16.9% of returns)
Here:
+$25,655
State:
+$13,809
(% of AGI for various income ranges: 16.6% for AGIs below $10k, 8.0% for AGIs $10k-25k, 4.5% for AGIs $25k-50k, 3.8% for AGIs $50k-75k, 3.7% for AGIs $75k-100k, 4.3% for AGIs over 100k)
IRA payment deduction: $3,837 (reported on 5.8% of returns)
11566:
$3,837
New York:
$3,115
(% of AGI for various income ranges: 0.4% for AGIs $10k-25k, 0.6% for AGIs $25k-50k, 0.4% for AGIs $50k-75k, 0.4% for AGIs $75k-100k, 0.1% for AGIs over 100k)
Self-employed pension: $16,488 (reported on 3.5% of returns)
Here:
$16,488
New York:
$19,016
(% of AGI for various income ranges: 0.1% for AGIs $25k-50k, 0.2% for AGIs $50k-75k, 0.2% for AGIs $75k-100k, 0.7% for AGIs over 100k)
Total itemized deductions: $29,209 (22% of AGI, reported on 69.7% of returns)
Here:
$29,209
State:
$25,864
Here:
22.2% of AGI
State:
21.9% of AGI
(% of AGI for various income ranges: 70.2% for AGIs below $10k, 28.7% for AGIs $10k-25k, 23.3% for AGIs $25k-50k, 26.6% for AGIs $50k-75k, 26.0% for AGIs $75k-100k, 17.9% for AGIs over 100k)
Charity contributions deductions: $3,564 (3% of AGI, reported on 67.0% of returns)
Here:
$3,564
State:
$4,439
Here:
2.7% of AGI
State:
3.6% of AGI
(% of AGI for various income ranges: 0.7% for AGIs below $10k, 2.2% for AGIs $10k-25k, 2.3% for AGIs $25k-50k, 2.8% for AGIs $50k-75k, 2.7% for AGIs $75k-100k, 2.3% for AGIs over 100k)
Total tax: $18,571 (reported on 87.1% of returns)
11566:
$18,571
State:
$11,730
(% of AGI for various income ranges: 5.2% for AGIs below $10k, 4.6% for AGIs $10k-25k, 7.5% for AGIs $25k-50k, 8.9% for AGIs $50k-75k, 9.4% for AGIs $75k-100k, 19.3% for AGIs over 100k)
Earned income credit: $1,639 (reported on 2.8% of returns)
Here:
$1,639
State:
$1,757
Percentage of individuals using paid preparers for their 2004 taxes: 74.5%
Here:
75%
State:
67%
(% for various income ranges: 68.1% for AGIs below $10k, 70.2% for AGIs $10k-25k, 71.8% for AGIs $25k-50k, 76.9% for AGIs $50k-75k, 76.3% for AGIs $75k-100k, 77.6% for AGIs over 100k)
Likely homosexual households (counted as self-reported same-sex unmarried-partner households)
Lesbian couples: 0.1% of all households
Gay men: 0.0% of all households
Household received Food Stamps/SNAP in the past 12 months: 119 Household did not receive Food Stamps/SNAP in the past 12 months: 11,272
Women who had a birth in the past 12 months: 545 (508 now married, 30 unmarried) Women who did not have a birth in the past 12 months: 6,067 (3,345 now married, 2,667 unmarried)
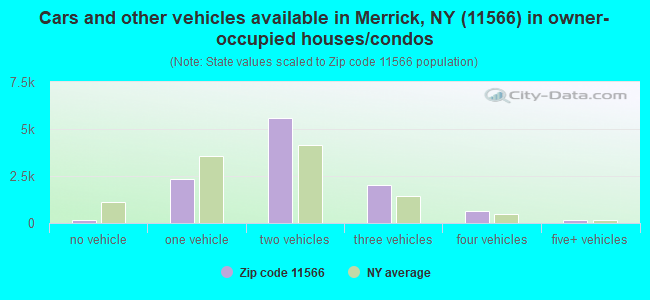
Housing units in zip code 11566 with a mortgage: 6,962 (1,065 second mortgage, 28 home equity loan, 925 both second mortgage and home equity loan) Houses without a mortgage: 270
Median monthly owner costs for units with a mortgage: $3,738 Median monthly owner costs for units without a mortgage: $1,487
Residents with income below the poverty level in 2022:
This zip code:
2.6%
Whole state:
14.3%
Residents with income below 50% of the poverty level in 2022:
This zip code:
1.3%
Whole state:
6.8%
Median number of rooms in houses and condos:
Here:
7.3
State:
6.3
Median number of rooms in apartments:
Here:
5.9
State:
3.8
Notable locations in this zip code not listed on our city pages
Notable locations in zip code 11566: Merrick Golf Course (A), Merrick Station (B), Sunrise Yacht Club (C), Merrick Library (D), North Merrick Public Library (E), Merrick Fire Department Friendship Engine and Hose Company (F), North Merrick Fire Department (G), Merrick Fire Department Empire Hose Company 3 (H), Merrick Fire Department Hook and Ladder Company 1 (I). Display/hide their locations on the map
Churches in zip code 11566 include: Merrick Jewish Center (A), Church of the Redeemer (B), Merrick United Methodist Church (C), Sacred Heart Church (D), Cure of Ars Church (E), Grace Reformed Baptist Church (F), Merrick Community Presbyterian Church (G), Saint Demetrius Greek Orthodox Church (H), Saint John's Lutheran Church (I). Display/hide their locations on the map
Lakes, reservoirs, and swamps: Mullener Pond (A), East Meadow Pond (B), Simmonds Pond (C), Newbridge Pond (D), High Flats Marsh (E). Display/hide their locations on the map
In group quarters: 68 (-1 institutionalized population)
Size of family households: 3,153 2-persons, 2,738 3-persons, 2,459 4-persons, 843 5-persons, 201 6-persons, 92 7-or-more-persons
Size of nonfamily households: 1,597 1-person, 299 2-persons, 22 5-persons
5,968 married couples with children.
746 single-parent households (85 men, 661 women).
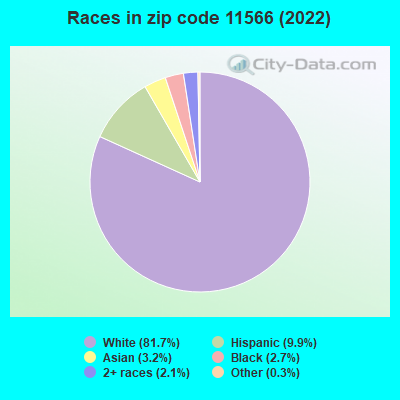
88.2% of residents of 11566 zip code speak English at home.
3.8% of residents speak Spanish at home (80% very well, 16% well, 4% not well).
5.0% of residents speak other Indo-European language at home (74% very well, 19% well, 7% not well).
1.7% of residents speak Asian or Pacific Island language at home (48% very well, 43% well, 6% not well, 3% not at all).
1.1% of residents speak other language at home (82% very well, 18% well).
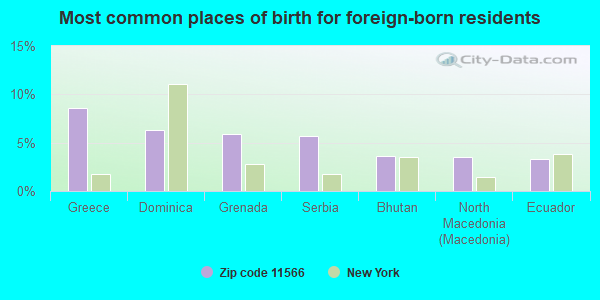
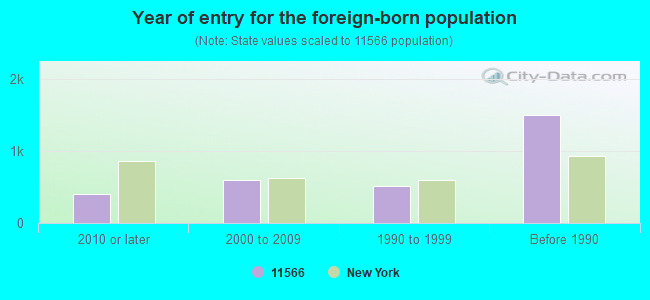
Foreign born population: 2,824 (8.4%) (79.6% of them are naturalized citizens)
Major facilities with environmental interests located in this zip code:
HAROLD D. FAYETTE SCHOOL ( in NORTH MERRICK, NY)
(National Center for Education Statistics) - STATE ID-280229020002 Organizations: NORTH MERRICK UFSD (SCHOOL DISTRICT)
HEMPSTEAD TOWNSHIP OF - DOS (1600 MERRICK RD in MERRICK, NY)
(Resource Conservation and Recovery Act (tracking hazardous waste)) Organizations: TOWNSHIP OF HEMPSTEAD (CONTACT/OWNER)
Alternative names: TOWN OF HEMPSTEAD DEPT OF SAN
BELLMORE MERRICK CENTRAL HIGH SCHOOL (1260 MEADOWBROOK RD in NORTH MERRICK, NY)
COMPLIANCE ACTIVITY (Tracking inspections of insecticide, fungicide, and rodenticide, and toxic substances) (Resource Conservation and Recovery Act (tracking hazardous waste)) Alternative names: BELLMORE-MERRICK CENTRAL HS DISTRICT, BELLMORE-MERRICK CENTRAL SCHOOL DIST
GENTLE AS A LAMB (1828 MERRICK AVENUE in MERRICK, NY)
(Resource Conservation and Recovery Act (tracking hazardous waste))
GETTY GASOLINE STATION (1808 SUNRISE HWY in MERRICK, NY)
(Resource Conservation and Recovery Act (tracking hazardous waste))
GETTY PETROLEUM CORP (2150 MERRICK RD in MERRICK, NY)
(Resource Conservation and Recovery Act (tracking hazardous waste))
GETTY SERVICE STATION (86 N BABYLON TNPK in NORTH MERRICK, NY)
Conditionally Exempt Small Quantity Generators, less than 100 kg/month of hazardous waste (Resource Conservation and Recovery Act (tracking hazardous waste)) - notification TRANSPORTER (Resource Conservation and Recovery Act (tracking hazardous waste)) - notification Organizations: GETTY PETROLEUM CORP (CONTACT/OWNER)
HAN CLEANERS (1828 MERRICK AVENUE in MERRICK, NY)
(Resource Conservation and Recovery Act (tracking hazardous waste))
HEMPSTEAD TOWN OF MERRICK GOLF COURSE (2550 CLUBHOUSE RD in MERRICK, NY)
Small Quantity Generators, between 100 kg and 1000 kg of hazardous waste/month (Resource Conservation and Recovery Act (tracking hazardous waste)) Organizations: DEPARTMENT OF PARKS & RECREATION (CONTACT/OPERATOR)
CONTAMINATION MANAGEMENT INC (1345 JERUSALEM AVE in NORTH MERRICK, NY)
(Resource Conservation and Recovery Act (tracking hazardous waste))
CONTINENTAL CLEANER (43 MERRICK AVE in MERRICK, NY)
(Resource Conservation and Recovery Act (tracking hazardous waste))
7 ELEVEN (1800 MERRICK AVENUE in NORTH MERRICK, NY)
ENFORCEMENT/COMPLIANCE ACTIVITY (Integrated Compliance Information System) COMPLIANCE ACTIVITY (Tracking inspections of insecticide, fungicide, and rodenticide, and toxic substances)
AMOCO OIL SERVICE STATION (1577 MERRICK RD in MERRICK, NY)
Conditionally Exempt Small Quantity Generators, less than 100 kg/month of hazardous waste (Resource Conservation and Recovery Act (tracking hazardous waste)) - notification Organizations: AMOCO OIL CO (CONTACT/OWNER)
Housing units lacking complete plumbing facilities: 0.1% Housing units lacking complete kitchen facilities: 0.4%
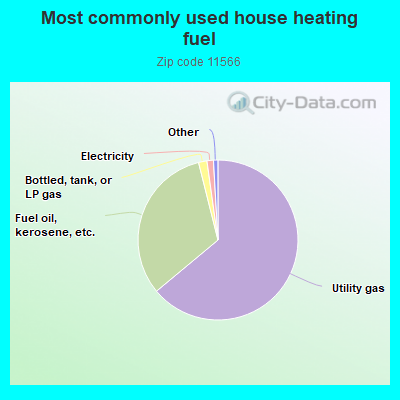
63.9%Utility gas
32.1%Fuel oil, kerosene, etc.
1.7%Bottled, tank, or LP gas
1.3%Electricity
Population in 1990: 36,427.
Place of birth for U.S.-born residents:
This state: 28,634
Northeast: 791
Midwest: 221
South: 453
West: 120
76% of the 11566 zip code residents lived in the same house 5 years ago. Out of people who lived in different houses, 67% lived in this county. Out of people who lived in different counties, 50% lived in New York.
94% of the 11566 zip code residents lived in the same house 1 year ago. Out of people who lived in different houses, 54% moved from this county. Out of people who lived in different houses, 42% moved from different county within same state. Out of people who lived in different houses, 1% moved from different state. Out of people who lived in different houses, 0% moved from abroad.
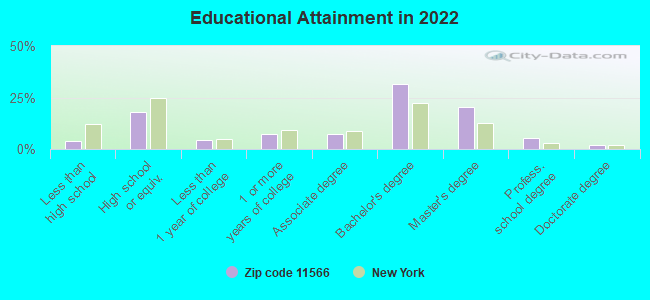
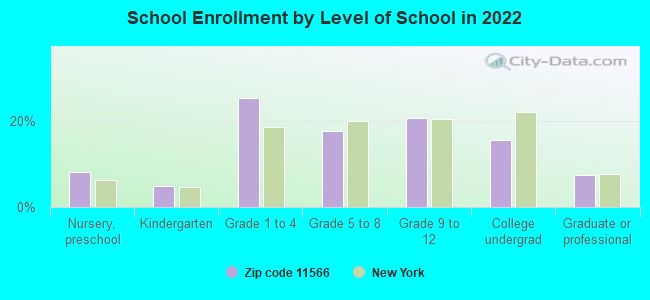
Private vs. public school enrollment:
Students in private schools in grades 1 to 8 (elementary and middle school): 85
Here:
2.6%
New York:
15.6%
Students in private schools in grades 9 to 12 (high school): 90
Here:
5.7%
New York:
15.0%
Students in private undergraduate colleges: 603
Here:
50.3%
New York:
39.2%
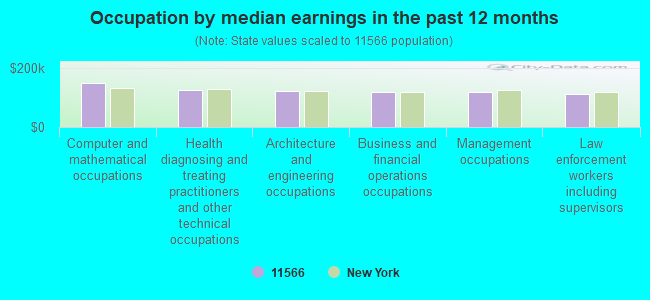
Occupation by median earnings in the past 12 months ($)
148,667Computer and mathematical occupations
126,426Health diagnosing and treating practitioners and other technical occupations
120,399Architecture and engineering occupations
118,882Business and financial operations occupations
118,764Management occupations
110,295Law enforcement workers including supervisors
Companies with federal contracts located in this zip code (MERRICK, NY):
DUN WELL MAINTENANCE INC (2621 LINCOLN BLVD; small business) : $1,321,637 in 6 contractsfrom 1999 to 2000
Contracts for Custodial Janitorial Services, Other Housekeeping Services by Maritime Administration, Army, Department of Defense Signed by year:2000: $536,329; 2001: $0; 2002: $0; 2003: $0; 2004: $0; 2005: $0; 2006: $0.
Biggest contracts:
$424,000 with Maritime Administration for Custodial Janitorial Services. Signed on 1999-10-15. Completion date: 2000-02-15.
$361,308 with Army for Custodial Janitorial Services. Signed on 1999-11-01. Completion date: 2000-06-30.
$359,212, same as above.Signed on 2000-10-25. Completion date: 2001-06-30.
$117,830, same as above.Signed on 2000-10-18. Completion date: 2001-06-30.
EDUCATIONAL TECHNOLOGY INC (2224 HEWLETT AVE; small business)
$495,022 with Army for Sound Recording and Reproducing Equipment. Signed on 2000-09-14. Completion date: 2000-11-03.
EXODUS AUTOMATION INC (1757 MERRICK AVE STE 202; small business) : $51,012 in 9 contractsfrom 2003 to 2006
Contracts for Miscellaneous Office Machines, Office Information System Equipment, Typewriters and Office Type Composing Machines, Office Devices and Accessories, and moreby SOCIAL SECURITY ADMINISTRATION, Minerals Management Service, Army, Air Force, and others Signed by year:2000: $0; 2001: $0; 2002: $0; 2003: $7,598; 2004: $6,600; 2005: $33,565; 2006: $3,249.
Biggest contracts:
$14,500 with SOCIAL SECURITY ADMINISTRATION for Miscellaneous Office Machines. Taking place in PA. Signed on 2005-02-18. Completion date: 2005-03-01.
$7,598 with Minerals Management Service for Office Information System Equipment. Signed on 2003-11-12. Effective on 2003-11-14. Completion date: 2003-11-21.
$6,600 with Army for Typewriters and Office Type Composing Machines. Signed on 2004-04-26. Completion date: 2004-05-28.
$5,799 with Army for Miscellaneous Office Machines. Signed on 2005-08-23. Completion date: 2005-09-19.
BIT COMPONENTS INC (1509 SYCAMORE AVE; small business)
$7,394 with Defense Logistics Agency for Semiconductor Devices and Associated Hardware. Signed on 2005-06-17. Completion date: 2005-07-15.
Top industries in this zip code by the number of employees in 2005:
2002 - 2018 National Fire Incident Reporting System (NFIRS) incidents
Based on the data from the years 2002 - 2018 the average number of fire incidents per year is 40. The highest number of reported fires - 98 took place in 2018, and the least - 3 in 2005. The data has an increasing trend.
When looking into fire subcategories, the most reports belonged to: Structure Fires (51.3%), and Outside Fires (23.6%).
Fire incident types reported to NFIRS in Zip Code 11566


 Nearest zip codes: 11710, 11520, 11575, 11793, 11510, 11554.


 Based on the data from the years 2002 - 2018 the average number of fire incidents per year is 40. The highest number of reported fires - 98 took place in 2018, and the least - 3 in 2005. The data has an increasing trend.
 When looking into fire subcategories, the most reports belonged to: Structure Fires (51.3%), and Outside Fires (23.6%).