Estimated zip code population in 2022: 34,513 Zip code population in 2010: 33,048 Zip code population in 2000: 32,346
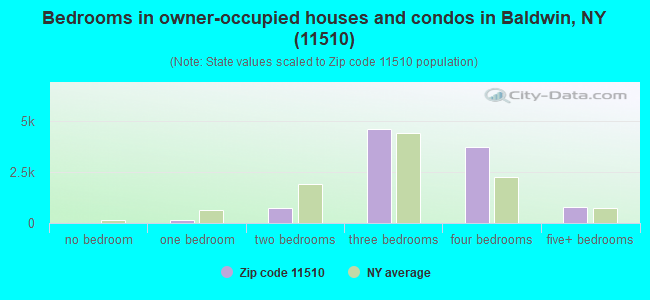
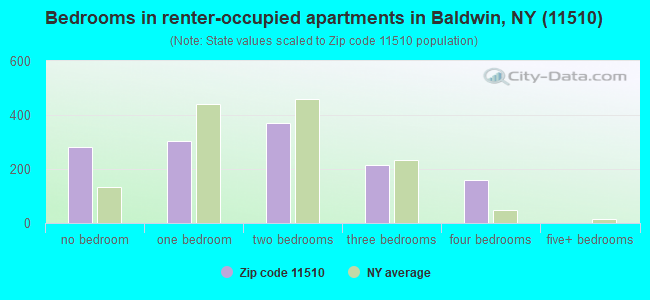
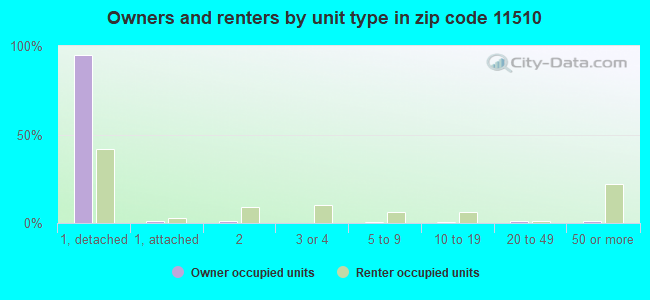
Houses and condos: 11,720 Renter-occupied apartments: 1,315
% of renters here:
11%
State:
46%
March 2022 cost of living index in zip code 11510: 148.0 (very high, U.S. average is 100)
Land area: 4.2 sq. mi. Water area: 0.6 sq. mi.
Population density: 8,127 people per square mile
(high).
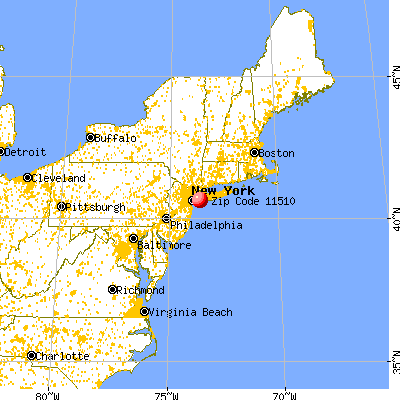
OSM Map
General Map
Google Map
MSN Map
OSM Map
General Map
Google Map
MSN Map
OSM Map
General Map
Google Map
MSN Map
OSM Map
General Map
Google Map
MSN Map
Please wait while loading the map...
Real estate property taxes paid for housing units in 2022:
This zip code:
1.8% ($9,805)
New York:
1.5% ($6,180)
Median real estate property taxes paid for housing units with mortgages in 2022: $9,858 (1.7%) Median real estate property taxes paid for housing units with no mortgage in 2022: $9,755 (1.8%)
Estimated median house/condo value in 2022: $552,492
11510:
$552,492
New York:
$400,400
According to our research of New York and other state lists, there were 7 registered sex offenders living in 11510 zip code as of April 27, 2024. The ratio of all residents to sex offenders in zip code 11510 is 4,888 to 1. The ratio of registered sex offenders to all residents in this zip code is much lower than the state average.
Median resident age:
This zip code:
42.8 years
New York median age:
40.0 years
Average household size:
This zip code:
3.0 people
New York:
2.5 people
Averages for the 2020 tax year for zip code 11510, filed in 2021:
Average Adjusted Gross Income (AGI) in 2020: $78,196 (Individual Income Tax Returns)
Here:
$78,196
State:
$90,930
Salary/wage: $72,480 (reported on 83.0% of returns)
Here:
$72,480
State:
$72,104
(% of AGI for various income ranges: 1123.2% for AGIs below $25k, 3648.1% for AGIs $25k-50k, 6773.3% for AGIs $50k-75k, 10348.1% for AGIs $75k-100k, 19185.6% for AGIs $100k-200k, 66888.8% for AGIs over 200k)
Taxable interest for individuals: $962 (reported on 40.8% of returns)
This zip code:
$962
New York:
$3,075
(% of AGI for various income ranges: 18.9% for AGIs below $25k, 19.4% for AGIs $25k-50k, 37.6% for AGIs $50k-75k, 57.9% for AGIs $75k-100k, 127.4% for AGIs $100k-200k, 429.8% for AGIs over 200k)
Ordinary dividends: $4,321 (reported on 19.3% of returns)
Here:
$4,321
State:
$11,095
(% of AGI for various income ranges: 26.8% for AGIs below $25k, 31.5% for AGIs $25k-50k, 66.8% for AGIs $50k-75k, 114.9% for AGIs $75k-100k, 252.4% for AGIs $100k-200k, 1289.3% for AGIs over 200k)
Net capital gain/loss in AGI: +$8,442 (reported on 17.9% of returns)
Here:
+$8,442
State:
+$44,925
(% of AGI for various income ranges: 6.5% for AGIs below $25k, 17.4% for AGIs $25k-50k, 46.7% for AGIs $50k-75k, 106.3% for AGIs $75k-100k, 290.5% for AGIs $100k-200k, 4583.6% for AGIs over 200k)
Profit/loss from business: +$8,001 (reported on 17.2% of returns)
Here:
+$8,001
State:
+$14,940
(% of AGI for various income ranges: 174.6% for AGIs below $25k, 124.2% for AGIs $25k-50k, 125.6% for AGIs $50k-75k, 180.1% for AGIs $75k-100k, 238.4% for AGIs $100k-200k, 1524.0% for AGIs over 200k)
Taxable individual retirement arrangement distribution: $19,162 (reported on 7.3% of returns)
11510:
$19,162
New York:
$19,609
(% of AGI for various income ranges: 38.8% for AGIs below $25k, 66.1% for AGIs $25k-50k, 147.3% for AGIs $50k-75k, 275.6% for AGIs $75k-100k, 430.6% for AGIs $100k-200k, 1625.0% for AGIs over 200k)
Self-employed (Keogh) retirement plans: $17,488 (reported on 0.4% of returns)
11510:
$17,488
New York:
$32,497
(% of AGI for various income ranges: 22.4% for AGIs $100k-200k, 208.3% for AGIs over 200k)
Total itemized deductions: $28,189 (reported on 21.6% of returns)
Here:
$28,189
State:
$39,326
(% of AGI for various income ranges: 116.9% for AGIs below $25k, 267.8% for AGIs $25k-50k, 739.3% for AGIs $50k-75k, 1306.2% for AGIs $75k-100k, 2160.6% for AGIs $100k-200k, 5253.3% for AGIs over 200k)
Charity contributions: $5,794 (reported on 18.5% of returns)
Here:
$5,794
State:
$15,420
(% of AGI for various income ranges: 6.4% for AGIs below $25k, 29.5% for AGIs $25k-50k, 93.2% for AGIs $50k-75k, 183.6% for AGIs $75k-100k, 398.2% for AGIs $100k-200k, 1398.1% for AGIs over 200k)
Taxes paid: $9,612 (reported on 21.6% of returns)
11510:
$9,612
State:
$9,183
(% of AGI for various income ranges: 40.9% for AGIs below $25k, 94.6% for AGIs $25k-50k, 272.5% for AGIs $50k-75k, 468.9% for AGIs $75k-100k, 754.9% for AGIs $100k-200k, 1457.9% for AGIs over 200k)
Earned income credit: $1,995 (reported on 10.8% of returns)
Here:
$1,995
State:
$2,138
(% of AGI for various income ranges: 76.0% for AGIs below $25k, 53.8% for AGIs $25k-50k)
Percentage of individuals using paid preparers for their 2020 taxes: 94.5%
Here:
94%
State:
95%
(% for various income ranges: 92.7% for AGIs below $25k, 95.8% for AGIs $25k-50k, 95.1% for AGIs $50k-75k, 94.2% for AGIs $75k-100k, 94.9% for AGIs $100k-200k, 94.5% for AGIs over 200k)
Averages for the 2012 tax year for zip code 11510, filed in 2013:
Average Adjusted Gross Income (AGI) in 2012: $70,757 (Individual Income Tax Returns)
Here:
$70,757
State:
$77,088
Salary/wage: $64,961 (reported on 84.2% of returns)
Here:
$64,961
State:
$60,593
(% of AGI for various income ranges: 70.7% for AGIs below $25k, 81.1% for AGIs $25k-50k, 78.8% for AGIs $50k-75k, 79.4% for AGIs $75k-100k, 80.8% for AGIs $100k-200k, 68.3% for AGIs over 200k)
Taxable interest for individuals: $1,108 (reported on 44.9% of returns)
This zip code:
$1,108
New York:
$3,125
(% of AGI for various income ranges: 1.3% for AGIs below $25k, 0.9% for AGIs $25k-50k, 0.6% for AGIs $50k-75k, 0.6% for AGIs $75k-100k, 0.6% for AGIs $100k-200k, 0.8% for AGIs over 200k)
Ordinary dividends: $3,750 (reported on 21.9% of returns)
Here:
$3,750
State:
$10,299
(% of AGI for various income ranges: 1.4% for AGIs below $25k, 1.1% for AGIs $25k-50k, 1.1% for AGIs $50k-75k, 0.8% for AGIs $75k-100k, 1.0% for AGIs $100k-200k, 1.7% for AGIs over 200k)
Net capital gain/loss in AGI: +$6,790 (reported on 16.7% of returns)
Here:
+$6,790
State:
+$42,474
(% of AGI for various income ranges: 0.1% for AGIs $50k-75k, 0.4% for AGIs $100k-200k, 6.9% for AGIs over 200k)
Profit/loss from business: +$12,261 (reported on 15.4% of returns)
Here:
+$12,261
State:
+$16,168
(% of AGI for various income ranges: 11.5% for AGIs below $25k, 3.4% for AGIs $25k-50k, 2.4% for AGIs $50k-75k, 1.7% for AGIs $75k-100k, 1.4% for AGIs $100k-200k, 3.3% for AGIs over 200k)
Taxable individual retirement arrangement distribution: $16,152 (reported on 9.3% of returns)
11510:
$16,152
New York:
$17,621
(% of AGI for various income ranges: 2.7% for AGIs below $25k, 2.3% for AGIs $25k-50k, 2.3% for AGIs $50k-75k, 1.9% for AGIs $75k-100k, 1.9% for AGIs $100k-200k, 2.4% for AGIs over 200k)
Self-employment retirement plans: $25,400 (reported on 0.6% of returns)
11510:
$25,400
New York:
$27,330
(% of AGI for various income ranges: 0.2% for AGIs $50k-75k, 0.2% for AGIs $100k-200k, 0.7% for AGIs over 200k)
Total itemized deductions: $31,183 (29% of AGI, reported on 54.2% of returns)
Here:
$31,183
State:
$34,985
Here:
28.8% of AGI
State:
21.3% of AGI
(% of AGI for various income ranges: 19.2% for AGIs below $25k, 22.2% for AGIs $25k-50k, 25.3% for AGIs $50k-75k, 28.0% for AGIs $75k-100k, 25.6% for AGIs $100k-200k, 19.1% for AGIs over 200k)
Charity contributions: $3,263 (reported on 48.2% of returns)
Here:
$3,263
State:
$5,572
(% of AGI for various income ranges: 1.0% for AGIs below $25k, 1.9% for AGIs $25k-50k, 2.4% for AGIs $50k-75k, 2.6% for AGIs $75k-100k, 2.3% for AGIs $100k-200k, 2.1% for AGIs over 200k)
Taxes paid: $13,943 (reported on 54.1% of returns)
11510:
$13,943
State:
$18,656
(% of AGI for various income ranges: 8.2% for AGIs below $25k, 8.3% for AGIs $25k-50k, 10.4% for AGIs $50k-75k, 11.7% for AGIs $75k-100k, 11.5% for AGIs $100k-200k, 10.3% for AGIs over 200k)
Earned income credit: $2,023 (reported on 12.4% of returns)
Here:
$2,023
State:
$2,230
(% of AGI for various income ranges: 5.5% for AGIs below $25k, 0.8% for AGIs $25k-50k)
Percentage of individuals using paid preparers for their 2012 taxes: 73.1%
Here:
73%
State:
66%
(% for various income ranges: 68.9% for AGIs below $25k, 71.3% for AGIs $25k-50k, 73.1% for AGIs $50k-75k, 77.4% for AGIs $75k-100k, 77.9% for AGIs $100k-200k, 78.5% for AGIs over 200k)
Averages for the 2004 tax year for zip code 11510, filed in 2005:
Average Adjusted Gross Income (AGI) in 2004: $61,492 (Individual Income Tax Returns)
Here:
$61,492
State:
$59,519
Salary/wage: $57,961 (reported on 84.0% of returns)
Here:
$57,961
State:
$50,673
(% of AGI for various income ranges: 139.5% for AGIs below $10k, 71.2% for AGIs $10k-25k, 82.4% for AGIs $25k-50k, 81.5% for AGIs $50k-75k, 82.7% for AGIs $75k-100k, 76.3% for AGIs over 100k)
Taxable interest for individuals: $1,337 (reported on 63.5% of returns)
This zip code:
$1,337
New York:
$2,377
(% of AGI for various income ranges: 13.1% for AGIs below $10k, 3.4% for AGIs $10k-25k, 1.5% for AGIs $25k-50k, 1.4% for AGIs $50k-75k, 1.0% for AGIs $75k-100k, 1.1% for AGIs over 100k)
Taxable dividends: $2,417 (reported on 31.6% of returns)
Here:
$2,417
State:
$5,394
(% of AGI for various income ranges: 7.0% for AGIs below $10k, 2.6% for AGIs $10k-25k, 1.2% for AGIs $25k-50k, 1.2% for AGIs $50k-75k, 1.0% for AGIs $75k-100k, 1.1% for AGIs over 100k)
Net capital gain/loss: +$5,874 (reported on 25.4% of returns)
Here:
+$5,874
State:
+$23,581
(% of AGI for various income ranges: -6.3% for AGIs below $10k, -0.1% for AGIs $10k-25k, -0.1% for AGIs $25k-50k, 0.3% for AGIs $50k-75k, 0.4% for AGIs $75k-100k, 4.8% for AGIs over 100k)
Profit/loss from business: +$13,648 (reported on 15.5% of returns)
Here:
+$13,648
State:
+$13,809
(% of AGI for various income ranges: 25.5% for AGIs below $10k, 9.7% for AGIs $10k-25k, 3.5% for AGIs $25k-50k, 2.3% for AGIs $50k-75k, 2.5% for AGIs $75k-100k, 3.2% for AGIs over 100k)
IRA payment deduction: $3,374 (reported on 3.5% of returns)
11510:
$3,374
New York:
$3,115
(% of AGI for various income ranges: 0.4% for AGIs below $10k, 0.4% for AGIs $10k-25k, 0.3% for AGIs $25k-50k, 0.2% for AGIs $50k-75k, 0.2% for AGIs $75k-100k, 0.1% for AGIs over 100k)
Self-employed pension: $16,016 (reported on 1.2% of returns)
Here:
$16,016
New York:
$19,016
(% of AGI for various income ranges: 0.1% for AGIs $25k-50k, 0.1% for AGIs $50k-75k, 0.1% for AGIs $75k-100k, 0.5% for AGIs over 100k)
Total itemized deductions: $24,665 (28% of AGI, reported on 59.1% of returns)
Here:
$24,665
State:
$25,864
Here:
27.7% of AGI
State:
21.9% of AGI
(% of AGI for various income ranges: 29.8% for AGIs below $10k, 23.1% for AGIs $10k-25k, 25.8% for AGIs $25k-50k, 28.1% for AGIs $50k-75k, 27.1% for AGIs $75k-100k, 20.5% for AGIs over 100k)
Charity contributions deductions: $3,025 (3% of AGI, reported on 55.8% of returns)
Here:
$3,025
State:
$4,439
Here:
3.3% of AGI
State:
3.6% of AGI
(% of AGI for various income ranges: 1.3% for AGIs below $10k, 2.1% for AGIs $10k-25k, 2.7% for AGIs $25k-50k, 3.3% for AGIs $50k-75k, 3.0% for AGIs $75k-100k, 2.6% for AGIs over 100k)
Total tax: $9,288 (reported on 79.7% of returns)
11510:
$9,288
State:
$11,730
(% of AGI for various income ranges: 5.5% for AGIs below $10k, 4.4% for AGIs $10k-25k, 6.6% for AGIs $25k-50k, 8.4% for AGIs $50k-75k, 9.5% for AGIs $75k-100k, 16.3% for AGIs over 100k)
Earned income credit: $1,663 (reported on 9.1% of returns)
Here:
$1,663
State:
$1,757
Percentage of individuals using paid preparers for their 2004 taxes: 72.0%
Here:
72%
State:
67%
(% for various income ranges: 62.8% for AGIs below $10k, 69.9% for AGIs $10k-25k, 71.8% for AGIs $25k-50k, 73.6% for AGIs $50k-75k, 78.5% for AGIs $75k-100k, 76.8% for AGIs over 100k)
Likely homosexual households (counted as self-reported same-sex unmarried-partner households)
Lesbian couples: 0.7% of all households
Gay men: 0.2% of all households
Household received Food Stamps/SNAP in the past 12 months: 506 Household did not receive Food Stamps/SNAP in the past 12 months: 10,806
Women who had a birth in the past 12 months: 509 (341 now married, 168 unmarried) Women who did not have a birth in the past 12 months: 7,217 (2,681 now married, 4,533 unmarried)
Housing units in zip code 11510 with a mortgage: 7,455 (798 second mortgage, 704 both second mortgage and home equity loan) Houses without a mortgage: 156
Median monthly owner costs for units with a mortgage: $3,438 Median monthly owner costs for units without a mortgage: $1,487
Residents with income below the poverty level in 2022:
This zip code:
4.6%
Whole state:
14.3%
Residents with income below 50% of the poverty level in 2022:
This zip code:
1.4%
Whole state:
6.8%
Median number of rooms in houses and condos:
Here:
7.0
State:
6.3
Median number of rooms in apartments:
Here:
4.0
State:
3.8
Notable locations in this zip code not listed on our city pages
Churches in zip code 11510 include: Mineola Korean Presbyterian Church (A), Refuge Church of Christ (B), Saint Christopher's Church (C), Saint Peter's Evangelical Church (D), Calvary Protestant Church (E), Bethlehem Lutheran Church (F), All Saints Episcopal Church (G), First Church of Baldwin (H), First Presbyterian Church (I). Display/hide their locations on the map
Parks in zip code 11510 include: Silver Lake Park (1), Lotts Pond County Park (2), Coes Neck Park (3), Baldwin Harbor Town Park (4). Display/hide their locations on the map
4,415 married couples with children.
1,409 single-parent households (201 men, 1,208 women).
74.6% of residents of 11510 zip code speak English at home.
13.4% of residents speak Spanish at home (54% very well, 25% well, 21% not well, 1% not at all).
7.7% of residents speak other Indo-European language at home (79% very well, 17% well, 2% not well, 1% not at all).
2.1% of residents speak Asian or Pacific Island language at home (79% very well, 4% well, 17% not well).
2.2% of residents speak other language at home (69% very well, 8% well, 23% not well).
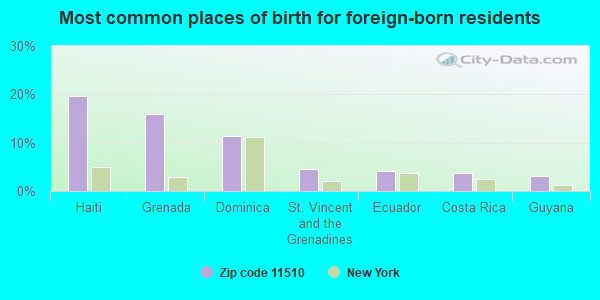
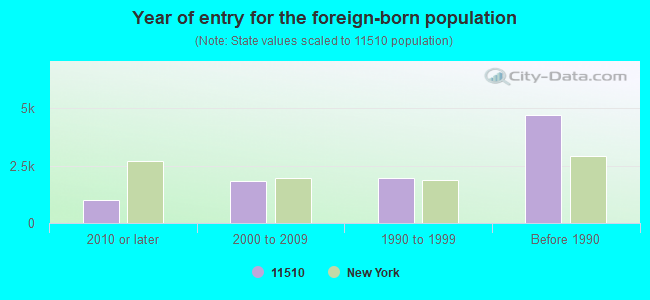
Foreign born population: 8,873 (25.7%) (82.4% of them are naturalized citizens)
Major facilities with environmental interests located in this zip code:
HAN S CLEANERS (762 MERRICK RD in BALDWIN, NY)
AIR MINOR (AIRS/AFS) STATE MASTER (New York facility tracking) - AIR PROGRAM Small Quantity Generators, between 100 kg and 1000 kg of hazardous waste/month (Resource Conservation and Recovery Act (tracking hazardous waste)) Business SIC classification: DRYCLEANING PLANTS, EXCEPT RUG CLEANING Business NAICS classification: DRYCLEANING AND LAUNDRY SERVICES (EXCEPT COIN-OPERATED). Organizations: OK DRY CLEANING INC (CONTACT/OPERATOR)
Alternative names: HANS CLEANERS
HARBOR FRENCH CLEANERS (816 ATLANTIC AVE in BALDWIN, NY)
AIR MINOR (AIRS/AFS) STATE MASTER (New York facility tracking) - AIR PROGRAM (Resource Conservation and Recovery Act (tracking hazardous waste)) Business SIC classification: DRYCLEANING PLANTS, EXCEPT RUG CLEANING Business NAICS classification: DRYCLEANING AND LAUNDRY SERVICES (EXCEPT COIN-OPERATED).
ALL HOUR COLLISIONS INC (20 BROOKLYN AVE in BALDWIN, NY)
STATE MASTER (New York facility tracking) - HAZARDOUS WASTE PROGRAM (Resource Conservation and Recovery Act (tracking hazardous waste)) Alternative names: ALL HOUR COLLISION INC
GRAND AVE ES ( in NORTH BALDWIN, NY)
(National Center for Education Statistics) - STATE ID-280202030004 Organizations: UNIONDALE UFSD (SCHOOL DISTRICT)
1833 NOSTRAND AVE CORP (1144 ATLANTIC AVE in BALDWIN, NY)
(Integrated Compliance Information System) - ICIS-02-1993-0123, FORMAL ENFORCEMENT ACTION
CHRIS' SERVICE STATION (ATLANTIC & MILBURN AVE in BALDWIN, NY)
(Integrated Compliance Information System) - ICIS-02-1995-0245, FORMAL ENFORCEMENT ACTION
A A A CLEANERS (930 ATLANTIC AVE in BALDWIN, NY)
(Resource Conservation and Recovery Act (tracking hazardous waste))
ALLIED DEVICES DIV (2365 MILBURN AVE in BALDWIN, NY)
(Resource Conservation and Recovery Act (tracking hazardous waste))
ANDYS GRAND AUTO (2350 GRAND AVE in BALDWIN, NY)
Conditionally Exempt Small Quantity Generators, less than 100 kg/month of hazardous waste (Resource Conservation and Recovery Act (tracking hazardous waste)) Organizations: UNKNOWN (CONTACT/OPERATOR)
GETTY PETROLEUM CORP (764 SUNRISE HIGHWAY in BALDWIN, NY)
(Resource Conservation and Recovery Act (tracking hazardous waste))
GETTY PETROLEUM CORP (1331 N GRAND AVE in BALDWIN, NY)
(Resource Conservation and Recovery Act (tracking hazardous waste))
H BAILEN INC (25 SOUTHARD ST in BALDWIN, NY)
(Resource Conservation and Recovery Act (tracking hazardous waste))
HOLLYWOOD AUTO BODY (1968 GRAND AVE in BALDWIN, NY)
(Resource Conservation and Recovery Act (tracking hazardous waste))
Housing units lacking complete plumbing facilities: 0.3% Housing units lacking complete kitchen facilities: 0.2%
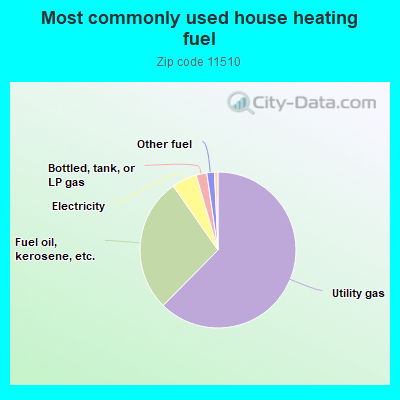
62.3%Utility gas
27.8%Fuel oil, kerosene, etc.
5.2%Electricity
2.2%Bottled, tank, or LP gas
1.6%Other fuel
0.7%No fuel used
Population in 1990: 30,959. Population change in the 1990s: +1,387 (+4.5%).
Place of birth for U.S.-born residents:
This state: 22,293
Northeast: 769
Midwest: 200
South: 1,151
West: 236
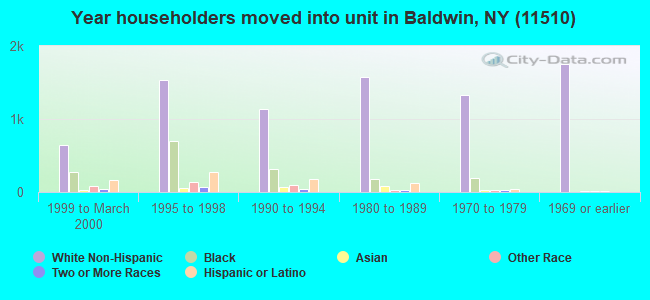
69% of the 11510 zip code residents lived in the same house 5 years ago. Out of people who lived in different houses, 54% lived in this county. Out of people who lived in different counties, 50% lived in New York.
96% of the 11510 zip code residents lived in the same house 1 year ago. Out of people who lived in different houses, 56% moved from this county. Out of people who lived in different houses, 37% moved from different county within same state. Out of people who lived in different houses, 3% moved from different state. Out of people who lived in different houses, 1% moved from abroad.
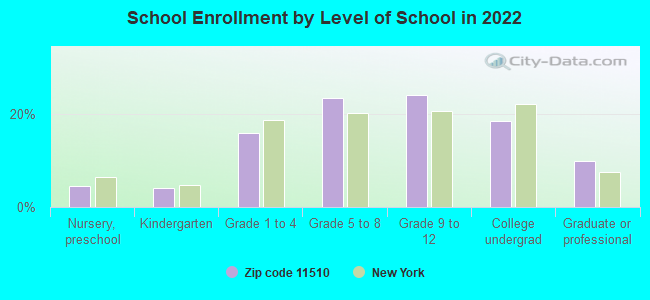
Private vs. public school enrollment:
Students in private schools in grades 1 to 8 (elementary and middle school): 401
Here:
12.6%
New York:
15.6%
Students in private schools in grades 9 to 12 (high school): 191
Here:
9.9%
New York:
15.0%
Students in private undergraduate colleges: 807
Here:
53.9%
New York:
39.2%
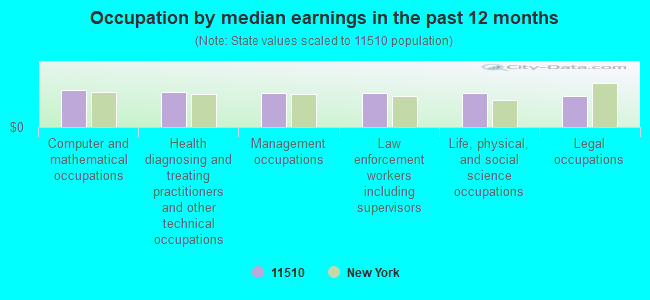
Occupation by median earnings in the past 12 months ($)
105,094Computer and mathematical occupations
99,465Health diagnosing and treating practitioners and other technical occupations
96,245Management occupations
95,640Law enforcement workers including supervisors
95,447Life, physical, and social science occupations
86,956Legal occupations
Companies with federal contracts located in this zip code:
JESSIE'S CLEANSWEEP INC (846 ADAMS ST in BALDWIN HARBOR, NY; small business) : $615,010 in 23 contractsfrom 2001 to 2006
Contracts for Custodial Janitorial Services, Maintenance, Repair or Alteration of Real Property -- Other Administrative Facilities and Service Buildings by Army Signed by year:2000: $0; 2001: $11,025; 2002: $26,100; 2003: $27,000; 2004: $167,675; 2005: $185,163; 2006: $198,047.
Biggest contracts:
$110,289 with Army for Custodial Janitorial Services. Signed on 2006-05-31. Completion date: 2004-03-31.
$82,688, same as above.Signed on 2005-05-23. Completion date: 2004-03-31.
$73,975, same as above.Signed on 2005-05-23. Completion date: 2009-05-29.
$73,590, same as above.Signed on 2004-06-23. Completion date: 2004-03-31.
GARLAND FIRE SYSTEMS, INCORPOR (2280 COVENTRY ROAD in BALDWIN, NY; small business) : $223,446 in 5 contractsfrom 2000 to 2003
Contracts for Inspection Services (including commercial testing and lab services, except medical/dental) -- Fire Control Equipment, Maintenance, Repair and Rebuilding of Equipment -- Ammunition and Explosives by Army Signed by year:2000: $59,476; 2001: $52,074; 2002: $54,585; 2003: $57,311; 2004: $0; 2005: $0; 2006: $0.
Biggest contracts:
$59,476 with Army for Inspection Services (including commercial testing and lab services, except medical/dental) -- Fire Control Equipment. Signed on 2000-10-02. Completion date: 2001-09-30.
$57,311 with Army for Maintenance, Repair and Rebuilding of Equipment -- Ammunition and Explosives. Signed on 2003-10-17. Completion date: 2002-09-30.
$54,585, same as above.Signed on 2002-11-07. Completion date: 2002-09-30.
$52,074, same as above.Signed on 2001-11-07. Completion date: 2002-09-30.
COMBUSTION SYSTEMS & INSTRUMEN (2911 GRAND AVE in BALDWIN, NY; small business) : $184,200 in 6 contractsfrom 2002 to 2004
Contracts for Maintenance, Repair and Rebuilding of Equipment -- Instruments and Laboratory Equipment by Army Signed by year:2000: $0; 2001: $0; 2002: $42,600; 2003: $58,600; 2004: $83,000; 2005: $0; 2006: $0.
Biggest contracts:
$67,600 with Army for Maintenance, Repair and Rebuilding of Equipment -- Instruments and Laboratory Equipment. Signed on 2004-10-25. Completion date: 2004-09-30.
$51,100, same as above.Signed on 2003-10-29. Completion date: 2004-09-30.
$42,600, same as above.Signed on 2002-10-29. Completion date: 2004-09-30.
$15,400, same as above.Signed on 2004-03-15. Completion date: 2004-09-30.
KOLSTEIN MUSIC, INC (795 FOXHURST ROAD in BALDWIN, NY; small business) : $108,495 in 4 contractsfrom 2001 to 2005
$43,000 with Army for Musical Instruments. Signed on 2004-03-17. Completion date: 2004-04-12.
$25,900 with Navy for Musical Instruments. Signed on 2001-04-24. Completion date: 2001-05-07.
$20,295 with Air Force for Musical Instruments. Signed on 2005-09-29. Completion date: 2005-10-29.
$19,300 with Navy for Musical Instruments. Signed on 2005-08-12. Completion date: 2005-09-26.
TRANS UNION TRANSPORT (896 DE MOTT AVE in BALDWIN, NY; small business) : $35,800 in 3 contractsin 2005
$19,300 with Army for Other Cargo and Freight Services. Signed on 2005-06-14. Completion date: 2005-07-25.
$14,000, same as above.Signed on 2005-05-26. Completion date: 2005-06-13.
$2,500, same as above.Signed on 2005-07-22. Completion date: 2005-07-25.
DVLAPTOP COM CO INC (2159 GRAND AVE in BALDWIN, NY; small business) : $27,255 in 2 contractsfrom 2005 to 2006
$18,630 with Department of Defense for ADP Central Processing Unit (CPU, Computer), Digital. Signed on 2005-03-29. Completion date: 2006-03-29.
$8,625 with Department of Defense for ADPE System Configuration. Signed on 2006-01-26. Completion date: 2006-02-27.
Top industries in this zip code by the number of employees in 2005:
2002 - 2018 National Fire Incident Reporting System (NFIRS) incidents
According to the data from the years 2002 - 2018 the average number of fire incidents per year is 53. The highest number of reported fires - 119 took place in 2017, and the least - 0 in 2004. The data has a declining trend.
When looking into fire subcategories, the most incidents belonged to: Outside Fires (40.1%), and Structure Fires (36.4%).
Fire incident types reported to NFIRS in Zip Code 11510


 Nearest zip codes: 11520, 11572, 11570, 11575, 11550, 11566.


 According to the data from the years 2002 - 2018 the average number of fire incidents per year is 53. The highest number of reported fires - 119 took place in 2017, and the least - 0 in 2004. The data has a declining trend.
 When looking into fire subcategories, the most incidents belonged to: Outside Fires (40.1%), and Structure Fires (36.4%).