Estimated zip code population in 2022: 25,342 Zip code population in 2010: 23,821 Zip code population in 2000: 24,778
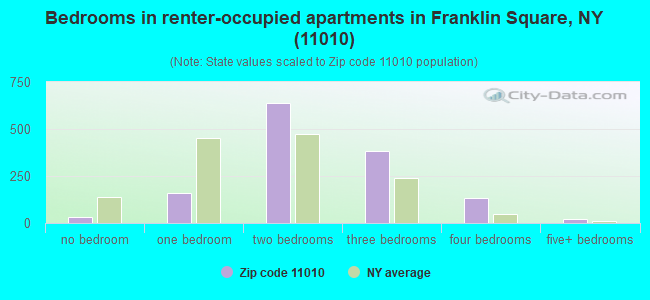
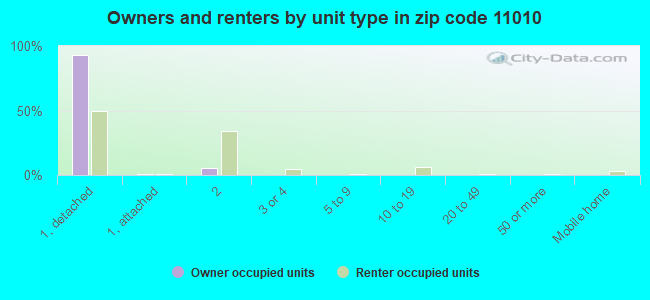
Houses and condos: 8,506 Renter-occupied apartments: 1,384
% of renters here:
16%
State:
46%
March 2022 cost of living index in zip code 11010: 149.9 (very high, U.S. average is 100)
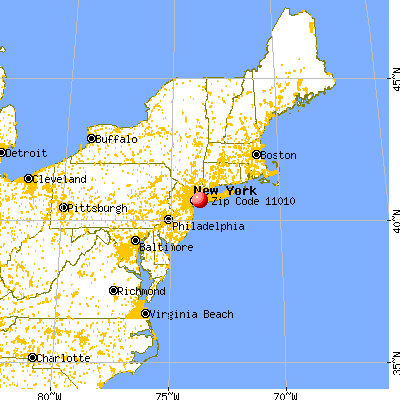
Land area: 2.4 sq. mi. Water area: 0.0 sq. mi.
Population density: 10,669 people per square mile
(high).
OSM Map
General Map
Google Map
MSN Map
OSM Map
General Map
Google Map
MSN Map
OSM Map
General Map
Google Map
MSN Map
OSM Map
General Map
Google Map
MSN Map
Please wait while loading the map...
Real estate property taxes paid for housing units in 2022:
This zip code:
1.5% ($9,805)
New York:
1.5% ($6,180)
Median real estate property taxes paid for housing units with mortgages in 2022: $9,858 (1.5%) Median real estate property taxes paid for housing units with no mortgage in 2022: $9,755 (1.5%)
Estimated median house/condo value in 2022: $658,924
11010:
$658,924
New York:
$400,400
According to our research of New York and other state lists, there were 3 registered sex offenders living in 11010 zip code as of April 27, 2024. The ratio of all residents to sex offenders in zip code 11010 is 8,297 to 1. The ratio of registered sex offenders to all residents in this zip code is much lower than the state average.
Median resident age:
This zip code:
41.7 years
New York median age:
40.0 years
Average household size:
This zip code:
3.0 people
New York:
2.5 people
Averages for the 2020 tax year for zip code 11010, filed in 2021:
Average Adjusted Gross Income (AGI) in 2020: $82,689 (Individual Income Tax Returns)
Here:
$82,689
State:
$90,930
Salary/wage: $75,201 (reported on 79.5% of returns)
Here:
$75,201
State:
$72,104
(% of AGI for various income ranges: 1073.7% for AGIs below $25k, 3655.7% for AGIs $25k-50k, 6797.0% for AGIs $50k-75k, 9780.9% for AGIs $75k-100k, 18349.2% for AGIs $100k-200k, 55436.8% for AGIs over 200k)
Taxable interest for individuals: $1,326 (reported on 49.7% of returns)
This zip code:
$1,326
New York:
$3,075
(% of AGI for various income ranges: 39.5% for AGIs below $25k, 53.3% for AGIs $25k-50k, 83.4% for AGIs $50k-75k, 89.4% for AGIs $75k-100k, 161.3% for AGIs $100k-200k, 622.2% for AGIs over 200k)
Ordinary dividends: $3,780 (reported on 28.6% of returns)
Here:
$3,780
State:
$11,095
(% of AGI for various income ranges: 52.6% for AGIs below $25k, 56.6% for AGIs $25k-50k, 116.2% for AGIs $50k-75k, 192.7% for AGIs $75k-100k, 281.7% for AGIs $100k-200k, 1093.8% for AGIs over 200k)
Net capital gain/loss in AGI: +$9,138 (reported on 25.6% of returns)
Here:
+$9,138
State:
+$44,925
(% of AGI for various income ranges: 18.8% for AGIs below $25k, 53.6% for AGIs $25k-50k, 109.6% for AGIs $50k-75k, 157.8% for AGIs $75k-100k, 343.5% for AGIs $100k-200k, 5561.1% for AGIs over 200k)
Profit/loss from business: +$11,332 (reported on 14.1% of returns)
Here:
+$11,332
State:
+$14,940
(% of AGI for various income ranges: 182.3% for AGIs below $25k, 207.1% for AGIs $25k-50k, 181.0% for AGIs $50k-75k, 214.0% for AGIs $75k-100k, 279.5% for AGIs $100k-200k, 1313.0% for AGIs over 200k)
Taxable individual retirement arrangement distribution: $15,986 (reported on 10.5% of returns)
11010:
$15,986
New York:
$19,609
(% of AGI for various income ranges: 69.7% for AGIs below $25k, 125.2% for AGIs $25k-50k, 223.5% for AGIs $50k-75k, 339.8% for AGIs $75k-100k, 472.2% for AGIs $100k-200k, 1167.3% for AGIs over 200k)
Self-employed (Keogh) retirement plans: $20,020 (reported on 0.4% of returns)
11010:
$20,020
New York:
$32,497
(% of AGI for various income ranges: 27.3% for AGIs $100k-200k, 143.8% for AGIs over 200k)
Total itemized deductions: $27,874 (reported on 17.0% of returns)
Here:
$27,874
State:
$39,326
(% of AGI for various income ranges: 158.7% for AGIs below $25k, 298.5% for AGIs $25k-50k, 541.0% for AGIs $50k-75k, 892.3% for AGIs $75k-100k, 1463.0% for AGIs $100k-200k, 3597.6% for AGIs over 200k)
Charity contributions: $3,809 (reported on 15.0% of returns)
Here:
$3,809
State:
$15,420
(% of AGI for various income ranges: 5.3% for AGIs below $25k, 18.5% for AGIs $25k-50k, 54.9% for AGIs $50k-75k, 94.3% for AGIs $75k-100k, 180.6% for AGIs $100k-200k, 635.9% for AGIs over 200k)
Taxes paid: $9,524 (reported on 17.0% of returns)
11010:
$9,524
State:
$9,183
(% of AGI for various income ranges: 48.9% for AGIs below $25k, 102.1% for AGIs $25k-50k, 196.6% for AGIs $50k-75k, 328.1% for AGIs $75k-100k, 524.0% for AGIs $100k-200k, 1040.8% for AGIs over 200k)
Earned income credit: $1,730 (reported on 7.4% of returns)
Here:
$1,730
State:
$2,138
(% of AGI for various income ranges: 50.4% for AGIs below $25k, 44.8% for AGIs $25k-50k)
Percentage of individuals using paid preparers for their 2020 taxes: 95.7%
Here:
96%
State:
95%
(% for various income ranges: 94.0% for AGIs below $25k, 95.8% for AGIs $25k-50k, 96.1% for AGIs $50k-75k, 95.9% for AGIs $75k-100k, 96.6% for AGIs $100k-200k, 96.8% for AGIs over 200k)
Averages for the 2012 tax year for zip code 11010, filed in 2013:
Average Adjusted Gross Income (AGI) in 2012: $68,167 (Individual Income Tax Returns)
Here:
$68,167
State:
$77,088
Salary/wage: $63,354 (reported on 81.5% of returns)
Here:
$63,354
State:
$60,593
(% of AGI for various income ranges: 64.1% for AGIs below $25k, 75.5% for AGIs $25k-50k, 72.5% for AGIs $50k-75k, 75.8% for AGIs $75k-100k, 81.4% for AGIs $100k-200k, 66.9% for AGIs over 200k)
Taxable interest for individuals: $1,160 (reported on 56.9% of returns)
This zip code:
$1,160
New York:
$3,125
(% of AGI for various income ranges: 2.8% for AGIs below $25k, 1.3% for AGIs $25k-50k, 1.0% for AGIs $50k-75k, 0.7% for AGIs $75k-100k, 0.7% for AGIs $100k-200k, 1.1% for AGIs over 200k)
Ordinary dividends: $3,183 (reported on 29.0% of returns)
Here:
$3,183
State:
$10,299
(% of AGI for various income ranges: 2.9% for AGIs below $25k, 1.3% for AGIs $25k-50k, 1.3% for AGIs $50k-75k, 1.2% for AGIs $75k-100k, 0.9% for AGIs $100k-200k, 2.3% for AGIs over 200k)
Net capital gain/loss in AGI: +$2,911 (reported on 21.8% of returns)
Here:
+$2,911
State:
+$42,474
(% of AGI for various income ranges: 0.3% for AGIs $75k-100k, 0.6% for AGIs $100k-200k, 4.8% for AGIs over 200k)
Profit/loss from business: +$12,297 (reported on 12.0% of returns)
Here:
+$12,297
State:
+$16,168
(% of AGI for various income ranges: 7.5% for AGIs below $25k, 3.4% for AGIs $25k-50k, 1.6% for AGIs $50k-75k, 1.8% for AGIs $75k-100k, 1.5% for AGIs $100k-200k, 2.1% for AGIs over 200k)
Taxable individual retirement arrangement distribution: $13,070 (reported on 12.8% of returns)
11010:
$13,070
New York:
$17,621
(% of AGI for various income ranges: 5.3% for AGIs below $25k, 2.6% for AGIs $25k-50k, 3.2% for AGIs $50k-75k, 2.5% for AGIs $75k-100k, 1.9% for AGIs $100k-200k, 2.2% for AGIs over 200k)
Self-employment retirement plans: $17,229 (reported on 0.6% of returns)
11010:
$17,229
New York:
$27,330
Total itemized deductions: $26,083 (26% of AGI, reported on 52.7% of returns)
Here:
$26,083
State:
$34,985
Here:
25.6% of AGI
State:
21.3% of AGI
(% of AGI for various income ranges: 21.2% for AGIs below $25k, 18.0% for AGIs $25k-50k, 19.3% for AGIs $50k-75k, 21.5% for AGIs $75k-100k, 21.5% for AGIs $100k-200k, 16.9% for AGIs over 200k)
Charity contributions: $2,266 (reported on 48.1% of returns)
Here:
$2,266
State:
$5,572
(% of AGI for various income ranges: 1.1% for AGIs below $25k, 1.3% for AGIs $25k-50k, 1.7% for AGIs $50k-75k, 1.7% for AGIs $75k-100k, 1.8% for AGIs $100k-200k, 1.3% for AGIs over 200k)
Taxes paid: $13,086 (reported on 52.4% of returns)
11010:
$13,086
State:
$18,656
(% of AGI for various income ranges: 9.8% for AGIs below $25k, 7.8% for AGIs $25k-50k, 9.1% for AGIs $50k-75k, 10.2% for AGIs $75k-100k, 11.0% for AGIs $100k-200k, 10.0% for AGIs over 200k)
Earned income credit: $1,776 (reported on 7.5% of returns)
Here:
$1,776
State:
$2,230
(% of AGI for various income ranges: 2.9% for AGIs below $25k, 0.5% for AGIs $25k-50k)
Percentage of individuals using paid preparers for their 2012 taxes: 74.3%
Here:
74%
State:
66%
(% for various income ranges: 69.0% for AGIs below $25k, 71.6% for AGIs $25k-50k, 75.1% for AGIs $50k-75k, 78.5% for AGIs $75k-100k, 80.6% for AGIs $100k-200k, 80.0% for AGIs over 200k)
Averages for the 2004 tax year for zip code 11010, filed in 2005:
Average Adjusted Gross Income (AGI) in 2004: $55,414 (Individual Income Tax Returns)
Here:
$55,414
State:
$59,519
Salary/wage: $53,187 (reported on 80.9% of returns)
Here:
$53,187
State:
$50,673
(% of AGI for various income ranges: 90.2% for AGIs below $10k, 61.6% for AGIs $10k-25k, 76.9% for AGIs $25k-50k, 78.0% for AGIs $50k-75k, 81.8% for AGIs $75k-100k, 77.6% for AGIs over 100k)
Taxable interest for individuals: $1,481 (reported on 70.5% of returns)
This zip code:
$1,481
New York:
$2,377
(% of AGI for various income ranges: 10.3% for AGIs below $10k, 5.6% for AGIs $10k-25k, 2.5% for AGIs $25k-50k, 1.6% for AGIs $50k-75k, 1.5% for AGIs $75k-100k, 1.3% for AGIs over 100k)
Taxable dividends: $2,135 (reported on 36.3% of returns)
Here:
$2,135
State:
$5,394
(% of AGI for various income ranges: 6.9% for AGIs below $10k, 2.9% for AGIs $10k-25k, 1.6% for AGIs $25k-50k, 1.2% for AGIs $50k-75k, 0.8% for AGIs $75k-100k, 1.3% for AGIs over 100k)
Net capital gain/loss: +$3,056 (reported on 28.8% of returns)
Here:
+$3,056
State:
+$23,581
(% of AGI for various income ranges: -5.3% for AGIs below $10k, -0.1% for AGIs $10k-25k, -0.1% for AGIs $25k-50k, 0.2% for AGIs $50k-75k, 0.3% for AGIs $75k-100k, 3.9% for AGIs over 100k)
Profit/loss from business: +$11,620 (reported on 11.9% of returns)
Here:
+$11,620
State:
+$13,809
(% of AGI for various income ranges: 10.7% for AGIs below $10k, 6.4% for AGIs $10k-25k, 3.1% for AGIs $25k-50k, 1.6% for AGIs $50k-75k, 1.9% for AGIs $75k-100k, 2.2% for AGIs over 100k)
IRA payment deduction: $3,408 (reported on 4.2% of returns)
11010:
$3,408
New York:
$3,115
(% of AGI for various income ranges: 0.4% for AGIs below $10k, 0.3% for AGIs $10k-25k, 0.5% for AGIs $25k-50k, 0.3% for AGIs $50k-75k, 0.2% for AGIs $75k-100k, 0.2% for AGIs over 100k)
Self-employed pension: $12,903 (reported on 0.6% of returns)
Here:
$12,903
New York:
$19,016
Total itemized deductions: $21,198 (27% of AGI, reported on 55.5% of returns)
Here:
$21,198
State:
$25,864
Here:
26.7% of AGI
State:
21.9% of AGI
(% of AGI for various income ranges: 29.8% for AGIs below $10k, 24.1% for AGIs $10k-25k, 20.4% for AGIs $25k-50k, 23.3% for AGIs $50k-75k, 23.9% for AGIs $75k-100k, 18.8% for AGIs over 100k)
Charity contributions deductions: $2,439 (3% of AGI, reported on 52.8% of returns)
Here:
$2,439
State:
$4,439
Here:
3.0% of AGI
State:
3.6% of AGI
(% of AGI for various income ranges: 1.7% for AGIs below $10k, 2.1% for AGIs $10k-25k, 2.3% for AGIs $25k-50k, 2.5% for AGIs $50k-75k, 2.6% for AGIs $75k-100k, 2.2% for AGIs over 100k)
Total tax: $7,653 (reported on 81.5% of returns)
11010:
$7,653
State:
$11,730
(% of AGI for various income ranges: 3.3% for AGIs below $10k, 4.1% for AGIs $10k-25k, 7.5% for AGIs $25k-50k, 9.0% for AGIs $50k-75k, 9.4% for AGIs $75k-100k, 15.8% for AGIs over 100k)
Earned income credit: $1,456 (reported on 5.9% of returns)
Here:
$1,456
State:
$1,757
Percentage of individuals using paid preparers for their 2004 taxes: 74.0%
Here:
74%
State:
67%
(% for various income ranges: 66.3% for AGIs below $10k, 72.6% for AGIs $10k-25k, 73.3% for AGIs $25k-50k, 76.5% for AGIs $50k-75k, 78.7% for AGIs $75k-100k, 78.4% for AGIs over 100k)
Likely homosexual households (counted as self-reported same-sex unmarried-partner households)
Lesbian couples: 0.2% of all households
Gay men: 0.1% of all households
Household received Food Stamps/SNAP in the past 12 months: 361 Household did not receive Food Stamps/SNAP in the past 12 months: 7,982
Women who had a birth in the past 12 months: 236 (202 now married, 31 unmarried) Women who did not have a birth in the past 12 months: 5,810 (2,619 now married, 3,166 unmarried)
Housing units in zip code 11010 with a mortgage: 4,334 (491 second mortgage, 7 home equity loan, 418 both second mortgage and home equity loan) Houses without a mortgage: 231
Median monthly owner costs for units with a mortgage: $3,477 Median monthly owner costs for units without a mortgage: $1,408
Residents with income below the poverty level in 2022:
This zip code:
5.2%
Whole state:
14.3%
Residents with income below 50% of the poverty level in 2022:
This zip code:
2.3%
Whole state:
6.8%
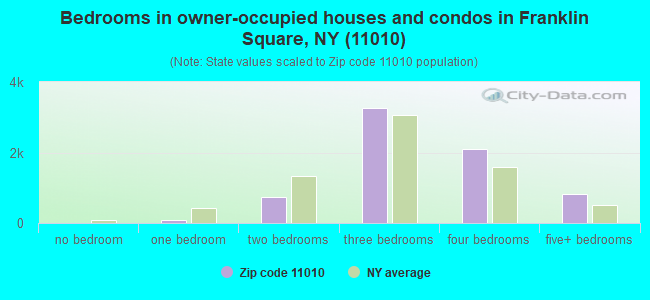
Median number of rooms in houses and condos:
Here:
6.6
State:
6.3
Median number of rooms in apartments:
Here:
4.9
State:
3.8
Notable locations in this zip code not listed on our city pages
Notable locations in zip code 11010: Garden Care Center (A), Franklin Square Public Library (B), Franklin Square and Munson Fire Department (C). Display/hide their locations on the map
Churches in zip code 11010 include: Ascension Lutheran Church (A), Bethel Assembly of God Church (B), Franklin Square Jewish Center (C), Franklin Square Orthodox Presbyterian Church (D), Grace Baptist Church (E), Saint Catherine of Sienna Roman Catholic Church (F), Saint James the Just Church (G), Wesley United Methodist Church (H). Display/hide their locations on the map
3,738 married couples with children.
921 single-parent households (212 men, 709 women).
70.2% of residents of 11010 zip code speak English at home.
9.9% of residents speak Spanish at home (64% very well, 18% well, 11% not well, 7% not at all).
14.0% of residents speak other Indo-European language at home (68% very well, 23% well, 6% not well, 3% not at all).
4.5% of residents speak Asian or Pacific Island language at home (59% very well, 25% well, 11% not well, 6% not at all).
1.2% of residents speak other language at home (63% very well, 21% well, 16% not well).
Foreign born population: 5,773 (22.8%) (72.1% of them are naturalized citizens)
This zip code:
22.8%
Whole state:
22.7%
13%Greece
12%Bhutan
7%Malaysia
6%Ecuador
6%Guyana
3%Colombia
3%Dominica
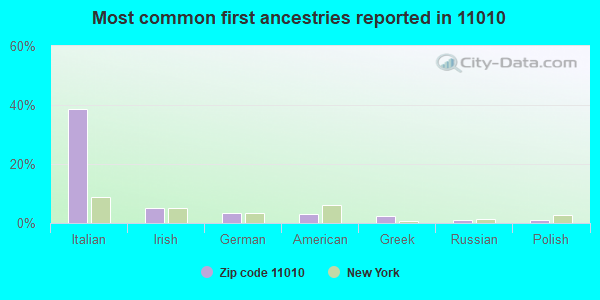
39%Italian
5%Irish
3%German
3%American
2%Greek
1%Russian
1%Polish
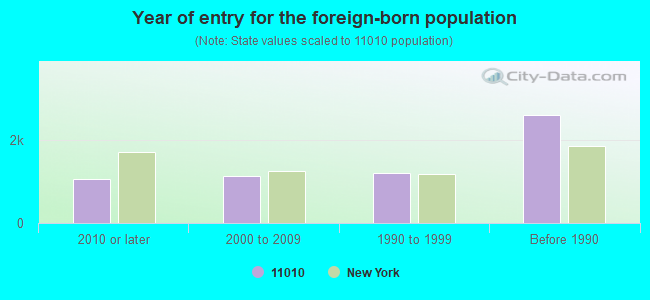
Year of entry for the foreign-born population
1,0522010 or later
1,1352000 to 2009
1,2131990 to 1999
2,606Before 1990
Major facilities with environmental interests located in this zip code:
HI-FASHIONS CLEANERS INC (120 NEW HYDE PARK RD in FRANKLIN SQUARE, NY)
AIR MINOR (AIRS/AFS) STATE MASTER (New York facility tracking) - AIR PROGRAM Small Quantity Generators, between 100 kg and 1000 kg of hazardous waste/month (Resource Conservation and Recovery Act (tracking hazardous waste)) - notification Business SIC classification: DRYCLEANING PLANTS, EXCEPT RUG CLEANING Business NAICS classification: DRYCLEANING AND LAUNDRY SERVICES (EXCEPT COIN-OPERATED). Organizations: PRITAM BINDRA (CONTACT/OWNER)
GENZALE PLATING COMPANY (288 NEW HYDE PARK ROAD in FRANKLIN SQUARE, NY)
SUPERFUND NPL (Superfund database) (Integrated Compliance Information System) - ICIS-02-1989-0271, FORMAL ENFORCEMENT ACTION, ICIS-02-2000-2010, ICIS-02-1989-0353, HAZARDOUS WASTE BIENNIAL REPORTER (Resource Conservation and Recovery Act (tracking hazardous waste)) Large Quantity Generators, more that 1000 kg of hazardous waste/month (Resource Conservation and Recovery Act (tracking hazardous waste)) Business SIC and NAICS classification: ELECTROPLATING, PLATING, POLISHING, ANODIZING, AND COLORING Alternative names: M GENZALE PLATING CO INC
H. FRANK CAREY JSHS ( in FRANKLIN SQUARE, NY)
(National Center for Education Statistics) - STATE ID-280252070004 Organizations: SEWANHAKA CENTRAL HS DISTRICT (SCHOOL DISTRICT)
CUMBERLAND FARMS #70249 (1019 TULIP AVE in FRANKLIN SQUARE, NY)
Small Quantity Generators, between 100 kg and 1000 kg of hazardous waste/month (Resource Conservation and Recovery Act (tracking hazardous waste)) Organizations: EXXON CO USA (CONTACT/OPERATOR)
, CUMBERLAND FARMS INC (CONTACT/OPERATOR)
, TOSCO (CONTACT/OWNER)
Alternative names: EXXON CO USA #36035, TOSCO #34722
AMOCO SERVICE - INAN CORP (1111 HEMPSTEAD TNPK in FRANKLIN SQUARE, NY)
(Resource Conservation and Recovery Act (tracking hazardous waste))
ASCENSION LUTHERAN CHURCH (145 FRANKLIN AVE in FRANKLIN SQUARE, NY)
(Resource Conservation and Recovery Act (tracking hazardous waste))
GETTY SERVICE STATION (530 FRANKLIN AVE in FRANKLIN SQUARE, NY)
(Resource Conservation and Recovery Act (tracking hazardous waste))
GLOBAL CHIROPRACTIC (246 SCHERER BLVD in FRANKLIN SQUARE, NY)
(Resource Conservation and Recovery Act (tracking hazardous waste))
HEMPSTEAD TOWN OF AVERILL PARK (145 AVERILL BLVD in FRANKLIN SQUARE, NY)
(Resource Conservation and Recovery Act (tracking hazardous waste))
HI FASHION CLEANERS (1082 HEMPSTEAD TNPK in FRANKLIN SQUARE, NY)
(Resource Conservation and Recovery Act (tracking hazardous waste))
HILBRAN DRY CLEANING DBA EURO CLEANERS (761 FRANKLIN AVE in FRANKLIN SQUARE, NY)
(Resource Conservation and Recovery Act (tracking hazardous waste))
BETA CLEANERS (166 NEW HYDE PARK RD in FRANKLIN SQUARE, NY)
(Resource Conservation and Recovery Act (tracking hazardous waste))
24 HOURS AUTO REPAIRS INC (676 HEMPSTEAD TNPK in FRANKLIN SQUARE, NY)
Conditionally Exempt Small Quantity Generators, less than 100 kg/month of hazardous waste (Resource Conservation and Recovery Act (tracking hazardous waste)) - notification Organizations: STEVEN COHEN (CONTACT/OWNER)
Housing units lacking complete plumbing facilities: 0.6% Housing units lacking complete kitchen facilities: 1.0%
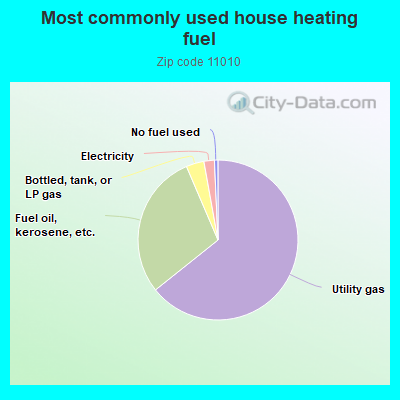
63.9%Utility gas
29.1%Fuel oil, kerosene, etc.
3.6%Bottled, tank, or LP gas
2.1%Electricity
0.7%No fuel used
Population in 1990: 24,595. Population change in the 1990s: +183 (+0.7%).
Place of birth for U.S.-born residents:
This state: 18,311
Northeast: 372
Midwest: 108
South: 238
West: 132
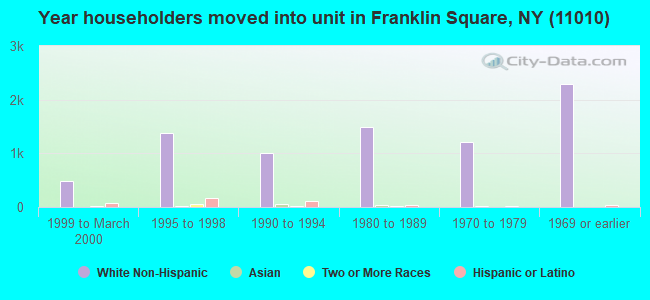
77% of the 11010 zip code residents lived in the same house 5 years ago. Out of people who lived in different houses, 57% lived in this county. Out of people who lived in different counties, 50% lived in New York.
96% of the 11010 zip code residents lived in the same house 1 year ago. Out of people who lived in different houses, 41% moved from this county. Out of people who lived in different houses, 50% moved from different county within same state. Out of people who lived in different houses, 4% moved from different state. Out of people who lived in different houses, 4% moved from abroad.
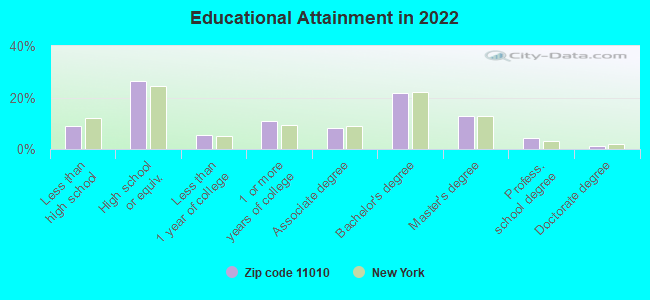
Private vs. public school enrollment:
Students in private schools in grades 1 to 8 (elementary and middle school): 210
Here:
8.7%
New York:
15.6%
Students in private schools in grades 9 to 12 (high school): 232
Here:
18.7%
New York:
15.0%
Students in private undergraduate colleges: 424
Here:
38.4%
New York:
39.2%
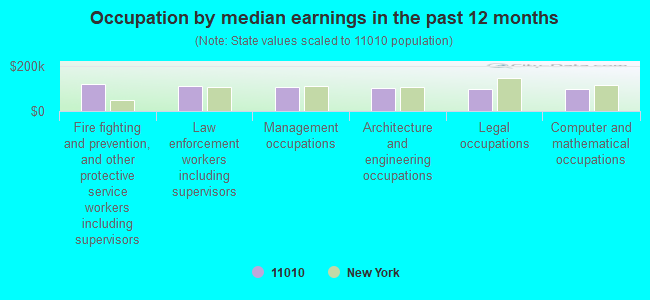
Occupation by median earnings in the past 12 months ($)
118,861Fire fighting and prevention, and other protective service workers including supervisors
114,074Law enforcement workers including supervisors
109,730Management occupations
104,477Architecture and engineering occupations
99,405Legal occupations
99,196Computer and mathematical occupations
Companies with federal contracts located in this zip code:
SOFTWARE ENGINEERING OF AMERIC (1230 HEMPSTEAD TPKE in FRANKLIN SQUAR, NY; small business) : $514,116 in 15 contractsfrom 1999 to 2006
Contracts for Other ADP and Telecommunications Services (includes data storage on tapes, compact disks, etc.), ADP Facility Operation and Maintenance Services, Kitchen Hand Tools and Utensils, ADP Software, and moreby Defense Information Systems Agency, Department of Defense, Department of Veterans Affairs, Office of the Chief Information Officer, and others Signed by year:2000: $105,990; 2001: $66,920; 2002: $66,920; 2003: $74,346; 2004: $17,780; 2005: $151,045; 2006: $0.
Biggest contracts:
$114,714 with Defense Information Systems Agency for Other ADP and Telecommunications Services (includes data storage on tapes, compact disks, etc.). Taking place in PA. Signed on 2005-10-20. Completion date: 2006-09-30.
$66,920 with Defense Information Systems Agency for Other ADP and Telecommunications Services (includes data storage on tapes, compact disks, etc.). Signed on 2003-10-01. Completion date: 2004-09-30.
$66,920 with Department of Defense for ADP Facility Operation and Maintenance Services. Signed on 2002-10-01. Completion date: 2003-09-30.
$66,920, same as above.Signed on 2001-10-01. Completion date: 2002-09-30.
AYERS REMODELING INC (907 CENTER DRIVE in FRANKLIN SQUAR, NY; small business) : $60,200 in 4 contractsfrom 2001 to 2004
$28,580 with Army for Maintenance, Repair or Alteration of Real Property -- Other Administrative Facilities and Service Buildings. Signed on 2004-09-18. Completion date: 2004-10-19.
$20,655 with Army for Carpet Laying and Cleaning. Signed on 2002-06-04. Completion date: 2002-03-05.
$6,710, same as above.Signed on 2003-05-22. Completion date: 2003-03-25.
$4,255 with Army for Maintenance, Repair or Alteration of Real Property -- Office Buildings. Signed on 2001-09-30. Completion date: 2001-10-30.
Top industries in this zip code by the number of employees in 2005:
2002 - 2018 National Fire Incident Reporting System (NFIRS) incidents
Based on the data from the years 2002 - 2018 the average number of fires per year is 38. The highest number of fires - 127 took place in 2012, and the least - 5 in 2002. The data has a growing trend.
When looking into fire subcategories, the most incidents belonged to: Other (49.5%), and Structure Fires (25.4%).
Fire incident types reported to NFIRS in Zip Code 11010


 Nearest zip codes: 11552, 11565, 11003, 11580, 11001, 11563.


 Based on the data from the years 2002 - 2018 the average number of fires per year is 38. The highest number of fires - 127 took place in 2012, and the least - 5 in 2002. The data has a growing trend.
 When looking into fire subcategories, the most incidents belonged to: Other (49.5%), and Structure Fires (25.4%).