Estimated zip code population in 2022: 21,442 Zip code population in 2010: 20,408 Zip code population in 2000: 19,278
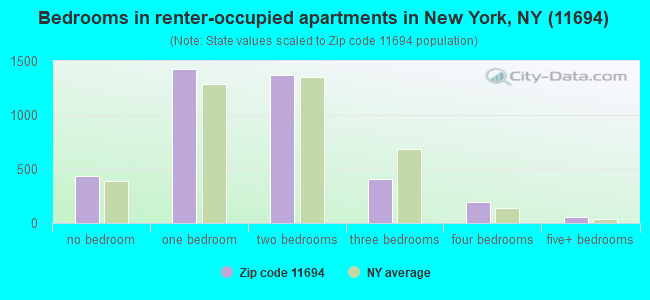
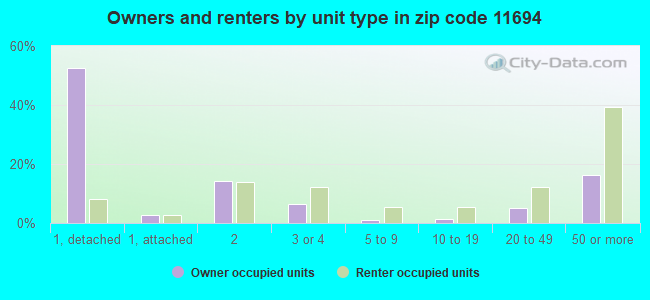
Houses and condos: 9,139 Renter-occupied apartments: 3,895
% of renters here:
48%
State:
46%
March 2022 cost of living index in zip code 11694: 150.1 (very high, U.S. average is 100)
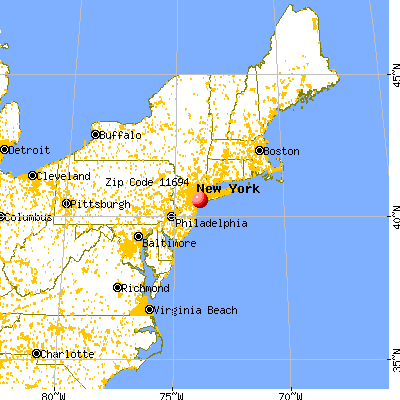
Land area: 1.4 sq. mi. Water area: 0.0 sq. mi.
Population density: 15,701 people per square mile
(very high).
OSM Map
General Map
Google Map
MSN Map
OSM Map
General Map
Google Map
MSN Map
OSM Map
General Map
Google Map
MSN Map
OSM Map
General Map
Google Map
MSN Map
Please wait while loading the map...
Real estate property taxes paid for housing units in 2022:
This zip code:
0.9% ($8,001)
New York:
1.5% ($6,180)
Median real estate property taxes paid for housing units with mortgages in 2022: $7,744 (0.9%) Median real estate property taxes paid for housing units with no mortgage in 2022: $8,180 (1.0%)
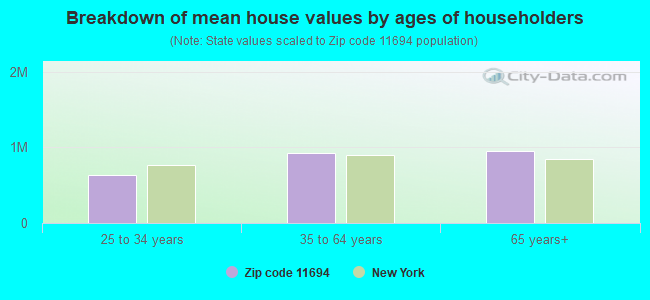
Estimated median house/condo value in 2022: $844,895
11694:
$844,895
New York:
$400,400
According to our research of New York and other state lists, there were 24 registered sex offenders living in 11694 zip code as of April 27, 2024. The ratio of all residents to sex offenders in zip code 11694 is 897 to 1. The ratio of registered sex offenders to all residents in this zip code is near the state average.
Median resident age:
This zip code:
44.8 years
New York median age:
40.0 years
Average household size:
This zip code:
2.5 people
New York:
2.5 people
Averages for the 2020 tax year for zip code 11694, filed in 2021:
Average Adjusted Gross Income (AGI) in 2020: $95,634 (Individual Income Tax Returns)
Here:
$95,634
State:
$90,930
Salary/wage: $79,965 (reported on 78.0% of returns)
Here:
$79,965
State:
$72,104
(% of AGI for various income ranges: 1024.2% for AGIs below $25k, 3519.0% for AGIs $25k-50k, 6655.7% for AGIs $50k-75k, 9614.0% for AGIs $75k-100k, 16585.3% for AGIs $100k-200k, 66819.1% for AGIs over 200k)
Taxable interest for individuals: $2,167 (reported on 41.6% of returns)
This zip code:
$2,167
New York:
$3,075
(% of AGI for various income ranges: 33.3% for AGIs below $25k, 33.7% for AGIs $25k-50k, 66.0% for AGIs $50k-75k, 106.9% for AGIs $75k-100k, 156.2% for AGIs $100k-200k, 1370.3% for AGIs over 200k)
Ordinary dividends: $7,788 (reported on 27.7% of returns)
Here:
$7,788
State:
$11,095
(% of AGI for various income ranges: 52.6% for AGIs below $25k, 81.4% for AGIs $25k-50k, 149.5% for AGIs $50k-75k, 192.6% for AGIs $75k-100k, 402.8% for AGIs $100k-200k, 3450.0% for AGIs over 200k)
Net capital gain/loss in AGI: +$20,968 (reported on 25.2% of returns)
Here:
+$20,968
State:
+$44,925
(% of AGI for various income ranges: 23.9% for AGIs below $25k, 51.2% for AGIs $25k-50k, 110.1% for AGIs $50k-75k, 177.6% for AGIs $75k-100k, 465.8% for AGIs $100k-200k, 12412.8% for AGIs over 200k)
Profit/loss from business: +$16,867 (reported on 13.7% of returns)
Here:
+$16,867
State:
+$14,940
(% of AGI for various income ranges: 161.3% for AGIs below $25k, 99.1% for AGIs $25k-50k, 168.2% for AGIs $50k-75k, 219.0% for AGIs $75k-100k, 445.8% for AGIs $100k-200k, 3073.1% for AGIs over 200k)
Taxable individual retirement arrangement distribution: $21,072 (reported on 8.9% of returns)
11694:
$21,072
New York:
$19,609
(% of AGI for various income ranges: 66.1% for AGIs below $25k, 95.0% for AGIs $25k-50k, 172.7% for AGIs $50k-75k, 253.4% for AGIs $75k-100k, 627.5% for AGIs $100k-200k, 1611.9% for AGIs over 200k)
Self-employed (Keogh) retirement plans: $29,650 (reported on 0.7% of returns)
11694:
$29,650
New York:
$32,497
(% of AGI for various income ranges: 51.9% for AGIs $100k-200k, 387.2% for AGIs over 200k)
Total itemized deductions: $30,519 (reported on 17.3% of returns)
Here:
$30,519
State:
$39,326
(% of AGI for various income ranges: 126.6% for AGIs below $25k, 165.5% for AGIs $25k-50k, 401.5% for AGIs $50k-75k, 917.3% for AGIs $75k-100k, 1556.3% for AGIs $100k-200k, 5755.0% for AGIs over 200k)
Charity contributions: $5,547 (reported on 15.9% of returns)
Here:
$5,547
State:
$15,420
(% of AGI for various income ranges: 9.2% for AGIs below $25k, 17.9% for AGIs $25k-50k, 54.8% for AGIs $50k-75k, 125.8% for AGIs $75k-100k, 235.6% for AGIs $100k-200k, 1210.0% for AGIs over 200k)
Taxes paid: $9,124 (reported on 17.3% of returns)
11694:
$9,124
State:
$9,183
(% of AGI for various income ranges: 27.8% for AGIs below $25k, 44.5% for AGIs $25k-50k, 131.4% for AGIs $50k-75k, 316.1% for AGIs $75k-100k, 531.1% for AGIs $100k-200k, 1456.9% for AGIs over 200k)
Earned income credit: $1,760 (reported on 8.3% of returns)
Here:
$1,760
State:
$2,138
(% of AGI for various income ranges: 56.6% for AGIs below $25k, 43.9% for AGIs $25k-50k)
Percentage of individuals using paid preparers for their 2020 taxes: 95.1%
Here:
95%
State:
95%
(% for various income ranges: 93.2% for AGIs below $25k, 94.7% for AGIs $25k-50k, 96.2% for AGIs $50k-75k, 96.9% for AGIs $75k-100k, 95.1% for AGIs $100k-200k, 97.6% for AGIs over 200k)
Averages for the 2012 tax year for zip code 11694, filed in 2013:
Average Adjusted Gross Income (AGI) in 2012: $91,399 (Individual Income Tax Returns)
Here:
$91,399
State:
$77,088
Salary/wage: $68,314 (reported on 79.0% of returns)
Here:
$68,314
State:
$60,593
(% of AGI for various income ranges: 64.6% for AGIs below $25k, 75.1% for AGIs $25k-50k, 73.7% for AGIs $50k-75k, 71.5% for AGIs $75k-100k, 70.5% for AGIs $100k-200k, 41.2% for AGIs over 200k)
Taxable interest for individuals: $2,064 (reported on 47.8% of returns)
This zip code:
$2,064
New York:
$3,125
(% of AGI for various income ranges: 2.2% for AGIs below $25k, 1.2% for AGIs $25k-50k, 1.2% for AGIs $50k-75k, 1.2% for AGIs $75k-100k, 1.0% for AGIs $100k-200k, 0.9% for AGIs over 200k)
Ordinary dividends: $14,902 (reported on 27.5% of returns)
Here:
$14,902
State:
$10,299
(% of AGI for various income ranges: 3.1% for AGIs below $25k, 1.4% for AGIs $25k-50k, 1.6% for AGIs $50k-75k, 1.7% for AGIs $75k-100k, 1.3% for AGIs $100k-200k, 8.7% for AGIs over 200k)
Net capital gain/loss in AGI: +$12,324 (reported on 23.5% of returns)
Here:
+$12,324
State:
+$42,474
(% of AGI for various income ranges: 0.3% for AGIs $50k-75k, 0.2% for AGIs $75k-100k, 1.0% for AGIs $100k-200k, 7.0% for AGIs over 200k)
Profit/loss from business: +$16,751 (reported on 14.1% of returns)
Here:
+$16,751
State:
+$16,168
(% of AGI for various income ranges: 9.6% for AGIs below $25k, 3.6% for AGIs $25k-50k, 2.0% for AGIs $50k-75k, 1.5% for AGIs $75k-100k, 2.4% for AGIs $100k-200k, 2.3% for AGIs over 200k)
Taxable individual retirement arrangement distribution: $20,458 (reported on 10.9% of returns)
11694:
$20,458
New York:
$17,621
(% of AGI for various income ranges: 3.4% for AGIs below $25k, 2.2% for AGIs $25k-50k, 2.4% for AGIs $50k-75k, 3.1% for AGIs $75k-100k, 2.6% for AGIs $100k-200k, 2.1% for AGIs over 200k)
Self-employment retirement plans: $18,200 (reported on 0.9% of returns)
11694:
$18,200
New York:
$27,330
Total itemized deductions: $66,289 (45% of AGI, reported on 52.6% of returns)
Here:
$66,289
State:
$34,985
Here:
44.5% of AGI
State:
21.3% of AGI
(% of AGI for various income ranges: 50.6% for AGIs below $25k, 35.4% for AGIs $25k-50k, 42.3% for AGIs $50k-75k, 41.3% for AGIs $75k-100k, 51.0% for AGIs $100k-200k, 27.1% for AGIs over 200k)
Charity contributions: $3,293 (reported on 46.9% of returns)
Here:
$3,293
State:
$5,572
(% of AGI for various income ranges: 1.1% for AGIs below $25k, 1.6% for AGIs $25k-50k, 2.1% for AGIs $50k-75k, 2.2% for AGIs $75k-100k, 2.0% for AGIs $100k-200k, 1.4% for AGIs over 200k)
Taxes paid: $16,713 (reported on 52.6% of returns)
11694:
$16,713
State:
$18,656
(% of AGI for various income ranges: 4.9% for AGIs below $25k, 4.5% for AGIs $25k-50k, 8.3% for AGIs $50k-75k, 9.3% for AGIs $75k-100k, 10.5% for AGIs $100k-200k, 10.8% for AGIs over 200k)
Earned income credit: $1,868 (reported on 11.7% of returns)
Here:
$1,868
State:
$2,230
(% of AGI for various income ranges: 4.7% for AGIs below $25k, 0.7% for AGIs $25k-50k)
Percentage of individuals using paid preparers for their 2012 taxes: 78.0%
Here:
78%
State:
66%
(% for various income ranges: 72.8% for AGIs below $25k, 74.2% for AGIs $25k-50k, 77.4% for AGIs $50k-75k, 80.9% for AGIs $75k-100k, 85.6% for AGIs $100k-200k, 90.2% for AGIs over 200k)
Averages for the 2004 tax year for zip code 11694, filed in 2005:
Average Adjusted Gross Income (AGI) in 2004: $73,150 (Individual Income Tax Returns)
Here:
$73,150
State:
$59,519
Salary/wage: $61,304 (reported on 78.9% of returns)
Here:
$61,304
State:
$50,673
(% of AGI for various income ranges: 161.3% for AGIs below $10k, 65.1% for AGIs $10k-25k, 80.3% for AGIs $25k-50k, 77.2% for AGIs $50k-75k, 76.8% for AGIs $75k-100k, 58.1% for AGIs over 100k)
Taxable interest for individuals: $3,121 (reported on 62.2% of returns)
This zip code:
$3,121
New York:
$2,377
(% of AGI for various income ranges: 37.4% for AGIs below $10k, 4.5% for AGIs $10k-25k, 2.1% for AGIs $25k-50k, 1.9% for AGIs $50k-75k, 1.7% for AGIs $75k-100k, 2.7% for AGIs over 100k)
Taxable dividends: $4,145 (reported on 34.3% of returns)
Here:
$4,145
State:
$5,394
(% of AGI for various income ranges: 16.0% for AGIs below $10k, 3.6% for AGIs $10k-25k, 1.7% for AGIs $25k-50k, 1.6% for AGIs $50k-75k, 1.3% for AGIs $75k-100k, 2.0% for AGIs over 100k)
Net capital gain/loss: +$8,460 (reported on 29.8% of returns)
Here:
+$8,460
State:
+$23,581
(% of AGI for various income ranges: -8.1% for AGIs below $10k, -0.3% for AGIs $10k-25k, -0.3% for AGIs $25k-50k, 0.5% for AGIs $50k-75k, 0.7% for AGIs $75k-100k, 5.7% for AGIs over 100k)
Profit/loss from business: +$19,059 (reported on 13.3% of returns)
Here:
+$19,059
State:
+$13,809
(% of AGI for various income ranges: 25.4% for AGIs below $10k, 6.5% for AGIs $10k-25k, 2.4% for AGIs $25k-50k, 2.2% for AGIs $50k-75k, 1.7% for AGIs $75k-100k, 3.9% for AGIs over 100k)
IRA payment deduction: $3,486 (reported on 3.7% of returns)
11694:
$3,486
New York:
$3,115
(% of AGI for various income ranges: 0.4% for AGIs $10k-25k, 0.4% for AGIs $25k-50k, 0.2% for AGIs $50k-75k, 0.2% for AGIs $75k-100k, 0.1% for AGIs over 100k)
Self-employed pension: $21,127 (reported on 1.7% of returns)
Here:
$21,127
New York:
$19,016
(% of AGI for various income ranges: 0.3% for AGIs $10k-25k, 0.2% for AGIs $50k-75k, 0.8% for AGIs over 100k)
Total itemized deductions: $28,893 (24% of AGI, reported on 51.9% of returns)
Here:
$28,893
State:
$25,864
Here:
24.2% of AGI
State:
21.9% of AGI
(% of AGI for various income ranges: 32.4% for AGIs below $10k, 17.8% for AGIs $10k-25k, 18.8% for AGIs $25k-50k, 22.4% for AGIs $50k-75k, 22.6% for AGIs $75k-100k, 20.1% for AGIs over 100k)
Charity contributions deductions: $4,003 (4% of AGI, reported on 50.0% of returns)
Here:
$4,003
State:
$4,439
Here:
3.5% of AGI
State:
3.6% of AGI
(% of AGI for various income ranges: 2.2% for AGIs below $10k, 2.0% for AGIs $10k-25k, 3.0% for AGIs $25k-50k, 3.3% for AGIs $50k-75k, 3.3% for AGIs $75k-100k, 2.5% for AGIs over 100k)
Total tax: $14,186 (reported on 80.1% of returns)
11694:
$14,186
State:
$11,730
(% of AGI for various income ranges: 6.8% for AGIs below $10k, 3.9% for AGIs $10k-25k, 7.1% for AGIs $25k-50k, 9.9% for AGIs $50k-75k, 10.6% for AGIs $75k-100k, 20.3% for AGIs over 100k)
Earned income credit: $1,596 (reported on 9.8% of returns)
Here:
$1,596
State:
$1,757
Percentage of individuals using paid preparers for their 2004 taxes: 75.5%
Here:
76%
State:
67%
(% for various income ranges: 66.4% for AGIs below $10k, 73.6% for AGIs $10k-25k, 74.6% for AGIs $25k-50k, 78.7% for AGIs $50k-75k, 79.0% for AGIs $75k-100k, 83.0% for AGIs over 100k)
Likely homosexual households (counted as self-reported same-sex unmarried-partner households)
Lesbian couples: 0.4% of all households
Gay men: 0.0% of all households
Household received Food Stamps/SNAP in the past 12 months: 907 Household did not receive Food Stamps/SNAP in the past 12 months: 7,215
Women who had a birth in the past 12 months: 216 (212 now married, 0 unmarried) Women who did not have a birth in the past 12 months: 3,742 (1,523 now married, 2,211 unmarried)
Housing units in zip code 11694 with a mortgage: 2,281 (261 second mortgage, 13 home equity loan, 192 both second mortgage and home equity loan) Houses without a mortgage: 6
Median monthly owner costs for units with a mortgage: $3,621 Median monthly owner costs for units without a mortgage: $1,334
Residents with income below the poverty level in 2022:
This zip code:
12.8%
Whole state:
14.3%
Residents with income below 50% of the poverty level in 2022:
This zip code:
7.1%
Whole state:
6.8%
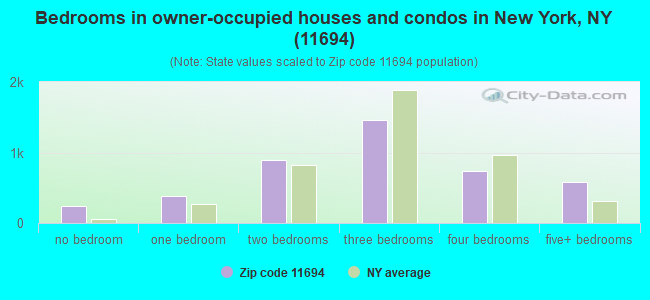
Median number of rooms in houses and condos:
Here:
6.0
State:
6.3
Median number of rooms in apartments:
Here:
3.8
State:
3.8
Notable locations in this zip code not listed on our city pages
Notable locations in zip code 11694: Holland Station (A), Rockaway Park Station (B), Seaside Station (C), Fire Department New York Engine 268 Ladder 137 (D), New York Ladder Company 137 (E). Display/hide their locations on the map
Churches in zip code 11694 include: West End Temple (A), Saint Francis De Sales Church (B), Saint Camillus Church (C), Congregation Ohav Zedek (D). Display/hide their locations on the map
Parks in zip code 11694 include: Rockaway Playland (1), Bayside Playground (2), Seaside Playground (3), Veteran's Circle (4), Patricia A Brackley Park (5), Gwirtzman Triangle (6). Display/hide their locations on the map
In group quarters: 1,445 (-1 institutionalized population)
Size of family households: 2,082 2-persons, 1,320 3-persons, 732 4-persons, 413 5-persons, 152 6-persons, 199 7-or-more-persons
Size of nonfamily households: 2,787 1-person, 485 2-persons, 9 3-persons
3,075 married couples with children.
910 single-parent households (246 men, 664 women).
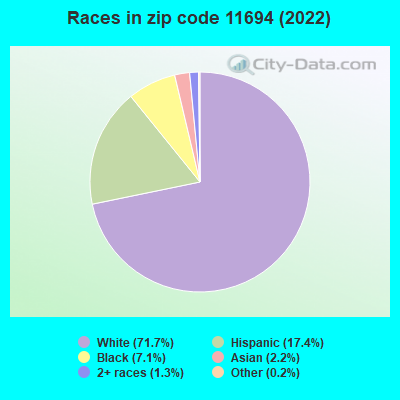
80.7% of residents of 11694 zip code speak English at home.
8.3% of residents speak Spanish at home (71% very well, 14% well, 15% not well, 1% not at all).
5.6% of residents speak other Indo-European language at home (60% very well, 27% well, 10% not well, 3% not at all).
2.3% of residents speak Asian or Pacific Island language at home (47% very well, 14% well, 29% not well, 9% not at all).
3.6% of residents speak other language at home (86% very well, 10% well, 1% not well, 2% not at all).
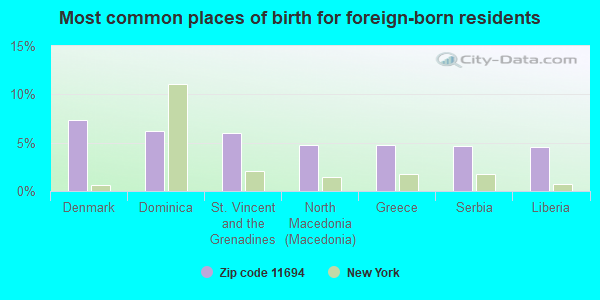
Foreign born population: 2,967 (13.8%) (64.8% of them are naturalized citizens)
This zip code:
13.8%
Whole state:
22.7%
7%Denmark
6%Dominica
6%St. Vincent and the Grenadines
5%North Macedonia (Macedonia)
5%Greece
5%Serbia
5%Liberia
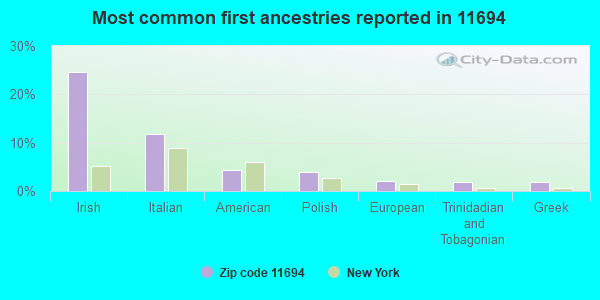
25%Irish
12%Italian
4%American
4%Polish
2%European
2%Trinidadian and Tobagonian
2%Greek
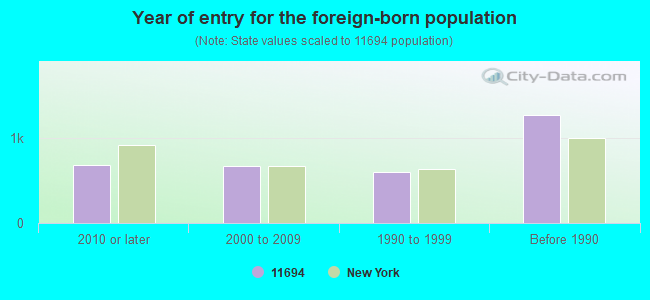
Year of entry for the foreign-born population
6822010 or later
6742000 to 2009
6011990 to 1999
1,269Before 1990
Facilities with environmental interests located in this zip code:
HARBOR CLEANERS (414 BEACH 129TH STREET in ROCKAWAY PARK, NY)
AIR MINOR (AIRS/AFS) STATE MASTER (New York facility tracking) - AIR PROGRAM Small Quantity Generators, between 100 kg and 1000 kg of hazardous waste/month (Resource Conservation and Recovery Act (tracking hazardous waste)) Business SIC classification: DRYCLEANING PLANTS, EXCEPT RUG CLEANING Business NAICS classification: DRYCLEANING AND LAUNDRY SERVICES (EXCEPT COIN-OPERATED). Organizations: YOUNG WON CHA (CONTACT/OPERATOR)
, HARBOR CLEANING CORP (LEGALLY RESPONSIBLE PARTY)
Alternative names: HARBOUR CLEANING CORP
HARBOUR CLEANER (424 BEACH 129TH ST in ROCKAWAY PARK, NY)
AIR MINOR (AIRS/AFS) STATE MASTER (New York facility tracking) - AIR PROGRAM (Resource Conservation and Recovery Act (tracking hazardous waste)) Business SIC classification: DRYCLEANING PLANTS, EXCEPT RUG CLEANING Business NAICS classification: DRYCLEANING AND LAUNDRY SERVICES (EXCEPT COIN-OPERATED). Organizations: HARBOUR CLEANERS & TAILORS (LEGALLY RESPONSIBLE PARTY)
BELL BOY DRIVE IN CLEANERS (11313 BEACH CHANNEL DRIVE in ROCKAWAY PARK, NY)
AIR MINOR (AIRS/AFS) Small Quantity Generators, between 100 kg and 1000 kg of hazardous waste/month (Resource Conservation and Recovery Act (tracking hazardous waste)) - notification Business SIC classification: DRYCLEANING PLANTS, EXCEPT RUG CLEANING Organizations: BELLE HARBOR GARMENT CARE INC (CONTACT/OWNER)
, LARRY HARWOOD (CONTACT/OWNER)
Alternative names: BELL BOY CLEANERS, BELL HARBOR GARMENT CARE
BELLE HARBOR SHOPPING CENTER (112-15 BEACH CHANNEL DR in FAR ROCKAWAY, NY)
Large Quantity Generators, more that 1000 kg of hazardous waste/month (Resource Conservation and Recovery Act (tracking hazardous waste)) Organizations: THE GREAT ATLANTIC & PACIFIC TEA CO INC (CONTACT/OPERATOR)
, BENENSON BELLE HARBOR LLC (CONTACT/OWNER)
CHOI'S RAINBOW CLEANERS (114-11 BEACH CHANNEL DR in ROCKAWAY PARK, NY)
AIR MINOR (AIRS/AFS) Conditionally Exempt Small Quantity Generators, less than 100 kg/month of hazardous waste (Resource Conservation and Recovery Act (tracking hazardous waste)) - notification Business SIC classification: DRYCLEANING PLANTS, EXCEPT RUG CLEANING Organizations: AL ROSENTHAL (CONTACT/OWNER)
123-10 OCEAN PROMENADE BUILDING (123-10 OCEAN PROMENADE in QUEENS, NY)
AIR MINOR (AIRS/AFS) Business SIC classification: OPERATORS OF APARTMENT BUILDINGS
160 BEACH 117TH ST BUILDING (160 BEACH 117TH ST in ROCKAWAY PARK, NY)
AIR MINOR (AIRS/AFS) Business SIC classification: OPERATORS OF APARTMENT BUILDINGS
GETTY PETROLEUM CORP (100-17 BEACH CHANNEL DR in ROCKAWAY PARK, NY)
(Resource Conservation and Recovery Act (tracking hazardous waste))
CHENGS FAMILY INC TA BRIGHTON CLEANERS (173 BEACH 116TH ST in ROCKAWAY PARK, NY)
(Resource Conservation and Recovery Act (tracking hazardous waste))
HARBOR AUTO BODY INC (112-16 BEACH CHANNEL DR in ROCKAWAY PARK, NY)
Small Quantity Generators, between 100 kg and 1000 kg of hazardous waste/month (Resource Conservation and Recovery Act (tracking hazardous waste)) - notification Organizations: TOM MCNICOLUS (CONTACT/OWNER)
1 BEACH 105TH ST BUILDING (1 BEACH 105TH ST in QUEENS, NY)
AIR SYNTHETIC MINOR (AIRS/AFS) Business SIC classification: OPERATORS OF APARTMENT BUILDINGS
106-20 SHORE FRONT PKWY BUILDING (106-20 SHORE FRONT PKWY in QUEENS, NY)
AIR SYNTHETIC MINOR (AIRS/AFS) Business SIC classification: OPERATORS OF APARTMENT BUILDINGS Alternative names: 106-20 SHORE FRONT PARKWAY BUILDING
107-10 SHORE FRONT PKWY BUILDING (107-10 SHORE FRONT PKWY in QUEENS, NY)
AIR SYNTHETIC MINOR (AIRS/AFS) Business SIC classification: OPERATORS OF APARTMENT BUILDINGS Alternative names: 107-10 SHORE FRONT PARKWAY BUILDING
Housing units lacking complete plumbing facilities: 0.1% Housing units lacking complete kitchen facilities: 0.9%
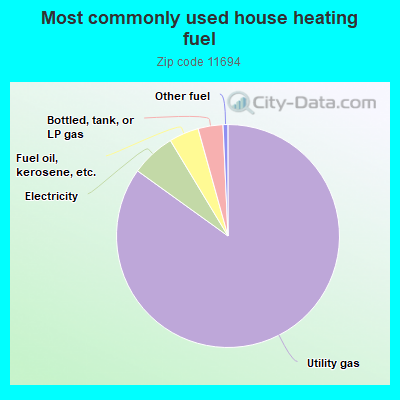
84.6%Utility gas
6.4%Electricity
4.3%Fuel oil, kerosene, etc.
3.6%Bottled, tank, or LP gas
0.7%Other fuel
Population in 1990: 21,972.
Place of birth for U.S.-born residents:
This state: 16,715
Northeast: 472
Midwest: 112
South: 597
West: 220
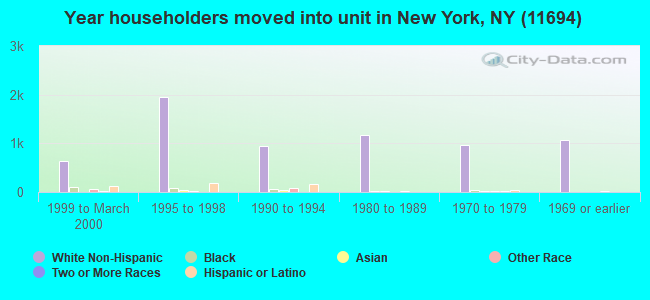
64% of the 11694 zip code residents lived in the same house 5 years ago. Out of people who lived in different houses, 59% lived in this county. Out of people who lived in different counties, 50% lived in New York.
90% of the 11694 zip code residents lived in the same house 1 year ago. Out of people who lived in different houses, 46% moved from this county. Out of people who lived in different houses, 45% moved from different county within same state. Out of people who lived in different houses, 6% moved from different state. Out of people who lived in different houses, 2% moved from abroad.
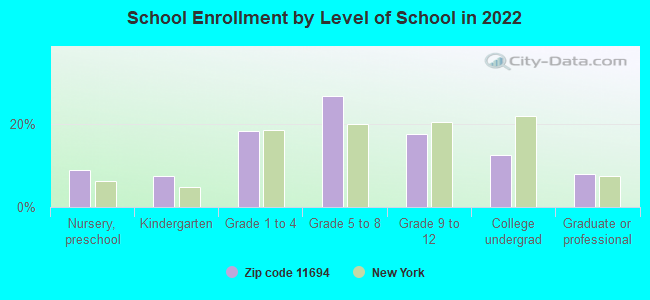
Private vs. public school enrollment:
Students in private schools in grades 1 to 8 (elementary and middle school): 607
Here:
28.1%
New York:
15.6%
Students in private schools in grades 9 to 12 (high school): 406
Here:
47.9%
New York:
15.0%
Students in private undergraduate colleges: 276
Here:
46.0%
New York:
39.2%
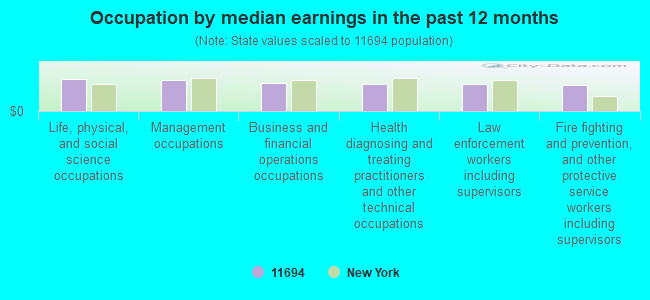
Occupation by median earnings in the past 12 months ($)
111,030Life, physical, and social science occupations
107,717Management occupations
96,951Business and financial operations occupations
93,111Health diagnosing and treating practitioners and other technical occupations
92,131Law enforcement workers including supervisors
89,382Fire fighting and prevention, and other protective service workers including supervisors
Companies with federal contracts located in this zip code:
NATIONAL HISPANIC COLLEGE FAIR (13502 ROCKAWAY BEACH BLVD in FAR ROCKAWAY, NY) : $28,910 in 4 contractsfrom 2004 to 2006
$9,875 with Air Force for Other Professional Services. Taking place in AL. Signed on 2005-08-25. Completion date: 2005-09-24.
$7,975, same as above.Signed on 2006-03-02. Completion date: 2006-03-24.
$6,715, same as above.Signed on 2005-02-04. Completion date: 2005-02-07.
$4,345 with Air Force for Other Professional Services. Signed on 2004-10-27. Completion date: 2004-10-30.
Top industries in this zip code by the number of employees in 2005:
Administrative and Support and Waste Management and Remediation Services: Office Administrative Services (250-499 employees: 1 establishment)
Health Care and Social Assistance: Other Residential Care Facilities (100-249: 1, 20-49: 1)
Health Care and Social Assistance: Nursing Care Facilities (100-249: 1)
2007 - 2018 National Fire Incident Reporting System (NFIRS) incidents
Based on the data from the years 2007 - 2018 the average number of fire incidents per year is 63. The highest number of fire incidents - 80 took place in 2015, and the least - 43 in 2018. The data has a dropping trend.
When looking into fire subcategories, the most incidents belonged to: Structure Fires (58.8%), and Outside Fires (30.9%).
Fire incident types reported to NFIRS in Zip Code 11694


 Nearest zip codes: 11693, 11692, 11234, 11239, 11697, 11414.
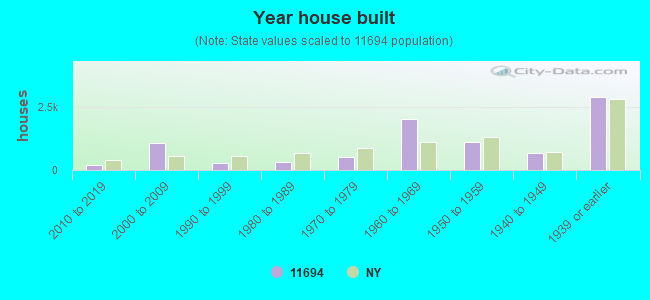


 Based on the data from the years 2007 - 2018 the average number of fire incidents per year is 63. The highest number of fire incidents - 80 took place in 2015, and the least - 43 in 2018. The data has a dropping trend.
 When looking into fire subcategories, the most incidents belonged to: Structure Fires (58.8%), and Outside Fires (30.9%).