Estimated zip code population in 2022: 13,342 Zip code population in 2010: 11,916 Zip code population in 2000: 11,157
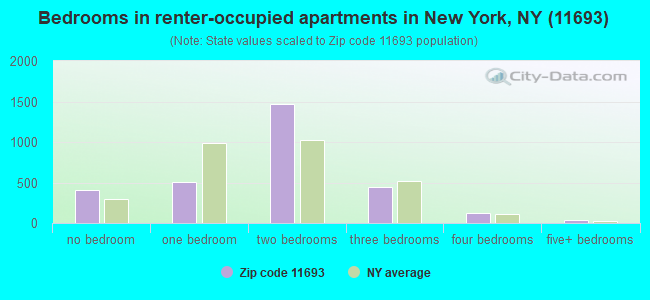
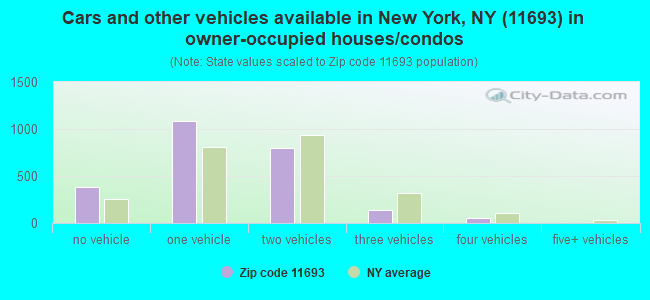
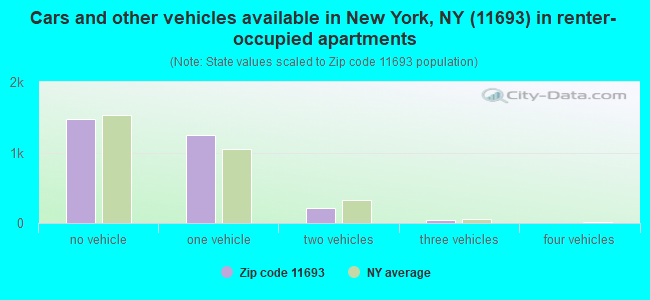
Houses and condos: 5,829 Renter-occupied apartments: 2,974
% of renters here:
55%
State:
46%
March 2022 cost of living index in zip code 11693: 145.2 (very high, U.S. average is 100)
Land area: 1.0 sq. mi. Water area: 0.0 sq. mi.
Population density: 13,380 people per square mile
(very high).
OSM Map
General Map
Google Map
MSN Map
OSM Map
General Map
Google Map
MSN Map
OSM Map
General Map
Google Map
MSN Map
OSM Map
General Map
Google Map
MSN Map
Please wait while loading the map...
Real estate property taxes paid for housing units in 2022:
This zip code:
0.7% ($3,483)
New York:
1.5% ($6,180)
Median real estate property taxes paid for housing units with mortgages in 2022: $3,577 (0.7%) Median real estate property taxes paid for housing units with no mortgage in 2022: $3,334 (0.8%)
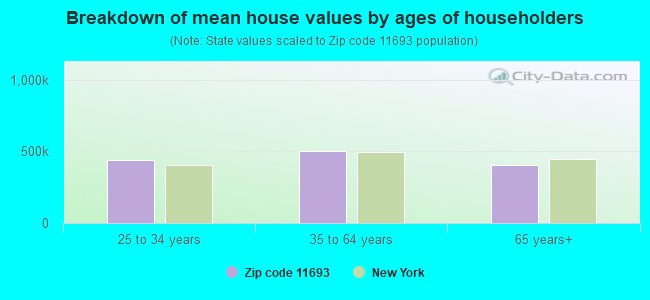
Estimated median house/condo value in 2022: $478,270
11693:
$478,270
New York:
$400,400
According to our research of New York and other state lists, there were 10 registered sex offenders living in 11693 zip code as of April 27, 2024. The ratio of all residents to sex offenders in zip code 11693 is 1,219 to 1. The ratio of registered sex offenders to all residents in this zip code is lower than the state average.
Median resident age:
This zip code:
45.0 years
New York median age:
40.0 years
Average household size:
This zip code:
2.4 people
New York:
2.5 people
Averages for the 2020 tax year for zip code 11693, filed in 2021:
Average Adjusted Gross Income (AGI) in 2020: $56,765 (Individual Income Tax Returns)
Here:
$56,765
State:
$90,930
Salary/wage: $53,454 (reported on 80.6% of returns)
Here:
$53,454
State:
$72,104
(% of AGI for various income ranges: 949.4% for AGIs below $25k, 3457.1% for AGIs $25k-50k, 6842.9% for AGIs $50k-75k, 9568.6% for AGIs $75k-100k, 17503.3% for AGIs $100k-200k, 54495.0% for AGIs over 200k)
Taxable interest for individuals: $915 (reported on 25.3% of returns)
This zip code:
$915
New York:
$3,075
(% of AGI for various income ranges: 11.5% for AGIs below $25k, 13.2% for AGIs $25k-50k, 30.9% for AGIs $50k-75k, 58.9% for AGIs $75k-100k, 86.9% for AGIs $100k-200k, 340.0% for AGIs over 200k)
Ordinary dividends: $2,285 (reported on 12.1% of returns)
Here:
$2,285
State:
$11,095
(% of AGI for various income ranges: 9.5% for AGIs below $25k, 16.7% for AGIs $25k-50k, 31.4% for AGIs $50k-75k, 48.9% for AGIs $75k-100k, 102.2% for AGIs $100k-200k, 705.0% for AGIs over 200k)
Net capital gain/loss in AGI: +$5,658 (reported on 11.9% of returns)
Here:
+$5,658
State:
+$44,925
(% of AGI for various income ranges: 2.6% for AGIs below $25k, 20.2% for AGIs $25k-50k, 38.7% for AGIs $50k-75k, 104.5% for AGIs $75k-100k, 265.3% for AGIs $100k-200k, 3028.3% for AGIs over 200k)
Profit/loss from business: +$8,831 (reported on 14.9% of returns)
Here:
+$8,831
State:
+$14,940
(% of AGI for various income ranges: 192.8% for AGIs below $25k, 130.6% for AGIs $25k-50k, 112.9% for AGIs $50k-75k, 68.2% for AGIs $75k-100k, 222.2% for AGIs $100k-200k, 2816.7% for AGIs over 200k)
Taxable individual retirement arrangement distribution: $12,859 (reported on 4.4% of returns)
11693:
$12,859
New York:
$19,609
(% of AGI for various income ranges: 35.1% for AGIs below $25k, 47.8% for AGIs $25k-50k, 92.2% for AGIs $50k-75k, 119.3% for AGIs $75k-100k, 255.3% for AGIs $100k-200k)
Total itemized deductions: $24,807 (reported on 9.5% of returns)
Here:
$24,807
State:
$39,326
(% of AGI for various income ranges: 34.5% for AGIs below $25k, 83.0% for AGIs $25k-50k, 261.6% for AGIs $50k-75k, 610.9% for AGIs $75k-100k, 1217.6% for AGIs $100k-200k, 4060.0% for AGIs over 200k)
Charity contributions: $4,627 (reported on 8.5% of returns)
Here:
$4,627
State:
$15,420
(% of AGI for various income ranges: 18.9% for AGIs $25k-50k, 44.3% for AGIs $50k-75k, 124.1% for AGIs $75k-100k, 198.0% for AGIs $100k-200k, 580.0% for AGIs over 200k)
Taxes paid: $8,405 (reported on 9.5% of returns)
11693:
$8,405
State:
$9,183
(% of AGI for various income ranges: 6.8% for AGIs below $25k, 23.0% for AGIs $25k-50k, 80.1% for AGIs $50k-75k, 220.0% for AGIs $75k-100k, 478.2% for AGIs $100k-200k, 1056.7% for AGIs over 200k)
Earned income credit: $2,091 (reported on 17.8% of returns)
Here:
$2,091
State:
$2,138
(% of AGI for various income ranges: 107.1% for AGIs below $25k, 69.2% for AGIs $25k-50k)
Percentage of individuals using paid preparers for their 2020 taxes: 93.1%
Here:
93%
State:
95%
(% for various income ranges: 90.9% for AGIs below $25k, 95.0% for AGIs $25k-50k, 91.8% for AGIs $50k-75k, 95.2% for AGIs $75k-100k, 94.9% for AGIs $100k-200k, 93.3% for AGIs over 200k)
Averages for the 2012 tax year for zip code 11693, filed in 2013:
Average Adjusted Gross Income (AGI) in 2012: $45,904 (Individual Income Tax Returns)
Here:
$45,904
State:
$77,088
Salary/wage: $45,315 (reported on 82.5% of returns)
Here:
$45,315
State:
$60,593
(% of AGI for various income ranges: 63.0% for AGIs below $25k, 82.0% for AGIs $25k-50k, 84.4% for AGIs $50k-75k, 83.3% for AGIs $75k-100k, 85.7% for AGIs $100k-200k, 76.7% for AGIs over 200k)
Taxable interest for individuals: $538 (reported on 29.7% of returns)
This zip code:
$538
New York:
$3,125
(% of AGI for various income ranges: 0.6% for AGIs below $25k, 0.5% for AGIs $25k-50k, 0.3% for AGIs $50k-75k, 0.2% for AGIs $75k-100k, 0.3% for AGIs $100k-200k, 0.2% for AGIs over 200k)
Ordinary dividends: $2,093 (reported on 10.4% of returns)
Here:
$2,093
State:
$10,299
(% of AGI for various income ranges: 0.6% for AGIs below $25k, 0.4% for AGIs $25k-50k, 0.5% for AGIs $50k-75k, 0.5% for AGIs $75k-100k, 0.6% for AGIs $100k-200k)
Profit/loss from business: +$8,135 (reported on 16.0% of returns)
Here:
+$8,135
State:
+$16,168
(% of AGI for various income ranges: 17.6% for AGIs below $25k, 2.3% for AGIs $25k-50k, 0.5% for AGIs $50k-75k, 0.7% for AGIs $75k-100k, 1.1% for AGIs $100k-200k)
Taxable individual retirement arrangement distribution: $9,557 (reported on 5.6% of returns)
11693:
$9,557
New York:
$17,621
(% of AGI for various income ranges: 1.5% for AGIs below $25k, 1.5% for AGIs $25k-50k, 1.2% for AGIs $50k-75k, 1.1% for AGIs $75k-100k, 1.1% for AGIs $100k-200k)
Total itemized deductions: $33,798 (43% of AGI, reported on 39.4% of returns)
Here:
$33,798
State:
$34,985
Here:
43.2% of AGI
State:
21.3% of AGI
(% of AGI for various income ranges: 11.5% for AGIs below $25k, 21.4% for AGIs $25k-50k, 28.2% for AGIs $50k-75k, 33.3% for AGIs $75k-100k, 38.5% for AGIs $100k-200k, 33.0% for AGIs over 200k)
Charity contributions: $2,513 (reported on 33.4% of returns)
Here:
$2,513
State:
$5,572
(% of AGI for various income ranges: 0.6% for AGIs below $25k, 1.6% for AGIs $25k-50k, 2.3% for AGIs $50k-75k, 2.3% for AGIs $75k-100k, 1.9% for AGIs $100k-200k, 0.9% for AGIs over 200k)
Taxes paid: $7,691 (reported on 39.2% of returns)
11693:
$7,691
State:
$18,656
(% of AGI for various income ranges: 1.3% for AGIs below $25k, 3.6% for AGIs $25k-50k, 6.4% for AGIs $50k-75k, 7.7% for AGIs $75k-100k, 9.3% for AGIs $100k-200k, 11.1% for AGIs over 200k)
Earned income credit: $2,367 (reported on 24.1% of returns)
Here:
$2,367
State:
$2,230
(% of AGI for various income ranges: 10.1% for AGIs below $25k, 0.9% for AGIs $25k-50k)
Percentage of individuals using paid preparers for their 2012 taxes: 72.9%
Here:
73%
State:
66%
(% for various income ranges: 68.2% for AGIs below $25k, 71.8% for AGIs $25k-50k, 75.0% for AGIs $50k-75k, 78.0% for AGIs $75k-100k, 86.0% for AGIs $100k-200k, 100.0% for AGIs over 200k)
Averages for the 2004 tax year for zip code 11693, filed in 2005:
Average Adjusted Gross Income (AGI) in 2004: $37,754 (Individual Income Tax Returns)
Here:
$37,754
State:
$59,519
Salary/wage: $37,561 (reported on 86.4% of returns)
Here:
$37,561
State:
$50,673
(% of AGI for various income ranges: 85.1% for AGIs below $10k, 73.6% for AGIs $10k-25k, 87.7% for AGIs $25k-50k, 88.3% for AGIs $50k-75k, 88.8% for AGIs $75k-100k, 84.6% for AGIs over 100k)
Taxable interest for individuals: $776 (reported on 42.4% of returns)
This zip code:
$776
New York:
$2,377
(% of AGI for various income ranges: 3.2% for AGIs below $10k, 1.5% for AGIs $10k-25k, 1.0% for AGIs $25k-50k, 0.7% for AGIs $50k-75k, 0.6% for AGIs $75k-100k, 0.6% for AGIs over 100k)
Taxable dividends: $1,624 (reported on 14.2% of returns)
Here:
$1,624
State:
$5,394
(% of AGI for various income ranges: 2.2% for AGIs below $10k, 0.8% for AGIs $10k-25k, 0.7% for AGIs $25k-50k, 0.5% for AGIs $50k-75k, 0.4% for AGIs $75k-100k, 0.7% for AGIs over 100k)
Net capital gain/loss: +$1,065 (reported on 9.8% of returns)
Here:
+$1,065
State:
+$23,581
(% of AGI for various income ranges: -1.8% for AGIs below $10k, 0.3% for AGIs $10k-25k, -0.0% for AGIs $25k-50k, -0.1% for AGIs $50k-75k, -0.2% for AGIs $75k-100k, 2.2% for AGIs over 100k)
Profit/loss from business: +$5,927 (reported on 10.5% of returns)
Here:
+$5,927
State:
+$13,809
(% of AGI for various income ranges: 16.0% for AGIs below $10k, 6.5% for AGIs $10k-25k, 0.7% for AGIs $25k-50k, 0.9% for AGIs $50k-75k, 0.6% for AGIs $75k-100k, 0.5% for AGIs over 100k)
IRA payment deduction: $2,822 (reported on 2.8% of returns)
11693:
$2,822
New York:
$3,115
(% of AGI for various income ranges: 0.3% for AGIs $10k-25k, 0.3% for AGIs $25k-50k, 0.2% for AGIs $50k-75k, 0.2% for AGIs $75k-100k)
Total itemized deductions: $17,871 (29% of AGI, reported on 40.2% of returns)
Here:
$17,871
State:
$25,864
Here:
29.0% of AGI
State:
21.9% of AGI
(% of AGI for various income ranges: 6.4% for AGIs below $10k, 8.9% for AGIs $10k-25k, 16.8% for AGIs $25k-50k, 22.7% for AGIs $50k-75k, 23.6% for AGIs $75k-100k, 21.3% for AGIs over 100k)
Charity contributions deductions: $2,985 (5% of AGI, reported on 38.4% of returns)
Here:
$2,985
State:
$4,439
Here:
4.8% of AGI
State:
3.6% of AGI
(% of AGI for various income ranges: 0.6% for AGIs below $10k, 1.2% for AGIs $10k-25k, 3.1% for AGIs $25k-50k, 3.7% for AGIs $50k-75k, 3.5% for AGIs $75k-100k, 3.0% for AGIs over 100k)
Total tax: $4,276 (reported on 72.1% of returns)
11693:
$4,276
State:
$11,730
(% of AGI for various income ranges: 3.1% for AGIs below $10k, 3.5% for AGIs $10k-25k, 6.1% for AGIs $25k-50k, 8.7% for AGIs $50k-75k, 9.4% for AGIs $75k-100k, 13.9% for AGIs over 100k)
Earned income credit: $1,859 (reported on 21.6% of returns)
Here:
$1,859
State:
$1,757
Percentage of individuals using paid preparers for their 2004 taxes: 73.7%
Here:
74%
State:
67%
(% for various income ranges: 66.5% for AGIs below $10k, 73.5% for AGIs $10k-25k, 73.0% for AGIs $25k-50k, 78.4% for AGIs $50k-75k, 79.5% for AGIs $75k-100k, 83.3% for AGIs over 100k)
Household received Food Stamps/SNAP in the past 12 months: 1,208 Household did not receive Food Stamps/SNAP in the past 12 months: 4,221
Women who had a birth in the past 12 months: 139 (35 now married, 107 unmarried) Women who did not have a birth in the past 12 months: 3,133 (797 now married, 2,353 unmarried)
Housing units in zip code 11693 with a mortgage: 1,338 (21 second mortgage, 21 both second mortgage and home equity loan) Houses without a mortgage: 7
Median monthly owner costs for units with a mortgage: $2,328 Median monthly owner costs for units without a mortgage: $771
Residents with income below the poverty level in 2022:
This zip code:
18.6%
Whole state:
14.3%
Residents with income below 50% of the poverty level in 2022:
This zip code:
9.4%
Whole state:
6.8%
Median number of rooms in houses and condos:
Here:
4.9
State:
6.3
Median number of rooms in apartments:
Here:
3.9
State:
3.8
Notable locations in this zip code not listed on our city pages
Parks in zip code 11693 include: Veterans Park (1), Gene Gray Playground (2), Broad Channel Park (3), Broad Channel Community Park (4). Display/hide their locations on the map
In group quarters: 322 (-1 institutionalized population)
Size of family households: 1,874 2-persons, 722 3-persons, 547 4-persons, 229 5-persons, 204 6-persons, 35 7-or-more-persons
Size of nonfamily households: 1,543 1-person, 142 2-persons, 78 3-persons
1,178 married couples with children.
1,116 single-parent households (120 men, 996 women).
62.3% of residents of 11693 zip code speak English at home.
19.0% of residents speak Spanish at home (69% very well, 17% well, 14% not well).
16.3% of residents speak other Indo-European language at home (46% very well, 18% well, 34% not well, 2% not at all).
0.9% of residents speak Asian or Pacific Island language at home (41% very well, 28% well, 21% not well, 11% not at all).
0.8% of residents speak other language at home (100% very well).
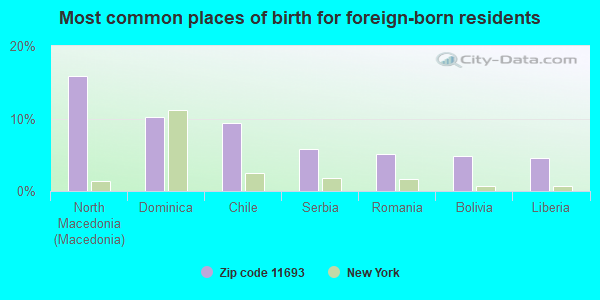
Foreign born population: 3,532 (26.5%) (70.1% of them are naturalized citizens)
This zip code:
26.5%
Whole state:
22.7%
16%North Macedonia (Macedonia)
10%Dominica
9%Chile
6%Serbia
5%Romania
5%Bolivia
4%Liberia
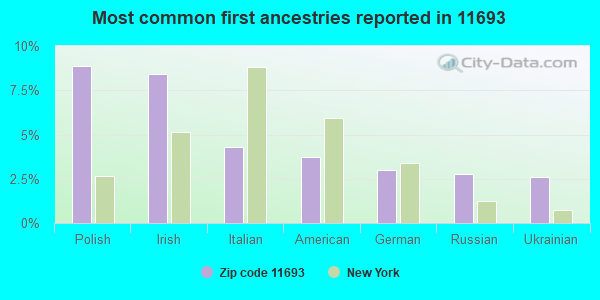
9%Polish
8%Irish
4%Italian
4%American
3%German
3%Russian
3%Ukrainian
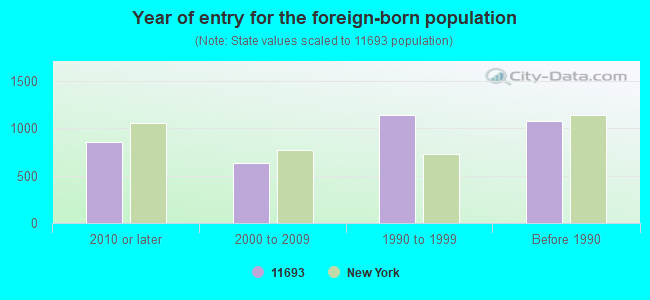
Year of entry for the foreign-born population
8492010 or later
6312000 to 2009
1,1391990 to 1999
1,076Before 1990
Public elementary/middle school in in zip code 11693 not listed on the city page:
PS 47 CHRIS GALAS(Students: 243, Location: 9 POWER RD, Grades: PK-8)
Facilities with environmental interests located in this zip code:
78-00 SHORE FRONT PARKWAY - SAFETY LEAD SERVICES CORPORATION (78-00 SHORE FRONT PARKWAY in BROOKLYN, NY)
(Integrated Compliance Information System) - ICIS-02-2005-1032, ENFORCEMENT/COMPLIANCE ACTIVITY, FORMAL ENFORCEMENT ACTION Business SIC classification: OPERATORS OF APARTMENT BUILDINGS
CHURCH OF JESUS CHRIST OF LATTER DAY STS (FAR ROCKAWAY BLVD & BEACH 32ND in FAR ROCKAWAY, NY)
Large Quantity Generators, more that 1000 kg of hazardous waste/month (Resource Conservation and Recovery Act (tracking hazardous waste)) Organizations: THE CHURCH OF JESUS CHRIST OF LATTER-DAY (CONTACT/OPERATOR)
, THECHURCH OF JESUS CHRIST OF LATTER DAY (CONTACT/OWNER)
Alternative names: CHURCH OF JESUS CHRIST OF LATTER DAY THE
HAMMEL SUBSTATION (1 SHAMROCK DR in FAR ROCKAWAY, NY)
(Resource Conservation and Recovery Act (tracking hazardous waste))
103-00 SHOREFRONT PARKWAY BUILDING (103-00 SHOREFRONT PARKWAY in ROCKAWAY BEACH, NY)
AIR SYNTHETIC MINOR (AIRS/AFS) CRITERIA AND HAZARDOUS AIR POLLUTANT INVENTORY (Inventory of air pollution sources) Business SIC classification: OPERATORS OF APARTMENT BUILDINGS
HAMMEL HOUSES (84-16 ROCKAWAY BEACH BLVD in ROCKAWAY BEACH, NY)
AIR SYNTHETIC MINOR (AIRS/AFS) Business SIC classification: OPERATORS OF APARTMENT BUILDINGS
Housing units lacking complete plumbing facilities: 0.3% Housing units lacking complete kitchen facilities: 1.4%
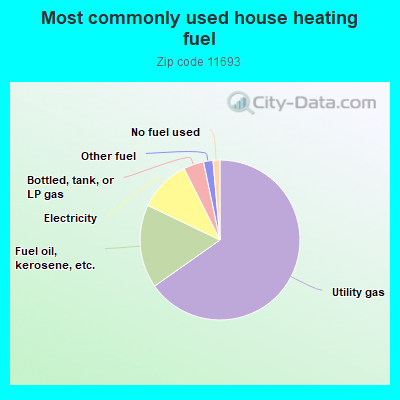
65.3%Utility gas
16.9%Fuel oil, kerosene, etc.
10.5%Electricity
4.1%Bottled, tank, or LP gas
1.9%Other fuel
1.4%No fuel used
Population in 1990: 1,630. Population change in the 1990s: +9,527 (+584.5%).
Place of birth for U.S.-born residents:
This state: 8,985
Northeast: 142
Midwest: 117
South: 246
West: 92
70% of the 11693 zip code residents lived in the same house 5 years ago. Out of people who lived in different houses, 73% lived in this county. Out of people who lived in different counties, 50% lived in New York.
96% of the 11693 zip code residents lived in the same house 1 year ago. Out of people who lived in different houses, 58% moved from this county. Out of people who lived in different houses, 34% moved from different county within same state. Out of people who lived in different houses, 0% moved from different state. Out of people who lived in different houses, 5% moved from abroad.
Private vs. public school enrollment:
Students in private schools in grades 1 to 8 (elementary and middle school):
Here:
0.0%
New York:
15.6%
Students in private schools in grades 9 to 12 (high school): 65
Here:
8.4%
New York:
15.0%
Students in private undergraduate colleges: 294
Here:
47.6%
New York:
39.2%
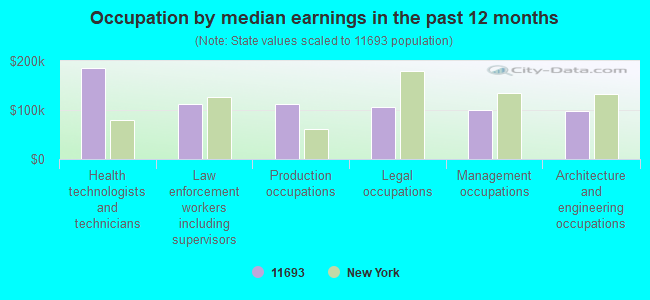
Occupation by median earnings in the past 12 months ($)
185,151Health technologists and technicians
112,566Law enforcement workers including supervisors
111,601Production occupations
106,907Legal occupations
99,806Management occupations
98,320Architecture and engineering occupations
Companies with federal contracts located in this zip code:
CALL A HEAD CORP (304 CROSS BAY BLVD in BROAD CHANNEL, NY; small business) : $79,409 in 16 contractsfrom 2003 to 2006
Contracts for Lease or Rental of Facilities -- Other Non-Building Facilities, Lease or Rental of Equipment -- Miscellaneous, Maintenance, Repair or Alteration of Real Property -- Waste Treatment and Storage Facilities, Waste Treatment and Storage, and moreby National Park Service, U.S. Secret Service, Army, Department of Veterans Affairs, and others Signed by year:2000: $0; 2001: $0; 2002: $0; 2003: $3,600; 2004: $17,525; 2005: $48,978; 2006: $9,306.
Biggest contracts:
$20,880 with National Park Service for Lease or Rental of Facilities -- Other Non-Building Facilities. Signed on 2005-10-01. Completion date: 2006-09-30.
$19,800, same as above.Signed on 2005-01-07. Completion date: 2005-09-30.
$14,850, same as above.Signed on 2004-01-05. Completion date: 2004-09-30.
$4,998 with U.S. Secret Service for Lease or Rental of Equipment -- Miscellaneous. Signed on 2005-07-25. Completion date: 2005-10-03.
Top industries in this zip code by the number of employees in 2005:
Health Care and Social Assistance: Child Day Care Services (20-49 employees: 1 establishment, 10-19 employees: 1 establishment, 1-4 employees: 1 establishment)
Educational Services: Elementary and Secondary Schools (20-49: 1, 10-19: 1)
Administrative and Support and Waste Management and Remediation Services: Septic Tank and Related Services (20-49: 1, 5-9: 1, 1-4: 1)
Health Care and Social Assistance: Homes for the Elderly (20-49: 1)
Real Estate and Rental and Leasing: Residential Property Managers (20-49: 1)
Other Services (except Public Administration): Other Similar Organizations (except Business, Professional, Labor, and Political Organizations) (20-49: 1)
Health Care and Social Assistance: Residential Mental Health and Substance Abuse Facilities (20-49: 1)
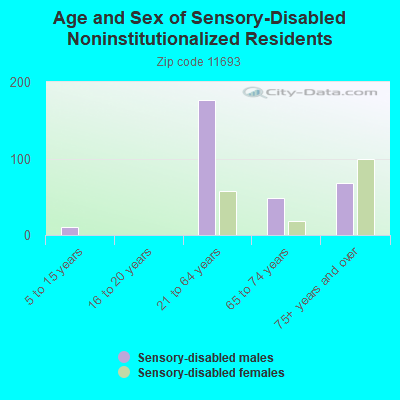
People in group quarters in 2010:
198 people in group homes intended for adults
63 people in emergency and transitional shelters (with sleeping facilities) for people experiencing homelessness
8 people in other noninstitutional facilities
People in group quarters in 2000:
197 people in other noninstitutional group quarters
20 people in other group homes
4 people in religious group quarters
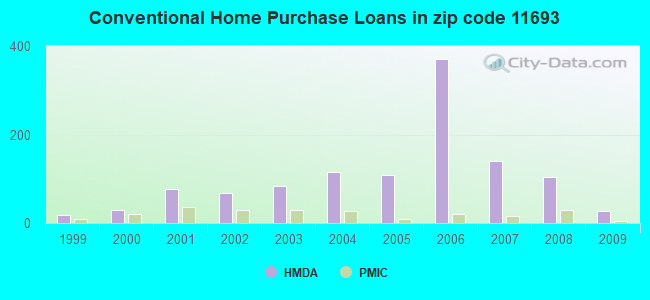
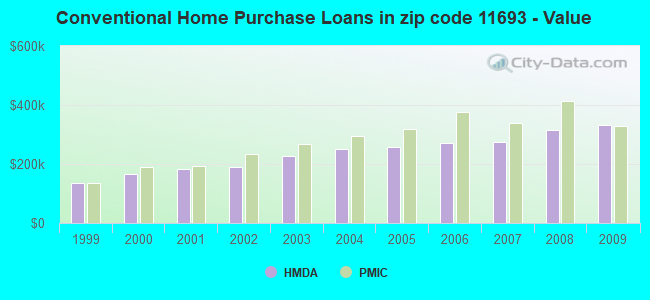
Home Mortgage Disclosure Act Aggregated Statistics For Year 2009 (Based on 14 partial tracts)
A) FHA, FSA/RHS & VA Home Purchase Loans
B) Conventional Home Purchase Loans
C) Refinancings
D) Home Improvement Loans
F) Non-occupant Loans on < 5 Family Dwellings (A B C & D)
Number
Average Value
Number
Average Value
Number
Average Value
Number
Average Value
Number
Average Value
LOANS ORIGINATED
26
$410,953
26
$331,050
64
$286,513
6
$89,898
10
$269,997
APPLICATIONS APPROVED, NOT ACCEPTED
1
$482,840
10
$345,877
14
$261,391
1
$27,030
1
$285,140
APPLICATIONS DENIED
5
$377,886
28
$402,050
93
$315,811
10
$125,631
8
$311,454
APPLICATIONS WITHDRAWN
5
$357,640
9
$415,469
54
$296,646
0
$0
5
$357,522
FILES CLOSED FOR INCOMPLETENESS
0
$0
5
$378,388
11
$394,998
1
$67,570
1
$67,570
Aggregated Statistics For Year 2008 (Based on 14 partial tracts)
A) FHA, FSA/RHS & VA Home Purchase Loans
B) Conventional Home Purchase Loans
C) Refinancings
D) Home Improvement Loans
E) Loans on Dwellings For 5+ Families
F) Non-occupant Loans on < 5 Family Dwellings (A B C & D)
Number
Average Value
Number
Average Value
Number
Average Value
Number
Average Value
Number
Average Value
Number
Average Value
LOANS ORIGINATED
13
$399,802
103
$314,688
58
$269,892
12
$136,954
1
$380,710
8
$241,124
APPLICATIONS APPROVED, NOT ACCEPTED
0
$0
14
$356,994
13
$349,948
3
$167,753
0
$0
0
$0
APPLICATIONS DENIED
7
$431,160
47
$351,378
105
$306,289
20
$91,253
1
$574,350
11
$250,698
APPLICATIONS WITHDRAWN
3
$364,890
17
$393,006
34
$327,344
2
$261,185
0
$0
2
$399,400
FILES CLOSED FOR INCOMPLETENESS
1
$206,930
10
$388,923
7
$400,920
5
$184,628
0
$0
2
$346,425
Aggregated Statistics For Year 2007 (Based on 8 partial tracts)
A) FHA, FSA/RHS & VA Home Purchase Loans
B) Conventional Home Purchase Loans
C) Refinancings
D) Home Improvement Loans
E) Loans on Dwellings For 5+ Families
F) Non-occupant Loans on < 5 Family Dwellings (A B C & D)
Number
Average Value
Number
Average Value
Number
Average Value
Number
Average Value
Number
Average Value
Number
Average Value
LOANS ORIGINATED
2
$345,780
141
$274,235
93
$286,565
26
$91,828
1
$4,050
15
$229,440
APPLICATIONS APPROVED, NOT ACCEPTED
1
$422,820
48
$290,712
30
$261,003
14
$113,949
0
$0
0
$0
APPLICATIONS DENIED
1
$417,440
72
$316,004
125
$346,862
43
$111,923
0
$0
20
$433,475
APPLICATIONS WITHDRAWN
1
$404,900
29
$252,635
49
$291,065
7
$90,103
1
$482,240
3
$372,050
FILES CLOSED FOR INCOMPLETENESS
0
$0
10
$292,212
10
$355,088
2
$27,475
0
$0
2
$234,290
Aggregated Statistics For Year 2006 (Based on 14 partial tracts)
A) FHA, FSA/RHS & VA Home Purchase Loans
B) Conventional Home Purchase Loans
C) Refinancings
D) Home Improvement Loans
E) Loans on Dwellings For 5+ Families
F) Non-occupant Loans on < 5 Family Dwellings (A B C & D)
G) Loans On Manufactured Home Dwelling (A B C & D)
Number
Average Value
Number
Average Value
Number
Average Value
Number
Average Value
Number
Average Value
Number
Average Value
Number
Average Value
LOANS ORIGINATED
2
$463,130
370
$270,222
127
$247,806
24
$122,462
0
$0
19
$330,084
0
$0
APPLICATIONS APPROVED, NOT ACCEPTED
0
$0
76
$287,666
44
$259,411
9
$140,819
0
$0
4
$295,228
0
$0
APPLICATIONS DENIED
0
$0
115
$274,287
112
$278,884
34
$111,349
0
$0
33
$248,452
1
$262,800
APPLICATIONS WITHDRAWN
0
$0
79
$274,691
61
$240,981
4
$49,572
4
$379,280
7
$320,671
0
$0
FILES CLOSED FOR INCOMPLETENESS
0
$0
29
$249,042
24
$276,678
3
$63,510
0
$0
6
$293,067
0
$0
Aggregated Statistics For Year 2005 (Based on 14 partial tracts)
A) FHA, FSA/RHS & VA Home Purchase Loans
B) Conventional Home Purchase Loans
C) Refinancings
D) Home Improvement Loans
E) Loans on Dwellings For 5+ Families
F) Non-occupant Loans on < 5 Family Dwellings (A B C & D)
G) Loans On Manufactured Home Dwelling (A B C & D)
Number
Average Value
Number
Average Value
Number
Average Value
Number
Average Value
Number
Average Value
Number
Average Value
Number
Average Value
LOANS ORIGINATED
1
$183,640
109
$258,918
187
$246,817
27
$124,178
1
$416,680
16
$249,844
1
$85,410
APPLICATIONS APPROVED, NOT ACCEPTED
0
$0
28
$232,681
40
$198,953
3
$215,263
1
$532,450
4
$274,435
1
$85,410
APPLICATIONS DENIED
0
$0
48
$283,377
107
$259,281
21
$144,476
1
$981,390
11
$338,192
0
$0
APPLICATIONS WITHDRAWN
2
$335,830
45
$220,592
83
$251,896
12
$158,922
0
$0
11
$226,387
0
$0
FILES CLOSED FOR INCOMPLETENESS
0
$0
19
$354,712
79
$245,812
3
$157,680
0
$0
3
$160,307
0
$0
Aggregated Statistics For Year 2004 (Based on 14 partial tracts)
A) FHA, FSA/RHS & VA Home Purchase Loans
B) Conventional Home Purchase Loans
C) Refinancings
D) Home Improvement Loans
E) Loans on Dwellings For 5+ Families
F) Non-occupant Loans on < 5 Family Dwellings (A B C & D)
G) Loans On Manufactured Home Dwelling (A B C & D)
Number
Average Value
Number
Average Value
Number
Average Value
Number
Average Value
Number
Average Value
Number
Average Value
Number
Average Value
LOANS ORIGINATED
5
$273,780
115
$250,247
169
$205,303
17
$138,723
3
$7,580,823
20
$219,096
0
$0
APPLICATIONS APPROVED, NOT ACCEPTED
0
$0
36
$268,021
42
$229,643
4
$140,130
0
$0
9
$196,839
1
$126,140
APPLICATIONS DENIED
1
$308,160
51
$256,728
94
$192,476
20
$61,312
1
$8,960
12
$262,043
0
$0
APPLICATIONS WITHDRAWN
5
$288,496
28
$230,177
80
$194,414
13
$76,725
0
$0
7
$231,450
0
$0
FILES CLOSED FOR INCOMPLETENESS
1
$189,010
12
$238,106
23
$210,236
4
$112,820
0
$0
5
$295,248
0
$0
Aggregated Statistics For Year 2003 (Based on 14 partial tracts)
A) FHA, FSA/RHS & VA Home Purchase Loans
B) Conventional Home Purchase Loans
C) Refinancings
D) Home Improvement Loans
E) Loans on Dwellings For 5+ Families
F) Non-occupant Loans on < 5 Family Dwellings (A B C & D)
Number
Average Value
Number
Average Value
Number
Average Value
Number
Average Value
Number
Average Value
Number
Average Value
LOANS ORIGINATED
24
$239,665
84
$227,752
265
$171,980
19
$56,381
2
$24,673,880
30
$174,774
APPLICATIONS APPROVED, NOT ACCEPTED
0
$0
14
$282,494
75
$165,633
7
$33,596
1
$128,100
4
$190,545
APPLICATIONS DENIED
0
$0
23
$217,910
108
$180,613
19
$65,587
0
$0
17
$185,346
APPLICATIONS WITHDRAWN
1
$328,500
9
$317,098
98
$166,598
5
$30,258
0
$0
2
$241,520
FILES CLOSED FOR INCOMPLETENESS
0
$0
6
$243,902
19
$158,847
1
$53,870
0
$0
4
$261,897
Aggregated Statistics For Year 2002 (Based on 14 partial tracts)
A) FHA, FSA/RHS & VA Home Purchase Loans
B) Conventional Home Purchase Loans
C) Refinancings
D) Home Improvement Loans
F) Non-occupant Loans on < 5 Family Dwellings (A B C & D)
Number
Average Value
Number
Average Value
Number
Average Value
Number
Average Value
Number
Average Value
LOANS ORIGINATED
11
$210,298
67
$191,475
124
$156,846
12
$43,240
18
$164,587
APPLICATIONS APPROVED, NOT ACCEPTED
0
$0
11
$202,171
58
$167,912
7
$24,454
6
$194,700
APPLICATIONS DENIED
3
$157,803
19
$217,207
77
$142,048
15
$15,512
5
$199,818
APPLICATIONS WITHDRAWN
7
$187,679
10
$115,456
70
$130,033
6
$29,607
4
$154,250
FILES CLOSED FOR INCOMPLETENESS
4
$208,270
7
$204,956
22
$133,692
0
$0
2
$219,855
Aggregated Statistics For Year 2001 (Based on 14 partial tracts)
A) FHA, FSA/RHS & VA Home Purchase Loans
B) Conventional Home Purchase Loans
C) Refinancings
D) Home Improvement Loans
F) Non-occupant Loans on < 5 Family Dwellings (A B C & D)
Number
Average Value
Number
Average Value
Number
Average Value
Number
Average Value
Number
Average Value
LOANS ORIGINATED
23
$187,971
76
$181,474
90
$139,880
4
$28,415
4
$188,802
APPLICATIONS APPROVED, NOT ACCEPTED
0
$0
4
$173,898
29
$96,729
8
$78,019
0
$0
APPLICATIONS DENIED
5
$181,638
16
$169,056
57
$96,094
27
$34,352
5
$126,498
APPLICATIONS WITHDRAWN
7
$225,411
20
$146,910
44
$118,879
8
$44,250
0
$0
FILES CLOSED FOR INCOMPLETENESS
1
$216,220
7
$189,330
11
$89,035
0
$0
1
$420,290
Aggregated Statistics For Year 2000 (Based on 8 partial tracts)
A) FHA, FSA/RHS & VA Home Purchase Loans
B) Conventional Home Purchase Loans
C) Refinancings
D) Home Improvement Loans
E) Loans on Dwellings For 5+ Families
F) Non-occupant Loans on < 5 Family Dwellings (A B C & D)
Number
Average Value
Number
Average Value
Number
Average Value
Number
Average Value
Number
Average Value
Number
Average Value
LOANS ORIGINATED
24
$157,155
30
$166,786
48
$93,169
15
$28,678
1
$67,010
9
$117,787
APPLICATIONS APPROVED, NOT ACCEPTED
4
$210,052
7
$162,363
14
$132,785
7
$18,686
0
$0
1
$141,540
APPLICATIONS DENIED
4
$186,892
28
$158,862
81
$89,624
26
$20,004
0
$0
7
$134,694
APPLICATIONS WITHDRAWN
4
$221,818
6
$127,603
92
$96,302
4
$46,785
0
$0
0
$0
FILES CLOSED FOR INCOMPLETENESS
1
$166,620
0
$0
8
$107,762
1
$22,400
0
$0
1
$124,520
Aggregated Statistics For Year 1999 (Based on 7 partial tracts)
A) FHA, FSA/RHS & VA Home Purchase Loans
B) Conventional Home Purchase Loans
C) Refinancings
D) Home Improvement Loans
F) Non-occupant Loans on < 5 Family Dwellings (A B C & D)
2007 - 2018 National Fire Incident Reporting System (NFIRS) incidents
Based on the data from the years 2007 - 2018 the average number of fire incidents per year is 70. The highest number of fire incidents - 95 took place in 2009, and the least - 46 in 2007. The data has a growing trend.
When looking into fire subcategories, the most incidents belonged to: Structure Fires (68.6%), and Outside Fires (19.3%).
Fire incident types reported to NFIRS in Zip Code 11693

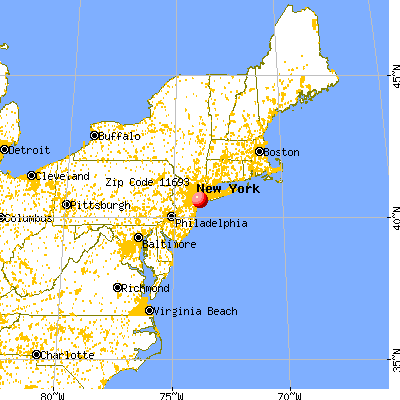


 Nearest zip codes: 11692, 11694, 11691, 11096, 11430, 11414.


 (Students: 243, Location: 9 POWER RD, Grades: PK-8)

 Based on the data from the years 2007 - 2018 the average number of fire incidents per year is 70. The highest number of fire incidents - 95 took place in 2009, and the least - 46 in 2007. The data has a growing trend.
 When looking into fire subcategories, the most incidents belonged to: Structure Fires (68.6%), and Outside Fires (19.3%).