Estimated zip code population in 2022: 69,248 Zip code population in 2010: 60,035 Zip code population in 2000: 56,184
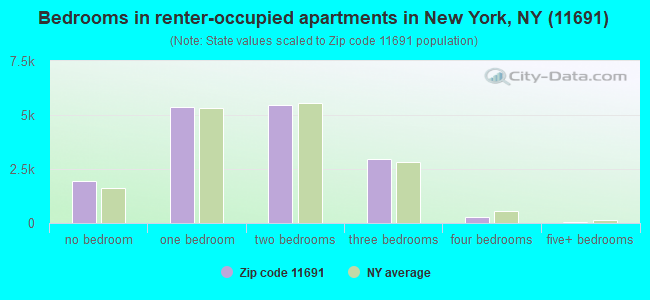
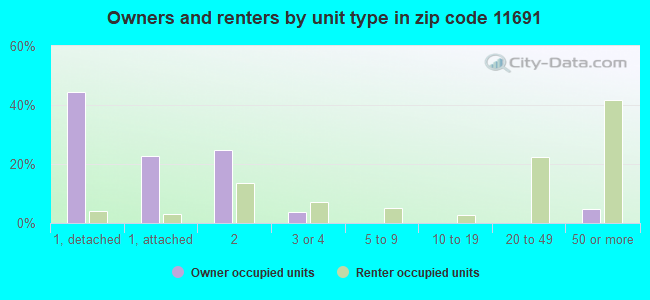
Houses and condos: 22,923 Renter-occupied apartments: 16,010
% of renters here:
72%
State:
46%
March 2022 cost of living index in zip code 11691: 153.4 (very high, U.S. average is 100)
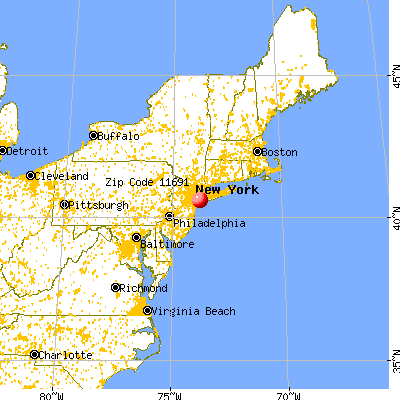
Land area: 2.8 sq. mi. Water area: 0.0 sq. mi.
Population density: 24,437 people per square mile
(very high).
OSM Map
General Map
Google Map
MSN Map
OSM Map
General Map
Google Map
MSN Map
OSM Map
General Map
Google Map
MSN Map
OSM Map
General Map
Google Map
MSN Map
Please wait while loading the map...
Real estate property taxes paid for housing units in 2022:
This zip code:
0.8% ($5,336)
New York:
1.5% ($6,180)
Median real estate property taxes paid for housing units with mortgages in 2022: $5,585 (0.8%) Median real estate property taxes paid for housing units with no mortgage in 2022: $4,642 (0.8%)
Averages for the 2020 tax year for zip code 11691, filed in 2021:
Average Adjusted Gross Income (AGI) in 2020: $45,215 (Individual Income Tax Returns)
Here:
$45,215
State:
$90,930
Salary/wage: $41,985 (reported on 81.0% of returns)
Here:
$41,985
State:
$72,104
(% of AGI for various income ranges: 978.4% for AGIs below $25k, 3486.0% for AGIs $25k-50k, 6973.0% for AGIs $50k-75k, 10696.0% for AGIs $75k-100k, 18480.5% for AGIs $100k-200k, 77405.5% for AGIs over 200k)
Taxable interest for individuals: $1,128 (reported on 15.7% of returns)
This zip code:
$1,128
New York:
$3,075
(% of AGI for various income ranges: 5.5% for AGIs below $25k, 4.8% for AGIs $25k-50k, 19.0% for AGIs $50k-75k, 38.6% for AGIs $75k-100k, 126.0% for AGIs $100k-200k, 1447.3% for AGIs over 200k)
Ordinary dividends: $3,328 (reported on 7.7% of returns)
Here:
$3,328
State:
$11,095
(% of AGI for various income ranges: 6.1% for AGIs below $25k, 6.3% for AGIs $25k-50k, 21.9% for AGIs $50k-75k, 28.3% for AGIs $75k-100k, 222.9% for AGIs $100k-200k, 2277.3% for AGIs over 200k)
Net capital gain/loss in AGI: +$11,465 (reported on 7.8% of returns)
Here:
+$11,465
State:
+$44,925
(% of AGI for various income ranges: 5.0% for AGIs below $25k, 7.5% for AGIs $25k-50k, 30.2% for AGIs $50k-75k, 66.3% for AGIs $75k-100k, 407.9% for AGIs $100k-200k, 14442.7% for AGIs over 200k)
Profit/loss from business: +$9,127 (reported on 18.9% of returns)
Here:
+$9,127
State:
+$14,940
(% of AGI for various income ranges: 241.2% for AGIs below $25k, 86.4% for AGIs $25k-50k, 119.2% for AGIs $50k-75k, 249.5% for AGIs $75k-100k, 568.2% for AGIs $100k-200k, 7625.5% for AGIs over 200k)
Taxable individual retirement arrangement distribution: $12,160 (reported on 1.8% of returns)
11691:
$12,160
New York:
$19,609
(% of AGI for various income ranges: 8.0% for AGIs below $25k, 10.3% for AGIs $25k-50k, 31.1% for AGIs $50k-75k, 45.3% for AGIs $75k-100k, 244.8% for AGIs $100k-200k, 612.7% for AGIs over 200k)
Self-employed (Keogh) retirement plans: $26,900 (reported on 0.2% of returns)
11691:
$26,900
New York:
$32,497
(% of AGI for various income ranges: 10.7% for AGIs $50k-75k, 976.4% for AGIs over 200k)
Total itemized deductions: $36,170 (reported on 7.4% of returns)
Here:
$36,170
State:
$39,326
(% of AGI for various income ranges: 21.7% for AGIs below $25k, 93.0% for AGIs $25k-50k, 311.7% for AGIs $50k-75k, 738.2% for AGIs $75k-100k, 2143.7% for AGIs $100k-200k, 20324.5% for AGIs over 200k)
Charity contributions: $16,034 (reported on 6.2% of returns)
Here:
$16,034
State:
$15,420
(% of AGI for various income ranges: 1.5% for AGIs below $25k, 16.7% for AGIs $25k-50k, 56.9% for AGIs $50k-75k, 175.1% for AGIs $75k-100k, 707.3% for AGIs $100k-200k, 12243.6% for AGIs over 200k)
Taxes paid: $8,499 (reported on 7.4% of returns)
11691:
$8,499
State:
$9,183
(% of AGI for various income ranges: 6.2% for AGIs below $25k, 24.0% for AGIs $25k-50k, 92.0% for AGIs $50k-75k, 232.3% for AGIs $75k-100k, 631.7% for AGIs $100k-200k, 2500.9% for AGIs over 200k)
Earned income credit: $2,445 (reported on 28.0% of returns)
Here:
$2,445
State:
$2,138
(% of AGI for various income ranges: 146.9% for AGIs below $25k, 95.3% for AGIs $25k-50k, 1.6% for AGIs $50k-75k)
Percentage of individuals using paid preparers for their 2020 taxes: 93.1%
Here:
93%
State:
95%
(% for various income ranges: 90.7% for AGIs below $25k, 95.2% for AGIs $25k-50k, 94.9% for AGIs $50k-75k, 94.0% for AGIs $75k-100k, 94.6% for AGIs $100k-200k, 91.9% for AGIs over 200k)
Averages for the 2012 tax year for zip code 11691, filed in 2013:
Average Adjusted Gross Income (AGI) in 2012: $36,362 (Individual Income Tax Returns)
Here:
$36,362
State:
$77,088
Salary/wage: $35,032 (reported on 82.4% of returns)
Here:
$35,032
State:
$60,593
(% of AGI for various income ranges: 71.5% for AGIs below $25k, 91.0% for AGIs $25k-50k, 90.1% for AGIs $50k-75k, 85.8% for AGIs $75k-100k, 78.4% for AGIs $100k-200k, 43.0% for AGIs over 200k)
Taxable interest for individuals: $1,217 (reported on 18.1% of returns)
This zip code:
$1,217
New York:
$3,125
(% of AGI for various income ranges: 0.3% for AGIs below $25k, 0.3% for AGIs $25k-50k, 0.4% for AGIs $50k-75k, 0.6% for AGIs $75k-100k, 1.0% for AGIs $100k-200k, 1.6% for AGIs over 200k)
Ordinary dividends: $4,767 (reported on 7.4% of returns)
Here:
$4,767
State:
$10,299
(% of AGI for various income ranges: 0.3% for AGIs below $25k, 0.3% for AGIs $25k-50k, 0.4% for AGIs $50k-75k, 0.6% for AGIs $75k-100k, 1.5% for AGIs $100k-200k, 4.2% for AGIs over 200k)
Net capital gain/loss in AGI: +$12,963 (reported on 5.3% of returns)
Here:
+$12,963
State:
+$42,474
(% of AGI for various income ranges: 0.3% for AGIs $75k-100k, 0.6% for AGIs $100k-200k, 15.7% for AGIs over 200k)
Profit/loss from business: +$10,920 (reported on 19.8% of returns)
Here:
+$10,920
State:
+$16,168
(% of AGI for various income ranges: 19.5% for AGIs below $25k, 2.3% for AGIs $25k-50k, 1.6% for AGIs $50k-75k, 2.6% for AGIs $75k-100k, 3.9% for AGIs $100k-200k, 5.8% for AGIs over 200k)
Taxable individual retirement arrangement distribution: $13,720 (reported on 2.7% of returns)
11691:
$13,720
New York:
$17,621
(% of AGI for various income ranges: 0.6% for AGIs below $25k, 0.5% for AGIs $25k-50k, 0.9% for AGIs $50k-75k, 1.2% for AGIs $75k-100k, 1.9% for AGIs $100k-200k, 1.7% for AGIs over 200k)
Self-employment retirement plans: $19,617 (reported on 0.3% of returns)
11691:
$19,617
New York:
$27,330
Total itemized deductions: $25,424 (32% of AGI, reported on 24.8% of returns)
Here:
$25,424
State:
$34,985
Here:
32.1% of AGI
State:
21.3% of AGI
(% of AGI for various income ranges: 5.6% for AGIs below $25k, 13.4% for AGIs $25k-50k, 20.2% for AGIs $50k-75k, 23.2% for AGIs $75k-100k, 23.7% for AGIs $100k-200k, 25.3% for AGIs over 200k)
Charity contributions: $5,838 (reported on 21.2% of returns)
Here:
$5,838
State:
$5,572
(% of AGI for various income ranges: 0.5% for AGIs below $25k, 1.8% for AGIs $25k-50k, 2.9% for AGIs $50k-75k, 3.3% for AGIs $75k-100k, 4.5% for AGIs $100k-200k, 11.0% for AGIs over 200k)
Taxes paid: $8,166 (reported on 24.7% of returns)
11691:
$8,166
State:
$18,656
(% of AGI for various income ranges: 1.0% for AGIs below $25k, 3.0% for AGIs $25k-50k, 6.3% for AGIs $50k-75k, 7.8% for AGIs $75k-100k, 9.1% for AGIs $100k-200k, 10.2% for AGIs over 200k)
Earned income credit: $2,616 (reported on 37.9% of returns)
Here:
$2,616
State:
$2,230
(% of AGI for various income ranges: 12.9% for AGIs below $25k, 1.6% for AGIs $25k-50k)
Percentage of individuals using paid preparers for their 2012 taxes: 72.5%
Here:
73%
State:
66%
(% for various income ranges: 72.3% for AGIs below $25k, 71.9% for AGIs $25k-50k, 73.5% for AGIs $50k-75k, 74.5% for AGIs $75k-100k, 74.0% for AGIs $100k-200k, 76.2% for AGIs over 200k)
Averages for the 2004 tax year for zip code 11691, filed in 2005:
Average Adjusted Gross Income (AGI) in 2004: $32,124 (Individual Income Tax Returns)
Here:
$32,124
State:
$59,519
Salary/wage: $31,463 (reported on 87.6% of returns)
Here:
$31,463
State:
$50,673
(% of AGI for various income ranges: 82.0% for AGIs below $10k, 86.5% for AGIs $10k-25k, 95.0% for AGIs $25k-50k, 92.0% for AGIs $50k-75k, 84.6% for AGIs $75k-100k, 63.2% for AGIs over 100k)
Taxable interest for individuals: $1,099 (reported on 29.2% of returns)
This zip code:
$1,099
New York:
$2,377
(% of AGI for various income ranges: 2.6% for AGIs below $10k, 0.7% for AGIs $10k-25k, 0.5% for AGIs $25k-50k, 0.7% for AGIs $50k-75k, 1.1% for AGIs $75k-100k, 2.2% for AGIs over 100k)
Taxable dividends: $2,164 (reported on 10.0% of returns)
Here:
$2,164
State:
$5,394
(% of AGI for various income ranges: 1.5% for AGIs below $10k, 0.4% for AGIs $10k-25k, 0.3% for AGIs $25k-50k, 0.3% for AGIs $50k-75k, 0.9% for AGIs $75k-100k, 1.7% for AGIs over 100k)
Net capital gain/loss: +$6,854 (reported on 7.2% of returns)
Here:
+$6,854
State:
+$23,581
(% of AGI for various income ranges: -0.4% for AGIs below $10k, -0.2% for AGIs $10k-25k, 0.1% for AGIs $25k-50k, -0.1% for AGIs $50k-75k, 0.5% for AGIs $75k-100k, 8.3% for AGIs over 100k)
Profit/loss from business: +$9,669 (reported on 14.4% of returns)
Here:
+$9,669
State:
+$13,809
(% of AGI for various income ranges: 25.0% for AGIs below $10k, 8.2% for AGIs $10k-25k, 0.9% for AGIs $25k-50k, 1.5% for AGIs $50k-75k, 2.5% for AGIs $75k-100k, 7.4% for AGIs over 100k)
IRA payment deduction: $2,087 (reported on 2.2% of returns)
11691:
$2,087
New York:
$3,115
(% of AGI for various income ranges: 0.1% for AGIs below $10k, 0.1% for AGIs $10k-25k, 0.2% for AGIs $25k-50k, 0.1% for AGIs $50k-75k, 0.1% for AGIs $75k-100k, 0.1% for AGIs over 100k)
Self-employed pension: $18,812 (reported on 0.4% of returns)
Here:
$18,812
New York:
$19,016
(% of AGI for various income ranges: 0.1% for AGIs $10k-25k, 0.2% for AGIs $75k-100k, 1.0% for AGIs over 100k)
Total itemized deductions: $19,552 (33% of AGI, reported on 30.9% of returns)
Here:
$19,552
State:
$25,864
Here:
32.5% of AGI
State:
21.9% of AGI
(% of AGI for various income ranges: 4.8% for AGIs below $10k, 8.2% for AGIs $10k-25k, 18.0% for AGIs $25k-50k, 23.6% for AGIs $50k-75k, 24.3% for AGIs $75k-100k, 24.3% for AGIs over 100k)
Charity contributions deductions: $4,800 (8% of AGI, reported on 28.7% of returns)
Here:
$4,800
State:
$4,439
Here:
7.8% of AGI
State:
3.6% of AGI
(% of AGI for various income ranges: 0.3% for AGIs below $10k, 1.3% for AGIs $10k-25k, 3.5% for AGIs $25k-50k, 4.5% for AGIs $50k-75k, 5.3% for AGIs $75k-100k, 8.4% for AGIs over 100k)
Total tax: $3,860 (reported on 63.1% of returns)
11691:
$3,860
State:
$11,730
(% of AGI for various income ranges: 4.5% for AGIs below $10k, 3.1% for AGIs $10k-25k, 4.9% for AGIs $25k-50k, 7.9% for AGIs $50k-75k, 9.5% for AGIs $75k-100k, 15.7% for AGIs over 100k)
Earned income credit: $1,954 (reported on 34.8% of returns)
Here:
$1,954
State:
$1,757
Percentage of individuals using paid preparers for their 2004 taxes: 73.7%
Here:
74%
State:
67%
(% for various income ranges: 71.8% for AGIs below $10k, 76.4% for AGIs $10k-25k, 72.7% for AGIs $25k-50k, 72.4% for AGIs $50k-75k, 72.7% for AGIs $75k-100k, 73.7% for AGIs over 100k)
Likely homosexual households (counted as self-reported same-sex unmarried-partner households)
Lesbian couples: 0.2% of all households
Gay men: 0.0% of all households
Household received Food Stamps/SNAP in the past 12 months: 7,709 Household did not receive Food Stamps/SNAP in the past 12 months: 14,942
Women who had a birth in the past 12 months: 767 (640 now married, 120 unmarried) Women who did not have a birth in the past 12 months: 15,056 (4,600 now married, 10,498 unmarried)
Housing units in zip code 11691 with a mortgage: 4,602 (337 second mortgage, 219 both second mortgage and home equity loan) Houses without a mortgage: 162
Median monthly owner costs for units with a mortgage: $3,076 Median monthly owner costs for units without a mortgage: $945
Residents with income below the poverty level in 2022:
This zip code:
19.5%
Whole state:
14.3%
Residents with income below 50% of the poverty level in 2022:
This zip code:
11.0%
Whole state:
6.8%
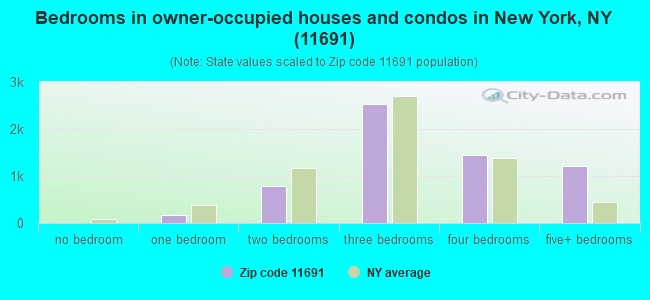
Median number of rooms in houses and condos:
Here:
6.3
State:
6.3
Median number of rooms in apartments:
Here:
3.7
State:
3.8
Notable locations in this zip code not listed on our city pages
Notable locations in zip code 11691: Edgemere Station (A), Wave Crest Station (B), Far Rockaway Station (C), Far Rockaway Branch Queens Borough Public Library (D), Fire Department New York Engines 264 and 328 Ladder 134 (E), New York Engine Company 328 (F), New York Ladder Company 134 (G), Far Rockaway Power Station (H). Display/hide their locations on the map
Churches in zip code 11691 include: Solid Rock Seventh Day Adventist Church (A), Saint Gertrude's Church (B), Refuge Church of Christ (C), First Church of God (D), First Baptist Church (E), Bethel Temple Church of God (F), Bayswater Jewish Center (G), Sage Memorial Church (H), Congregation Knesseth Israel (I). Display/hide their locations on the map
Parks in zip code 11691 include: Michaelis-Bayswater Park (1), Rockaway Community Park (2), O'Donohue Park (3), Beach 9th Street Playground (4), Lanett Playground (5), Seagirt Avenue Wetlands (6), Conch Playground (7), Grassmere Playground (8), Edgemere Urban Renewal Park (9). Display/hide their locations on the map
11,012 married couples with children.
6,080 single-parent households (1,293 men, 4,787 women).
65.8% of residents of 11691 zip code speak English at home.
20.3% of residents speak Spanish at home (46% very well, 17% well, 30% not well, 7% not at all).
6.9% of residents speak other Indo-European language at home (53% very well, 20% well, 23% not well, 5% not at all).
2.1% of residents speak Asian or Pacific Island language at home (54% very well, 24% well, 13% not well, 10% not at all).
4.8% of residents speak other language at home (85% very well, 11% well, 4% not well).
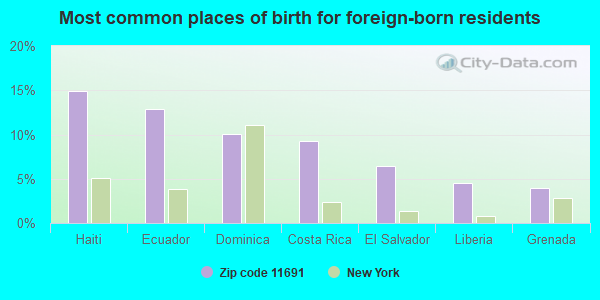
Foreign born population: 23,547 (34.0%) (64.3% of them are naturalized citizens)
This zip code:
34.0%
Whole state:
22.7%
15%Haiti
13%Ecuador
10%Dominica
9%Costa Rica
6%El Salvador
5%Liberia
4%Grenada
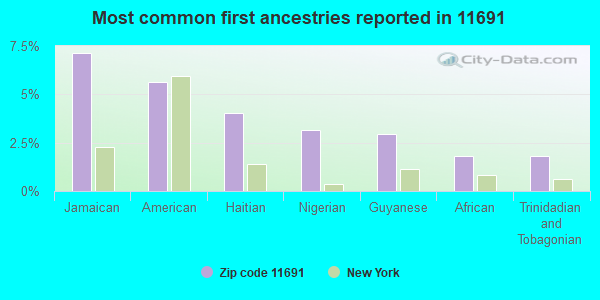
7%Jamaican
6%American
4%Haitian
3%Nigerian
3%Guyanese
2%African
2%Trinidadian and Tobagonian
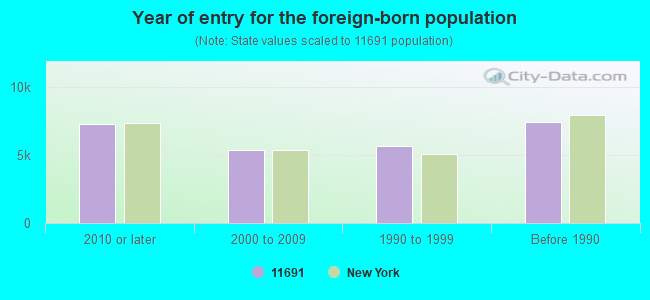
Year of entry for the foreign-born population
7,2932010 or later
5,3932000 to 2009
5,6471990 to 1999
7,409Before 1990
Public high schools in in zip code 11691 not listed on the city page:
Major facilities with environmental interests located in this zip code:
HOSPITAL MEDICAL CENTER QUEENS AIDS CENTER (1600 CENTRAL AVENUE in FAR ROCKAWAY, NY)
(Integrated Compliance Information System) - ICIS-02-2005-0807, ENFORCEMENT/COMPLIANCE ACTIVITY FORMAL ENFORCEMENT ACTION (Integrated Compliance Information System) - ICIS-02-2005-0807, ENFORCEMENT/COMPLIANCE ACTIVITY
20-02 SEAGIRT BLVD BUILDING (20-02 SEAGIRT BLVD in FAR ROCKAWAY, NY)
AIR MINOR (AIRS/AFS) STATE MASTER (New York facility tracking) - AIR FACILITY REGISTRATION, AIR PROGRAM Business SIC classification: OPERATORS OF APARTMENT BUILDINGS Organizations: GOLDFARB PROPERTIES INC, ROCKAWAY ONE COMPANY LLC, 20-02 SEAGIRT BLVD OWNERS CORP
20-49 SEAGIRT BLVD BUILDING (20-49 SEAGIRT BOULEVARD in FAR ROCKAWAY, NY)
AIR MINOR (AIRS/AFS) STATE MASTER (New York facility tracking) - AIR FACILITY REGISTRATION, AIR PROGRAM Business SIC classification: OPERATORS OF APARTMENT BUILDINGS Organizations: GOLDFARB PROPERTIES INC, ROCKAWAY ONE COMPANY LLC, WAVECREST GARDENS BY THE SEA
GEORGE CLEANERS (21-40 MOTT AVENUE in FAR ROCKAWAY, NY)
AIR MINOR (AIRS/AFS) STATE MASTER (New York facility tracking) - AIR PROGRAM, HAZARDOUS WASTE PROGRAM Small Quantity Generators, between 100 kg and 1000 kg of hazardous waste/month (Resource Conservation and Recovery Act (tracking hazardous waste)) - notification Business SIC classification: DRYCLEANING PLANTS, EXCEPT RUG CLEANING Business NAICS classification: DRYCLEANING AND LAUNDRY SERVICES (EXCEPT COIN-OPERATED). Organizations: GEORGE MARKIDES (CONTACT/OWNER)
, MORNING SUN CLEANING CORP (LEGALLY RESPONSIBLE PARTY)
Alternative names: GEORGE & CHRIS CLEANERS INC
20-23 SEAGIRT BLVD BUILDING (20-23 SEAGIRT BLVD in FAR ROCKAWAY, NY)
AIR MINOR (AIRS/AFS) STATE MASTER (New York facility tracking) - AIR FACILITY REGISTRATION, AIR PROGRAM Business SIC classification: OPERATORS OF APARTMENT BUILDINGS; OPERATORS OF DWELLINGS OTHER THAN APARTMENT BUILDINGS Organizations: ROCKAWAY ONE COMPANY LLC, WAVECREST GARDENS BY THE SEA
20-26 SEAGIRT BLVD BUILDING (20-26 SEAGIRT BLVD in FAR ROCKAWAY, NY)
AIR MINOR (AIRS/AFS) STATE MASTER (New York facility tracking) - AIR FACILITY REGISTRATION, AIR PROGRAM Business SIC classification: OPERATORS OF APARTMENT BUILDINGS Organizations: GOLDFARB PROPERTIES INC, ROCKAWAY ONE COMPANY LLC
20-46 SEAGIRT BLVD BUILDING (20-46 SEAGIRT BLVD in FAR ROCKAWAY, NY)
AIR MINOR (AIRS/AFS) STATE MASTER (New York facility tracking) - AIR FACILITY REGISTRATION, AIR PROGRAM Business SIC classification: OPERATORS OF APARTMENT BUILDINGS Organizations: GOLDFARB PROPERTIES INC, ROCKAWAY ONE COMPANY LLC
BELL BOY DRIVE-IN CLEANERS (536 BEACH 20TH STREET in FAR ROCKAWAY, NY)
AIR MINOR (AIRS/AFS) STATE MASTER (New York facility tracking) - AIR PROGRAM, HAZARDOUS WASTE PROGRAM Small Quantity Generators, between 100 kg and 1000 kg of hazardous waste/month (Resource Conservation and Recovery Act (tracking hazardous waste)) Business SIC classification: DRYCLEANING PLANTS, EXCEPT RUG CLEANING Business NAICS classification: DRYCLEANING AND LAUNDRY SERVICES (EXCEPT COIN-OPERATED). Organizations: KYO & KYO INC (LEGALLY RESPONSIBLE PARTY)
Alternative names: BELL BOY CLEANERS
707 BEACH 9TH STREET BUILDING (707 BEACH 9TH STREET in FAR ROCKAWAY, NY)
AIR MINOR (AIRS/AFS) STATE MASTER (New York facility tracking) - AIR PROGRAM Business SIC classification: OPERATORS OF APARTMENT BUILDINGS Business NAICS classification: LESSORS OF RESIDENTIAL BUILDINGS AND DWELLINGS. Organizations: RIVIERA LEASING CORP (LEGALLY RESPONSIBLE PARTY)
HEE WON PARK SS 10676 (1346 BEACH CHANNEL DRIVE in FAR ROCKAWAY, NY)
AIR MINOR (AIRS/AFS) STATE MASTER (New York facility tracking) - AIR PROGRAM Business SIC classification: GASOLINE SERVICE STATIONS Organizations: SHELDON RODBELL (LEGALLY RESPONSIBLE PARTY)
Alternative names: AMOCO, HEE WON PARK SERVICE STATION 10676
ARROWLINER WRECKING AND COLLISION (1018 BEACH 19 STREET in FAR ROCKAWAY, NY)
AIR MINOR (AIRS/AFS) STATE MASTER (New York facility tracking) - AIR PROGRAM Business SIC classification: TOP, BODY, AND UPHOLSTERY REPAIR SHOPS AND PAINT SHOPS Business NAICS classification: AUTOMOTIVE BODY, PAINT, AND INTERIOR REPAIR AND MAINTENANCE.
10-45 NAMEOKE STREET SCHOOL - P-53 (10-45 NAMEOKE STREET in FAR ROCKAWAY, NY)
AIR SYNTHETIC MINOR (AIRS/AFS) STATE MASTER (New York facility tracking) - AIR PROGRAM Business SIC and NAICS classification: ELEMENTARY AND SECONDARY SCHOOLS Organizations: NYC DEPT OF EDUCATION (LEGALLY RESPONSIBLE PARTY)
Alternative names: INTERMEDIATE SCHOOL 53
ALMOST PARADISE DIVE CENTER (120 BEACH 19TH ST in FAR ROCKAWAY, NY)
AIR SYNTHETIC MINOR (AIRS/AFS) STATE MASTER (New York facility tracking) - SECTION 404 PERMITTING, 401 CERTIFICATION, Business SIC classification: OPERATORS OF APARTMENT BUILDINGS Business NAICS classification: LESSORS OF RESIDENTIAL BUILDINGS AND DWELLINGS. Alternative names: 120 BEACH 19TH STREET BUILDING
Housing units lacking complete plumbing facilities: 0.9% Housing units lacking complete kitchen facilities: 0.8%
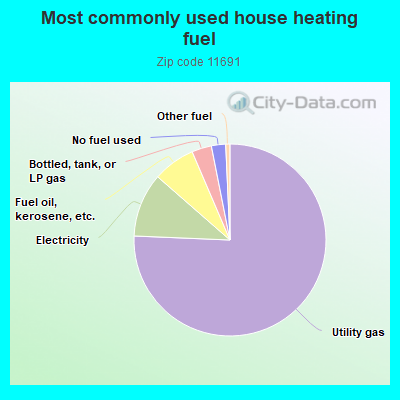
75.3%Utility gas
10.7%Electricity
7.1%Fuel oil, kerosene, etc.
3.3%Bottled, tank, or LP gas
2.4%No fuel used
0.7%Other fuel
Population in 1990: 52,162. Population change in the 1990s: +4,022 (+7.7%).
Place of birth for U.S.-born residents:
This state: 38,743
Northeast: 1,387
Midwest: 447
South: 2,556
West: 310
68% of the 11691 zip code residents lived in the same house 5 years ago. Out of people who lived in different houses, 67% lived in this county. Out of people who lived in different counties, 50% lived in New York.
92% of the 11691 zip code residents lived in the same house 1 year ago. Out of people who lived in different houses, 65% moved from this county. Out of people who lived in different houses, 30% moved from different county within same state. Out of people who lived in different houses, 1% moved from different state. Out of people who lived in different houses, 2% moved from abroad.
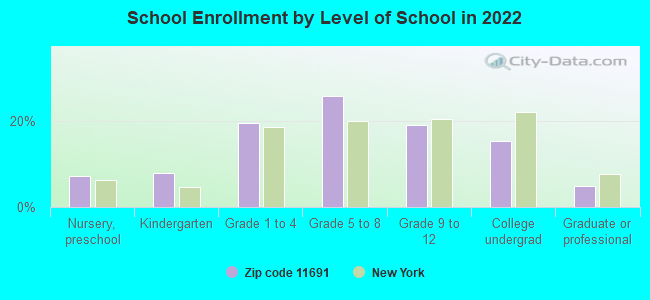
Private vs. public school enrollment:
Students in private schools in grades 1 to 8 (elementary and middle school): 2,960
Here:
31.3%
New York:
15.6%
Students in private schools in grades 9 to 12 (high school): 1,444
Here:
36.2%
New York:
15.0%
Students in private undergraduate colleges: 1,295
Here:
41.0%
New York:
39.2%
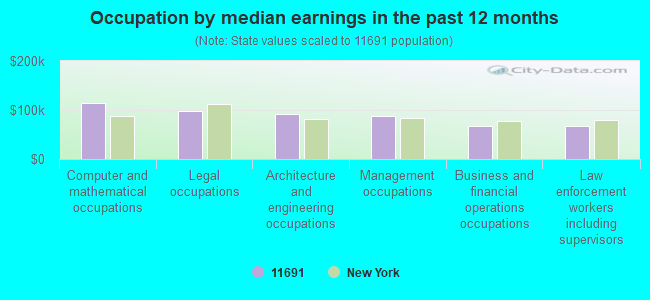
Occupation by median earnings in the past 12 months ($)
114,218Computer and mathematical occupations
97,286Legal occupations
92,393Architecture and engineering occupations
88,220Management occupations
67,638Business and financial operations occupations
66,491Law enforcement workers including supervisors
Top industries in this zip code by the number of employees in 2005:
Health Care and Social Assistance: General Medical and Surgical Hospitals (over 1000 employees: 1 establishment, 500-999 employees: 1 establishment)
Health Care and Social Assistance: Nursing Care Facilities (250-499: 2, 100-249: 3, 50-99: 3, 20-49: 3, 1-4: 4)
Health Care and Social Assistance: Home Health Care Services (500-999: 1)
Administrative and Support and Waste Management and Remediation Services: Professional Employer Organizations (500-999: 1)
Other Services (except Public Administration): Religious Organizations (250-499: 1, 10-19: 2, 5-9: 5, 1-4: 11)
Health Care and Social Assistance: Services for the Elderly and Persons with Disabilities (100-249: 2, 20-49: 1, 10-19: 1, 5-9: 4, 1-4: 2)
2007 - 2018 National Fire Incident Reporting System (NFIRS) incidents
Based on the data from the years 2007 - 2018 the average number of fire incidents per year is 316. The highest number of fire incidents - 388 took place in 2008, and the least - 272 in 2007. The data has a growing trend.
When looking into fire subcategories, the most incidents belonged to: Structure Fires (72.9%), and Outside Fires (17.6%).
Fire incident types reported to NFIRS in Zip Code 11691


 Nearest zip codes: 11096, 11692, 11509, 11516, 11559, 11693.


 (Students: 421, Location: 8 21 BAY 25TH ST, Grades: 9-12)

 Based on the data from the years 2007 - 2018 the average number of fire incidents per year is 316. The highest number of fire incidents - 388 took place in 2008, and the least - 272 in 2007. The data has a growing trend.
 When looking into fire subcategories, the most incidents belonged to: Structure Fires (72.9%), and Outside Fires (17.6%).