Estimated zip code population in 2022: 67,100 Zip code population in 2010: 59,129 Zip code population in 2000: 59,142
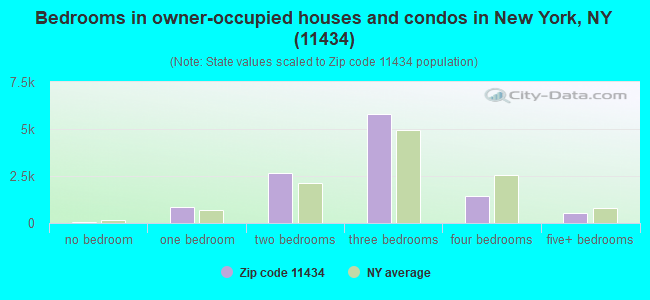
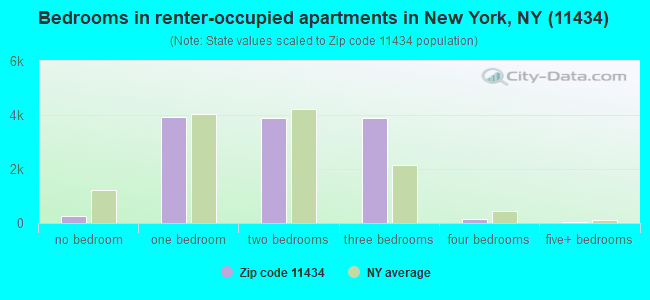
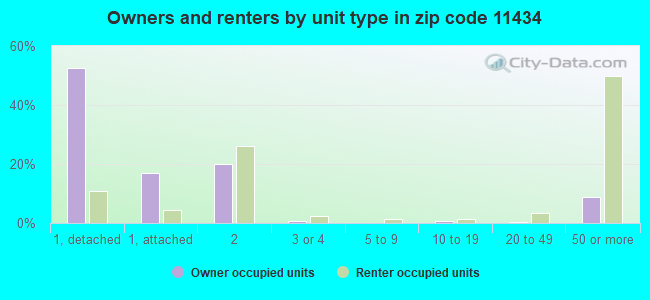
Houses and condos: 24,248 Renter-occupied apartments: 12,232
% of renters here:
52%
State:
46%
March 2022 cost of living index in zip code 11434: 148.3 (very high, U.S. average is 100)
Land area: 3.2 sq. mi. Water area: 0.1 sq. mi.
Population density: 20,720 people per square mile
(very high).
OSM Map
General Map
Google Map
MSN Map
OSM Map
General Map
Google Map
MSN Map
OSM Map
General Map
Google Map
MSN Map
OSM Map
General Map
Google Map
MSN Map
Please wait while loading the map...
Real estate property taxes paid for housing units in 2022:
This zip code:
0.7% ($4,248)
New York:
1.5% ($6,180)
Median real estate property taxes paid for housing units with mortgages in 2022: $4,348 (0.7%) Median real estate property taxes paid for housing units with no mortgage in 2022: $4,020 (0.8%)
Averages for the 2020 tax year for zip code 11434, filed in 2021:
Average Adjusted Gross Income (AGI) in 2020: $47,496 (Individual Income Tax Returns)
Here:
$47,496
State:
$90,930
Salary/wage: $45,612 (reported on 82.8% of returns)
Here:
$45,612
State:
$72,104
(% of AGI for various income ranges: 970.5% for AGIs below $25k, 3580.5% for AGIs $25k-50k, 6574.9% for AGIs $50k-75k, 10085.9% for AGIs $75k-100k, 16680.7% for AGIs $100k-200k, 44447.0% for AGIs over 200k)
Taxable interest for individuals: $274 (reported on 19.1% of returns)
This zip code:
$274
New York:
$3,075
(% of AGI for various income ranges: 3.5% for AGIs below $25k, 3.0% for AGIs $25k-50k, 8.4% for AGIs $50k-75k, 13.6% for AGIs $75k-100k, 23.9% for AGIs $100k-200k, 75.0% for AGIs over 200k)
Ordinary dividends: $958 (reported on 6.4% of returns)
Here:
$958
State:
$11,095
(% of AGI for various income ranges: 3.2% for AGIs below $25k, 2.8% for AGIs $25k-50k, 9.2% for AGIs $50k-75k, 14.5% for AGIs $75k-100k, 25.2% for AGIs $100k-200k, 340.0% for AGIs over 200k)
Net capital gain/loss in AGI: +$3,454 (reported on 6.3% of returns)
Here:
+$3,454
State:
+$44,925
(% of AGI for various income ranges: 0.8% for AGIs $25k-50k, 9.4% for AGIs $50k-75k, 31.0% for AGIs $75k-100k, 77.1% for AGIs $100k-200k, 4805.0% for AGIs over 200k)
Profit/loss from business: +$3,724 (reported on 16.2% of returns)
Here:
+$3,724
State:
+$14,940
(% of AGI for various income ranges: 154.8% for AGIs below $25k, 33.4% for AGIs $25k-50k, 8.9% for AGIs $50k-75k, 92.7% for AGIs $75k-100k, 111.8% for AGIs $100k-200k, 415.0% for AGIs over 200k)
Taxable individual retirement arrangement distribution: $10,581 (reported on 2.8% of returns)
11434:
$10,581
New York:
$19,609
(% of AGI for various income ranges: 16.0% for AGIs below $25k, 22.5% for AGIs $25k-50k, 44.3% for AGIs $50k-75k, 84.9% for AGIs $75k-100k, 157.9% for AGIs $100k-200k)
Total itemized deductions: $26,170 (reported on 11.8% of returns)
Here:
$26,170
State:
$39,326
(% of AGI for various income ranges: 43.8% for AGIs below $25k, 163.6% for AGIs $25k-50k, 491.2% for AGIs $50k-75k, 1009.9% for AGIs $75k-100k, 1910.4% for AGIs $100k-200k, 5532.0% for AGIs over 200k)
Charity contributions: $6,416 (reported on 9.5% of returns)
Here:
$6,416
State:
$15,420
(% of AGI for various income ranges: 3.3% for AGIs below $25k, 26.1% for AGIs $25k-50k, 89.0% for AGIs $50k-75k, 190.1% for AGIs $75k-100k, 429.8% for AGIs $100k-200k, 1632.0% for AGIs over 200k)
Taxes paid: $8,400 (reported on 11.7% of returns)
11434:
$8,400
State:
$9,183
(% of AGI for various income ranges: 9.9% for AGIs below $25k, 45.5% for AGIs $25k-50k, 158.6% for AGIs $50k-75k, 352.4% for AGIs $75k-100k, 637.2% for AGIs $100k-200k, 1424.0% for AGIs over 200k)
Earned income credit: $2,043 (reported on 18.9% of returns)
Here:
$2,043
State:
$2,138
(% of AGI for various income ranges: 101.0% for AGIs below $25k, 56.9% for AGIs $25k-50k, 0.3% for AGIs $50k-75k)
Percentage of individuals using paid preparers for their 2020 taxes: 94.2%
Here:
94%
State:
95%
(% for various income ranges: 92.5% for AGIs below $25k, 95.3% for AGIs $25k-50k, 95.1% for AGIs $50k-75k, 94.1% for AGIs $75k-100k, 94.6% for AGIs $100k-200k, 100.0% for AGIs over 200k)
Averages for the 2012 tax year for zip code 11434, filed in 2013:
Average Adjusted Gross Income (AGI) in 2012: $39,349 (Individual Income Tax Returns)
Here:
$39,349
State:
$77,088
Salary/wage: $38,678 (reported on 84.3% of returns)
Here:
$38,678
State:
$60,593
(% of AGI for various income ranges: 69.5% for AGIs below $25k, 86.1% for AGIs $25k-50k, 85.5% for AGIs $50k-75k, 86.3% for AGIs $75k-100k, 82.8% for AGIs $100k-200k, 70.3% for AGIs over 200k)
Taxable interest for individuals: $297 (reported on 21.3% of returns)
This zip code:
$297
New York:
$3,125
(% of AGI for various income ranges: 0.2% for AGIs below $25k, 0.1% for AGIs $25k-50k, 0.2% for AGIs $50k-75k, 0.1% for AGIs $75k-100k, 0.1% for AGIs $100k-200k, 0.3% for AGIs over 200k)
Ordinary dividends: $831 (reported on 6.4% of returns)
Here:
$831
State:
$10,299
(% of AGI for various income ranges: 0.2% for AGIs below $25k, 0.1% for AGIs $25k-50k, 0.1% for AGIs $50k-75k, 0.2% for AGIs $75k-100k, 0.2% for AGIs $100k-200k, 0.1% for AGIs over 200k)
Net capital gain/loss in AGI: +$161 (reported on 3.9% of returns)
Here:
+$161
State:
+$42,474
(% of AGI for various income ranges: 0.3% for AGIs $100k-200k)
Profit/loss from business: +$5,831 (reported on 13.8% of returns)
Here:
+$5,831
State:
+$16,168
(% of AGI for various income ranges: 12.8% for AGIs below $25k, 0.7% for AGIs $25k-50k, 0.1% for AGIs $50k-75k, 0.4% for AGIs $75k-100k, 0.1% for AGIs $100k-200k)
Taxable individual retirement arrangement distribution: $9,832 (reported on 3.6% of returns)
11434:
$9,832
New York:
$17,621
(% of AGI for various income ranges: 0.9% for AGIs below $25k, 0.7% for AGIs $25k-50k, 0.9% for AGIs $50k-75k, 0.8% for AGIs $75k-100k, 1.5% for AGIs $100k-200k)
Total itemized deductions: $19,966 (31% of AGI, reported on 35.9% of returns)
Here:
$19,966
State:
$34,985
Here:
30.8% of AGI
State:
21.3% of AGI
(% of AGI for various income ranges: 8.2% for AGIs below $25k, 15.6% for AGIs $25k-50k, 20.8% for AGIs $50k-75k, 22.6% for AGIs $75k-100k, 22.5% for AGIs $100k-200k, 19.6% for AGIs over 200k)
Charity contributions: $3,557 (reported on 31.5% of returns)
Here:
$3,557
State:
$5,572
(% of AGI for various income ranges: 1.0% for AGIs below $25k, 2.5% for AGIs $25k-50k, 3.5% for AGIs $50k-75k, 3.5% for AGIs $75k-100k, 3.3% for AGIs $100k-200k, 2.5% for AGIs over 200k)
Taxes paid: $6,757 (reported on 35.7% of returns)
11434:
$6,757
State:
$18,656
(% of AGI for various income ranges: 1.5% for AGIs below $25k, 4.2% for AGIs $25k-50k, 6.9% for AGIs $50k-75k, 8.6% for AGIs $75k-100k, 9.3% for AGIs $100k-200k, 8.8% for AGIs over 200k)
Earned income credit: $2,232 (reported on 26.5% of returns)
Here:
$2,232
State:
$2,230
(% of AGI for various income ranges: 9.0% for AGIs below $25k, 1.0% for AGIs $25k-50k)
Percentage of individuals using paid preparers for their 2012 taxes: 70.5%
Here:
71%
State:
66%
(% for various income ranges: 69.2% for AGIs below $25k, 70.3% for AGIs $25k-50k, 70.8% for AGIs $50k-75k, 74.6% for AGIs $75k-100k, 75.2% for AGIs $100k-200k, 75.0% for AGIs over 200k)
Averages for the 2004 tax year for zip code 11434, filed in 2005:
Average Adjusted Gross Income (AGI) in 2004: $34,791 (Individual Income Tax Returns)
Here:
$34,791
State:
$59,519
Salary/wage: $34,691 (reported on 86.9% of returns)
Here:
$34,691
State:
$50,673
(% of AGI for various income ranges: 83.4% for AGIs below $10k, 77.5% for AGIs $10k-25k, 89.7% for AGIs $25k-50k, 89.8% for AGIs $50k-75k, 86.8% for AGIs $75k-100k, 79.4% for AGIs over 100k)
Taxable interest for individuals: $470 (reported on 33.5% of returns)
This zip code:
$470
New York:
$2,377
(% of AGI for various income ranges: 1.6% for AGIs below $10k, 0.6% for AGIs $10k-25k, 0.4% for AGIs $25k-50k, 0.4% for AGIs $50k-75k, 0.4% for AGIs $75k-100k, 0.5% for AGIs over 100k)
Taxable dividends: $632 (reported on 9.5% of returns)
Here:
$632
State:
$5,394
(% of AGI for various income ranges: 0.5% for AGIs below $10k, 0.2% for AGIs $10k-25k, 0.1% for AGIs $25k-50k, 0.1% for AGIs $50k-75k, 0.2% for AGIs $75k-100k, 0.3% for AGIs over 100k)
Net capital gain/loss: +$3,387 (reported on 5.2% of returns)
Here:
+$3,387
State:
+$23,581
(% of AGI for various income ranges: -0.1% for AGIs below $10k, 0.0% for AGIs $10k-25k, 0.0% for AGIs $25k-50k, 0.3% for AGIs $50k-75k, 0.2% for AGIs $75k-100k, 3.9% for AGIs over 100k)
Profit/loss from business: +$4,310 (reported on 10.1% of returns)
Here:
+$4,310
State:
+$13,809
(% of AGI for various income ranges: 19.1% for AGIs below $10k, 4.5% for AGIs $10k-25k, 0.2% for AGIs $25k-50k, 0.1% for AGIs $50k-75k, 0.3% for AGIs $75k-100k, 0.9% for AGIs over 100k)
IRA payment deduction: $1,879 (reported on 1.5% of returns)
11434:
$1,879
New York:
$3,115
(% of AGI for various income ranges: 0.2% for AGIs below $10k, 0.1% for AGIs $10k-25k, 0.1% for AGIs $25k-50k, 0.0% for AGIs $50k-75k, 0.1% for AGIs $75k-100k, 0.0% for AGIs over 100k)
Total itemized deductions: $17,979 (34% of AGI, reported on 43.3% of returns)
Here:
$17,979
State:
$25,864
Here:
34.4% of AGI
State:
21.9% of AGI
(% of AGI for various income ranges: 9.5% for AGIs below $10k, 13.5% for AGIs $10k-25k, 22.4% for AGIs $25k-50k, 26.1% for AGIs $50k-75k, 25.9% for AGIs $75k-100k, 22.2% for AGIs over 100k)
Charity contributions deductions: $3,709 (7% of AGI, reported on 40.4% of returns)
Here:
$3,709
State:
$4,439
Here:
7.0% of AGI
State:
3.6% of AGI
(% of AGI for various income ranges: 0.9% for AGIs below $10k, 2.2% for AGIs $10k-25k, 4.4% for AGIs $25k-50k, 5.1% for AGIs $50k-75k, 5.0% for AGIs $75k-100k, 4.8% for AGIs over 100k)
Total tax: $3,605 (reported on 69.8% of returns)
11434:
$3,605
State:
$11,730
(% of AGI for various income ranges: 3.6% for AGIs below $10k, 3.1% for AGIs $10k-25k, 5.4% for AGIs $25k-50k, 8.4% for AGIs $50k-75k, 9.9% for AGIs $75k-100k, 13.6% for AGIs over 100k)
Earned income credit: $1,702 (reported on 23.2% of returns)
Here:
$1,702
State:
$1,757
Percentage of individuals using paid preparers for their 2004 taxes: 70.3%
Here:
70%
State:
67%
(% for various income ranges: 65.3% for AGIs below $10k, 72.7% for AGIs $10k-25k, 70.8% for AGIs $25k-50k, 69.7% for AGIs $50k-75k, 71.5% for AGIs $75k-100k, 75.1% for AGIs over 100k)
Likely homosexual households (counted as self-reported same-sex unmarried-partner households)
Lesbian couples: 0.0% of all households
Gay men: 0.0% of all households
Household received Food Stamps/SNAP in the past 12 months: 3,840 Household did not receive Food Stamps/SNAP in the past 12 months: 19,660
Women who had a birth in the past 12 months: 1,126 (394 now married, 752 unmarried) Women who did not have a birth in the past 12 months: 14,351 (4,351 now married, 10,041 unmarried)
Housing units in zip code 11434 with a mortgage: 7,738 (277 second mortgage, 7 home equity loan, 203 both second mortgage and home equity loan) Houses without a mortgage: 106
Median monthly owner costs for units with a mortgage: $2,839 Median monthly owner costs for units without a mortgage: $845
Residents with income below the poverty level in 2022:
This zip code:
13.0%
Whole state:
14.3%
Residents with income below 50% of the poverty level in 2022:
This zip code:
5.4%
Whole state:
6.8%
Median number of rooms in houses and condos:
Here:
5.8
State:
6.3
Median number of rooms in apartments:
Here:
4.2
State:
3.8
Notable locations in this zip code not listed on our city pages
Notable locations in zip code 11434: Saint Albans Station (A), Locust Manor Station (B), Baisley Park Branch Queens Borough Public Library (C), Saint Albans Veterans Administration - Extended Care Center (D), Footprints Dance Theater (E). Display/hide their locations on the map
Churches in zip code 11434 include: Westminister Presbyterian Church (A), Springfield Gardens United Methodist Church (B), Seven Gifts Pentecostal Church (C), Saint Bonaventure Church (D), Saint Albans Congregational Church (E), Christ the King Roman Catholic Church (F). Display/hide their locations on the map
Parks in zip code 11434 include: Saint Albans Memorial Park (1), Roy Wilkins Southern Queens Park (2), Nautilus Playground (3), Railroad Park (4), North Rochdale Playground (5), Rochdale Park (6), South Rochdale Playground (7), North Green (8), Sulphin Playground (9). Display/hide their locations on the map
5,941 married couples with children.
4,143 single-parent households (434 men, 3,709 women).
83.7% of residents of 11434 zip code speak English at home.
7.5% of residents speak Spanish at home (55% very well, 24% well, 18% not well, 3% not at all).
6.2% of residents speak other Indo-European language at home (50% very well, 35% well, 12% not well, 2% not at all).
0.5% of residents speak Asian or Pacific Island language at home (48% very well, 17% well, 15% not well, 20% not at all).
2.0% of residents speak other language at home (72% very well, 21% well, 7% not well).
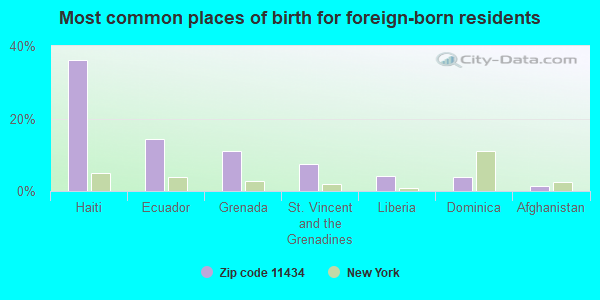
Foreign born population: 23,127 (34.5%) (75.5% of them are naturalized citizens)
This zip code:
34.5%
Whole state:
22.7%
36%Haiti
14%Ecuador
11%Grenada
7%St. Vincent and the Grenadines
4%Liberia
4%Dominica
1%Afghanistan
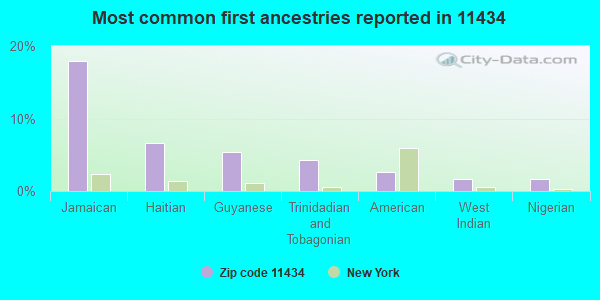
18%Jamaican
7%Haitian
5%Guyanese
4%Trinidadian and Tobagonian
3%American
2%West Indian
2%Nigerian
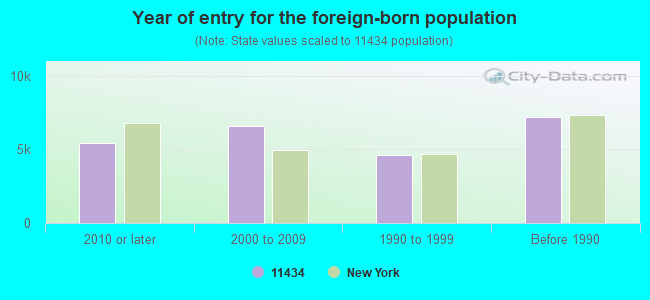
Year of entry for the foreign-born population
5,4312010 or later
6,5802000 to 2009
4,6301990 to 1999
7,171Before 1990
Public high schools in in zip code 11434 not listed on the city page:
Major facilities with environmental interests located in this zip code:
ALOHA DRIVE IN FRENCH CLEANERS (161-43 BAISLEY BOULEVARD in JAMAICA, NY)
AIR MINOR (AIRS/AFS) STATE MASTER (New York facility tracking) - AIR PROGRAM, HAZARDOUS WASTE PROGRAM Small Quantity Generators, between 100 kg and 1000 kg of hazardous waste/month (Resource Conservation and Recovery Act (tracking hazardous waste)) - notification (Resource Conservation and Recovery Act (tracking hazardous waste)) Business SIC classification: DRYCLEANING PLANTS, EXCEPT RUG CLEANING Business NAICS classification: DRYCLEANING AND LAUNDRY SERVICES (EXCEPT COIN-OPERATED). Organizations: ALOHA JD CORP, ALOHA 161 CLEANERS INC (CONTACT/OWNER)
Alternative names: ALOHA FRENCH DRIVE-IN
21ST CENTURY CLEANERS (129-02 GUY R BREWER BOULEVARD in JAMAICA, NY)
AIR MINOR (AIRS/AFS) STATE MASTER (New York facility tracking) - AIR PROGRAM (Resource Conservation and Recovery Act (tracking hazardous waste)) Business SIC classification: DRYCLEANING PLANTS, EXCEPT RUG CLEANING Business NAICS classification: DRYCLEANING AND LAUNDRY SERVICES (EXCEPT COIN-OPERATED). Organizations: KIM WONKIL (CONTACT/OWNER)
, 21ST CENTURY CLEANERS INC (LEGALLY RESPONSIBLE PARTY)
Alternative names: 21 CENTURY CLEANERS
ARDEN ESQUIRE REALTY (132-20 MERRICK BLVD in JAMAICA, NY)
AIR MINOR (AIRS/AFS) (Integrated Compliance Information System) - ICIS-02-1988-0491, FORMAL ENFORCEMENT ACTION, ICIS-02-2000-1025, (Resource Conservation and Recovery Act (tracking hazardous waste)) Business SIC classification: SPECIALTY CLEANING, POLISHING, AND SANITATION PREPARATIONS Alternative names: 132-20 MERRICK BLVD BUILDING
HIP CLEANERS (169-47 137TH AVENUE in JAMAICA, NY)
AIR MINOR (AIRS/AFS) STATE MASTER (New York facility tracking) - AIR PROGRAM, HAZARDOUS WASTE PROGRAM Conditionally Exempt Small Quantity Generators, less than 100 kg/month of hazardous waste (Resource Conservation and Recovery Act (tracking hazardous waste)) - notification Business SIC classification: DRYCLEANING PLANTS, EXCEPT RUG CLEANING Business NAICS classification: DRYCLEANING AND LAUNDRY SERVICES (EXCEPT COIN-OPERATED). Organizations: JEONG-SUK SUE (CONTACT/OWNER)
GREEN BUS LINES INCORPORATED (165-25 147TH AVENUE in JAMAICA, NY)
(Integrated Compliance Information System) - ICIS-02-1999-7912, FORMAL ENFORCEMENT ACTION HAZARDOUS WASTE BIENNIAL REPORTER (Resource Conservation and Recovery Act (tracking hazardous waste)) Small Quantity Generators, between 100 kg and 1000 kg of hazardous waste/month (Resource Conservation and Recovery Act (tracking hazardous waste)) Business SIC classification: LOCAL AND SUBURBAN TRANSIT Organizations: MTA BUS CO (CONTACT/OPERATOR)
126-10 BEDELL STREET SCHOOL - P-30 (126-10 BEDELL STREET in QUEENS, NY)
STATE MASTER (New York facility tracking) - AIR PROGRAM Conditionally Exempt Small Quantity Generators, less than 100 kg/month of hazardous waste (Resource Conservation and Recovery Act (tracking hazardous waste)) - notification Business SIC and NAICS classification: ELEMENTARY AND SECONDARY SCHOOLS Organizations: NYC BOARD OF EDUCATION (CONTACT/OWNER)
, NYC DEPT OF EDUCATION (LEGALLY RESPONSIBLE PARTY)
Alternative names: NYC BD OF ED - PUBLIC SCHOOL 30 QUEENS
ANDRES CLEANERS (114-26 MERRICK BLVD in JAMAICA, NY)
STATE MASTER (New York facility tracking) - HAZARDOUS WASTE PROGRAM (Resource Conservation and Recovery Act (tracking hazardous waste)) Business SIC classification: DRYCLEANING PLANTS, EXCEPT RUG CLEANING
HASSELL BROS-AUTOBODY (146-10 GUY R BREWER BLVD in JAMAICA, NY)
STATE MASTER (New York facility tracking) - AIR PROGRAM, Small Quantity Generators, between 100 kg and 1000 kg of hazardous waste/month (Resource Conservation and Recovery Act (tracking hazardous waste)) - notification Organizations: ELSWORTH C HASSELL (CONTACT/OWNER)
, HASSELL BROS INC (LEGALLY RESPONSIBLE PARTY)
Alternative names: HASSELL BROTHERS INC
H W ST JOHN SWPC CHEMICAL AREA (167-21 PORTER RD in JAMAICA, NY)
Small Quantity Generators, between 100 kg and 1000 kg of hazardous waste/month (Resource Conservation and Recovery Act (tracking hazardous waste)) - notification Conditionally Exempt Small Quantity Generators, less than 100 kg/month of hazardous waste (Resource Conservation and Recovery Act (tracking hazardous waste)) - notification Organizations: ESSEX MANAGEMENT (CONTACT/OWNER)
, SIEMENS WESTINGHOUSE POWER CORP (CONTACT/OWNER)
Alternative names: H W ST JOHN & CO
HOLBAN SUBSTATION (178-16 SAYERS STREET in NEW YORK CITY, NY)
HAZARDOUS WASTE BIENNIAL REPORTER (Resource Conservation and Recovery Act (tracking hazardous waste)) (Resource Conservation and Recovery Act (tracking hazardous waste))
GETTY PETROLEUM CORP (116-60 SUTPHIN BLVD in JAMAICA, NY)
(Resource Conservation and Recovery Act (tracking hazardous waste))
GETTY PETROLEUM CORP (171-07 BAISLEY BLVD in JAMAICA, NY)
(Resource Conservation and Recovery Act (tracking hazardous waste))
GETTY-156/05 ROCKAWAY BLVD (156/05 ROCKAWAY BLVD in OZONE PARK, NY)
AIR MINOR (AIRS/AFS) Business SIC classification: GASOLINE SERVICE STATIONS Alternative names: GETTY QUICK
Housing units lacking complete plumbing facilities: 0.3% Housing units lacking complete kitchen facilities: 0.5%
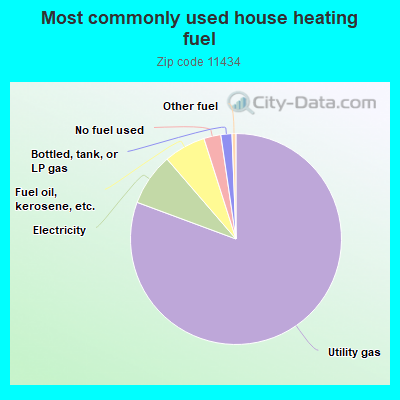
80.5%Utility gas
8.0%Electricity
6.4%Fuel oil, kerosene, etc.
2.6%No fuel used
1.7%Bottled, tank, or LP gas
0.6%Other fuel
Population in 1990: 50,464. Population change in the 1990s: +8,678 (+17.2%).
Place of birth for U.S.-born residents:
This state: 37,883
Northeast: 715
Midwest: 602
South: 3,585
West: 187
74% of the 11434 zip code residents lived in the same house 5 years ago. Out of people who lived in different houses, 64% lived in this county. Out of people who lived in different counties, 50% lived in New York.
94% of the 11434 zip code residents lived in the same house 1 year ago. Out of people who lived in different houses, 51% moved from this county. Out of people who lived in different houses, 35% moved from different county within same state. Out of people who lived in different houses, 11% moved from different state. Out of people who lived in different houses, 3% moved from abroad.
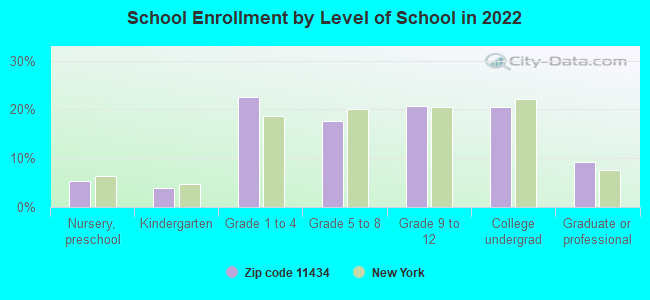
Private vs. public school enrollment:
Students in private schools in grades 1 to 8 (elementary and middle school): 565
Here:
8.2%
New York:
15.6%
Students in private schools in grades 9 to 12 (high school): 366
Here:
10.2%
New York:
15.0%
Students in private undergraduate colleges: 543
Here:
15.6%
New York:
39.2%
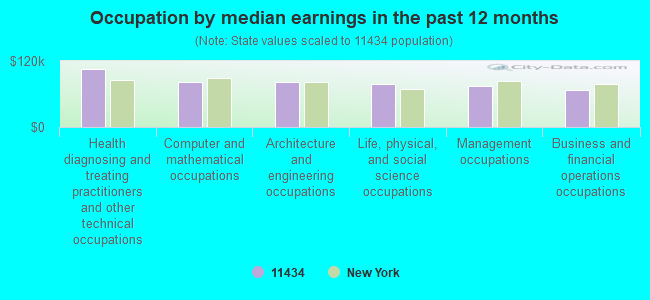
Occupation by median earnings in the past 12 months ($)
105,601Health diagnosing and treating practitioners and other technical occupations
82,080Computer and mathematical occupations
81,051Architecture and engineering occupations
77,330Life, physical, and social science occupations
74,156Management occupations
67,330Business and financial operations occupations
Companies with federal contracts located in this zip code:
HALMAR EQUITIES INC (N HANGER RD BLDG 75 in JAMAICA, NY) : $533,000 in 10 contractsfrom 1999 to 2002
Contracts for Lease or Rental of Facilities -- Office Buildings by Public Buildings Service Signed by year:2000: $164,000; 2001: $246,000; 2002: $82,000; 2003: $0; 2004: $0; 2005: $0; 2006: $0.
Biggest contracts:
$82,000 with Public Buildings Service for Lease or Rental of Facilities -- Office Buildings. Signed on 2002-03-15. Completion date: 2002-03-15.
$82,000, same as above.Signed on 2001-12-15. Completion date: 2001-12-15.
$82,000, same as above.Signed on 2001-09-15. Completion date: 2001-09-15.
$41,000, same as above.Signed on 2000-12-15. Completion date: 2000-12-15.
MAGDAD, INC. (168-26 119 AVENUE in ST. ALBANS, NY; small business)
$4,000 with Bureau of Prisoners/Federal Prison System for Maintenance, Repair and Rebuilding of Equipment -- Refrigeration, Air Conditioning, and Air Circulating Equipment. Signed on 2004-12-27. Completion date: 2005-01-05.
Top industries in this zip code by the number of employees in 2005:
Other Services (except Public Administration): Religious Organizations (500-999 employees: 1 establishment, 100-249 employees: 1 establishment, 10-19 employees: 1 establishment, 5-9 employees: 4 establishments, 1-4 employees: 9 establishments)
Administrative and Support and Waste Management and Remediation Services: Security Guards and Patrol Services (500-999: 1, 20-49: 2)
Real Estate and Rental and Leasing: Lessors of Residential Buildings and Dwellings (250-499: 1, 10-19: 1, 5-9: 2, 1-4: 2)
Health Care and Social Assistance: Child Day Care Services (100-249: 1, 20-49: 4, 10-19: 5, 5-9: 2, 1-4: 5)
2007 - 2018 National Fire Incident Reporting System (NFIRS) incidents
According to the data from the years 2007 - 2018 the average number of fire incidents per year is 298. The highest number of reported fires - 338 took place in 2017, and the least - 212 in 2007. The data has a rising trend.
When looking into fire subcategories, the most incidents belonged to: Structure Fires (76.2%), and Outside Fires (13.2%).
Fire incident types reported to NFIRS in Zip Code 11434


 Nearest zip codes: 11436, 11433, 11413, 11412, 11430, 11451.


 (Students: 1,229, Location: 156-10 BAISLEY BLVD, Grades: 9-12)

 According to the data from the years 2007 - 2018 the average number of fire incidents per year is 298. The highest number of reported fires - 338 took place in 2017, and the least - 212 in 2007. The data has a rising trend.
 When looking into fire subcategories, the most incidents belonged to: Structure Fires (76.2%), and Outside Fires (13.2%).