Estimated zip code population in 2022: 8,661 Zip code population in 2010: 7,135 Zip code population in 2000: 884
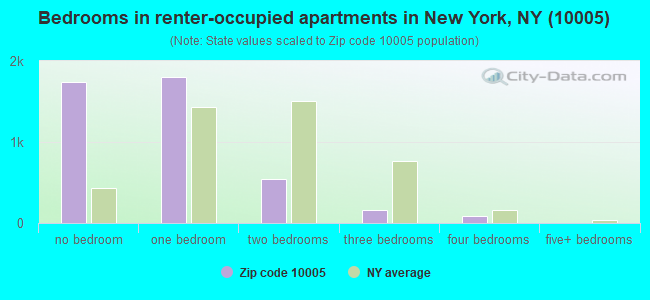
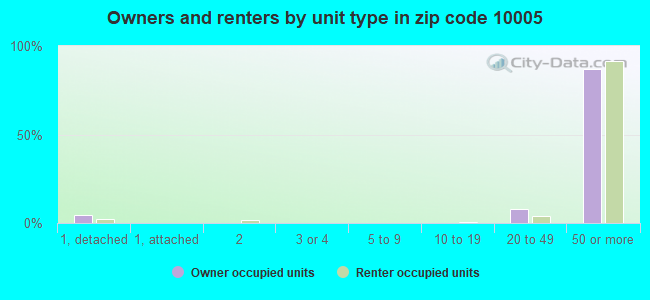
Houses and condos: 6,339 Renter-occupied apartments: 4,176
% of renters here:
83%
State:
46%
March 2022 cost of living index in zip code 10005: 158.5 (very high, U.S. average is 100)
Land area: 0.1 sq. mi. Water area: 0.0 sq. mi.
Population density: 117,805 people per square mile
(very high).
OSM Map
General Map
Google Map
MSN Map
OSM Map
General Map
Google Map
MSN Map
OSM Map
General Map
Google Map
MSN Map
OSM Map
General Map
Google Map
MSN Map
Please wait while loading the map...
Real estate property taxes paid for housing units in 2022:
This zip code:
0.5% ($9,805)
New York:
1.5% ($6,180)
Median real estate property taxes paid for housing units with mortgages in 2022: $9,858 (0.7%) Median real estate property taxes paid for housing units with no mortgage in 2022: $9,755 (0.5%)
Estimated median house/condo value in 2022: $1,824,265
10005:
$1,824,265
New York:
$400,400
According to our research of New York and other state lists, there was 1 registered sex offender living in 10005 zip code as of April 26, 2024. The ratio of all residents to sex offenders in zip code 10005 is 8,834 to 1. The ratio of registered sex offenders to all residents in this zip code is much lower than the state average.
Median resident age:
This zip code:
30.1 years
New York median age:
40.0 years
Average household size:
This zip code:
1.7 people
New York:
2.5 people
Averages for the 2020 tax year for zip code 10005, filed in 2021:
Average Adjusted Gross Income (AGI) in 2020: $426,485 (Individual Income Tax Returns)
Here:
$426,485
State:
$90,930
Salary/wage: $187,518 (reported on 87.3% of returns)
Here:
$187,518
State:
$72,104
(% of AGI for various income ranges: 1250.2% for AGIs below $25k, 3768.1% for AGIs $25k-50k, 7239.3% for AGIs $50k-75k, 11125.0% for AGIs $75k-100k, 22154.8% for AGIs $100k-200k, 182815.3% for AGIs over 200k)
Taxable interest for individuals: $7,466 (reported on 43.9% of returns)
This zip code:
$7,466
New York:
$3,075
(% of AGI for various income ranges: 23.3% for AGIs below $25k, 19.8% for AGIs $25k-50k, 17.0% for AGIs $50k-75k, 35.9% for AGIs $75k-100k, 90.8% for AGIs $100k-200k, 4998.5% for AGIs over 200k)
Ordinary dividends: $107,212 (reported on 46.3% of returns)
Here:
$107,212
State:
$11,095
(% of AGI for various income ranges: 94.3% for AGIs below $25k, 159.5% for AGIs $25k-50k, 129.8% for AGIs $50k-75k, 167.0% for AGIs $75k-100k, 353.0% for AGIs $100k-200k, 79168.2% for AGIs over 200k)
Net capital gain/loss in AGI: +$207,714 (reported on 43.9% of returns)
Here:
+$207,714
State:
+$44,925
(% of AGI for various income ranges: 100.0% for AGIs below $25k, 125.7% for AGIs $25k-50k, 102.0% for AGIs $50k-75k, 315.2% for AGIs $75k-100k, 603.8% for AGIs $100k-200k, 146202.9% for AGIs over 200k)
Profit/loss from business: +$44,312 (reported on 17.0% of returns)
Here:
+$44,312
State:
+$14,940
(% of AGI for various income ranges: 280.5% for AGIs below $25k, 475.5% for AGIs $25k-50k, 468.7% for AGIs $50k-75k, 237.3% for AGIs $75k-100k, 663.3% for AGIs $100k-200k, 8724.4% for AGIs over 200k)
Taxable individual retirement arrangement distribution: $39,500 (reported on 3.3% of returns)
10005:
$39,500
New York:
$19,609
(% of AGI for various income ranges: 78.3% for AGIs below $25k, 48.9% for AGIs $50k-75k, 150.9% for AGIs $100k-200k, 1566.2% for AGIs over 200k)
Self-employed (Keogh) retirement plans: $37,969 (reported on 2.4% of returns)
10005:
$37,969
New York:
$32,497
(% of AGI for various income ranges: 92.8% for AGIs $50k-75k, 1304.4% for AGIs over 200k)
Total itemized deductions: $116,437 (reported on 16.5% of returns)
Here:
$116,437
State:
$39,326
(% of AGI for various income ranges: 146.4% for AGIs below $25k, 207.4% for AGIs $25k-50k, 154.8% for AGIs $50k-75k, 189.3% for AGIs $75k-100k, 590.8% for AGIs $100k-200k, 28863.5% for AGIs over 200k)
Charity contributions: $100,196 (reported on 13.6% of returns)
Here:
$100,196
State:
$15,420
(% of AGI for various income ranges: 31.0% for AGIs $25k-50k, 17.3% for AGIs $75k-100k, 115.2% for AGIs $100k-200k, 21773.8% for AGIs over 200k)
Taxes paid: $9,440 (reported on 16.5% of returns)
10005:
$9,440
State:
$9,183
(% of AGI for various income ranges: 38.8% for AGIs below $25k, 49.5% for AGIs $25k-50k, 45.2% for AGIs $50k-75k, 66.8% for AGIs $75k-100k, 218.4% for AGIs $100k-200k, 1751.8% for AGIs over 200k)
Earned income credit: $847 (reported on 2.7% of returns)
Here:
$847
State:
$2,138
(% of AGI for various income ranges: 30.2% for AGIs below $25k)
Percentage of individuals using paid preparers for their 2020 taxes: 96.2%
Here:
96%
State:
95%
(% for various income ranges: 94.3% for AGIs below $25k, 94.8% for AGIs $25k-50k, 97.2% for AGIs $50k-75k, 96.8% for AGIs $75k-100k, 97.1% for AGIs $100k-200k, 96.1% for AGIs over 200k)
Averages for the 2012 tax year for zip code 10005, filed in 2013:
Average Adjusted Gross Income (AGI) in 2012: $983,554 (Individual Income Tax Returns)
Here:
$983,554
State:
$77,088
Salary/wage: $215,824 (reported on 84.6% of returns)
Here:
$215,824
State:
$60,593
(% of AGI for various income ranges: 68.6% for AGIs below $25k, 85.8% for AGIs $25k-50k, 90.0% for AGIs $50k-75k, 90.1% for AGIs $75k-100k, 87.1% for AGIs $100k-200k, 14.5% for AGIs over 200k)
Taxable interest for individuals: $169,628 (reported on 55.7% of returns)
This zip code:
$169,628
New York:
$3,125
(% of AGI for various income ranges: 2.2% for AGIs below $25k, 0.5% for AGIs $25k-50k, 0.7% for AGIs $50k-75k, 0.7% for AGIs $75k-100k, 0.8% for AGIs $100k-200k, 10.1% for AGIs over 200k)
Ordinary dividends: $157,638 (reported on 44.8% of returns)
Here:
$157,638
State:
$10,299
(% of AGI for various income ranges: 11.6% for AGIs below $25k, 2.1% for AGIs $25k-50k, 1.8% for AGIs $50k-75k, 1.8% for AGIs $75k-100k, 2.9% for AGIs $100k-200k, 7.4% for AGIs over 200k)
Net capital gain/loss in AGI: +$1,099,976 (reported on 40.3% of returns)
Here:
+$1,099,976
State:
+$42,474
(% of AGI for various income ranges: 2.6% for AGIs below $25k, 1.8% for AGIs $25k-50k, 1.3% for AGIs $50k-75k, 1.4% for AGIs $75k-100k, 2.7% for AGIs $100k-200k, 47.6% for AGIs over 200k)
Profit/loss from business: +$38,749 (reported on 16.1% of returns)
Here:
+$38,749
State:
+$16,168
(% of AGI for various income ranges: 17.8% for AGIs below $25k, 7.1% for AGIs $25k-50k, 4.6% for AGIs $50k-75k, 2.5% for AGIs $75k-100k, 3.6% for AGIs $100k-200k, 0.4% for AGIs over 200k)
Taxable individual retirement arrangement distribution: $168,308 (reported on 4.7% of returns)
10005:
$168,308
New York:
$17,621
(% of AGI for various income ranges: 0.7% for AGIs $25k-50k, 1.1% for AGIs $50k-75k, 0.9% for AGIs $100k-200k, 0.8% for AGIs over 200k)
Self-employment retirement plans: $31,458 (reported on 3.4% of returns)
10005:
$31,458
New York:
$27,330
(% of AGI for various income ranges: 0.3% for AGIs $100k-200k, 0.1% for AGIs over 200k)
Total itemized deductions: $293,564 (19% of AGI, reported on 63.3% of returns)
Here:
$293,564
State:
$34,985
Here:
19.2% of AGI
State:
21.3% of AGI
(% of AGI for various income ranges: 13.8% for AGIs below $25k, 7.8% for AGIs $25k-50k, 9.3% for AGIs $50k-75k, 12.7% for AGIs $75k-100k, 16.1% for AGIs $100k-200k, 19.2% for AGIs over 200k)
Charity contributions: $139,314 (reported on 44.4% of returns)
Here:
$139,314
State:
$5,572
(% of AGI for various income ranges: 0.2% for AGIs below $25k, 0.5% for AGIs $25k-50k, 0.8% for AGIs $50k-75k, 0.9% for AGIs $75k-100k, 1.0% for AGIs $100k-200k, 6.6% for AGIs over 200k)
Taxes paid: $139,376 (reported on 62.7% of returns)
10005:
$139,376
State:
$18,656
(% of AGI for various income ranges: 4.5% for AGIs below $25k, 2.7% for AGIs $25k-50k, 4.3% for AGIs $50k-75k, 7.9% for AGIs $75k-100k, 10.3% for AGIs $100k-200k, 8.9% for AGIs over 200k)
Earned income credit: $886 (reported on 2.5% of returns)
Here:
$886
State:
$2,230
(% of AGI for various income ranges: 1.4% for AGIs below $25k)
Percentage of individuals using paid preparers for their 2012 taxes: 60.9%
Here:
61%
State:
66%
(% for various income ranges: 59.0% for AGIs below $25k, 51.2% for AGIs $25k-50k, 51.9% for AGIs $50k-75k, 50.0% for AGIs $75k-100k, 58.1% for AGIs $100k-200k, 78.8% for AGIs over 200k)
Averages for the 2004 tax year for zip code 10005, filed in 2005:
Average Adjusted Gross Income (AGI) in 2004: $1,020,734 (Individual Income Tax Returns)
Here:
$1,020,734
State:
$59,519
Salary/wage: $318,151 (reported on 76.4% of returns)
Here:
$318,151
State:
$50,673
(% of AGI for various income ranges: 79.3% for AGIs $10k-25k, 87.5% for AGIs $25k-50k, 81.3% for AGIs $50k-75k, 83.9% for AGIs $75k-100k, 22.4% for AGIs over 100k)
Taxable interest for individuals: $99,329 (reported on 70.3% of returns)
This zip code:
$99,329
New York:
$2,377
(% of AGI for various income ranges: 3.8% for AGIs $10k-25k, 1.1% for AGIs $25k-50k, 2.2% for AGIs $50k-75k, 2.2% for AGIs $75k-100k, 6.9% for AGIs over 100k)
Taxable dividends: $148,374 (reported on 52.7% of returns)
Here:
$148,374
State:
$5,394
(% of AGI for various income ranges: 12.8% for AGIs $10k-25k, 4.1% for AGIs $25k-50k, 5.2% for AGIs $50k-75k, 5.3% for AGIs $75k-100k, 7.7% for AGIs over 100k)
Net capital gain/loss: +$1,201,994 (reported on 49.4% of returns)
Here:
+$1,201,994
State:
+$23,581
(% of AGI for various income ranges: 5.5% for AGIs $10k-25k, 2.4% for AGIs $25k-50k, 3.8% for AGIs $50k-75k, 3.6% for AGIs $75k-100k, 59.4% for AGIs over 100k)
Profit/loss from business: +$25,384 (reported on 14.2% of returns)
Here:
+$25,384
State:
+$13,809
(% of AGI for various income ranges: 4.5% for AGIs $10k-25k, 3.5% for AGIs $25k-50k, 3.4% for AGIs $50k-75k, 2.7% for AGIs $75k-100k, 0.3% for AGIs over 100k)
IRA payment deduction: $3,308 (reported on 2.8% of returns)
10005:
$3,308
New York:
$3,115
Self-employed pension: $26,048 (reported on 4.6% of returns)
Here:
$26,048
New York:
$19,016
Total itemized deductions: $244,576 (15% of AGI, reported on 63.2% of returns)
Here:
$244,576
State:
$25,864
Here:
15.3% of AGI
State:
21.9% of AGI
(% of AGI for various income ranges: 15.3% for AGIs $10k-25k, 12.8% for AGIs $25k-50k, 18.0% for AGIs $50k-75k, 15.7% for AGIs $75k-100k, 15.1% for AGIs over 100k)
Charity contributions deductions: $137,016 (7% of AGI, reported on 49.1% of returns)
Here:
$137,016
State:
$4,439
Here:
6.8% of AGI
State:
3.6% of AGI
(% of AGI for various income ranges: 0.7% for AGIs $10k-25k, 1.1% for AGIs $25k-50k, 2.0% for AGIs $50k-75k, 2.1% for AGIs $75k-100k, 6.7% for AGIs over 100k)
Total tax: $223,933 (reported on 90.2% of returns)
10005:
$223,933
State:
$11,730
(% of AGI for various income ranges: 6.3% for AGIs $10k-25k, 9.7% for AGIs $25k-50k, 13.6% for AGIs $50k-75k, 14.8% for AGIs $75k-100k, 19.9% for AGIs over 100k)
Earned income credit: $567 (reported on 1.3% of returns)
Here:
$567
State:
$1,757
Percentage of individuals using paid preparers for their 2004 taxes: 71.4%
Here:
71%
State:
67%
(% for various income ranges: 72.1% for AGIs below $10k, 63.2% for AGIs $10k-25k, 50.4% for AGIs $25k-50k, 62.5% for AGIs $50k-75k, 64.3% for AGIs $75k-100k, 86.1% for AGIs over 100k)
Likely homosexual households (counted as self-reported same-sex unmarried-partner households)
Lesbian couples: 0.1% of all households
Gay men: 1.2% of all households
Household received Food Stamps/SNAP in the past 12 months: 53 Household did not receive Food Stamps/SNAP in the past 12 months: 4,847
Women who had a birth in the past 12 months: 105 (103 now married, 0 unmarried) Women who did not have a birth in the past 12 months: 3,620 (798 now married, 2,846 unmarried)
Housing units in zip code 10005 with a mortgage: 545 (65 second mortgage, 17 both second mortgage and home equity loan) Median monthly owner costs for units with a mortgage: $3,860 Median monthly owner costs for units without a mortgage: $1,487
Residents with income below the poverty level in 2022:
This zip code:
5.5%
Whole state:
14.3%
Residents with income below 50% of the poverty level in 2022:
This zip code:
2.2%
Whole state:
6.8%
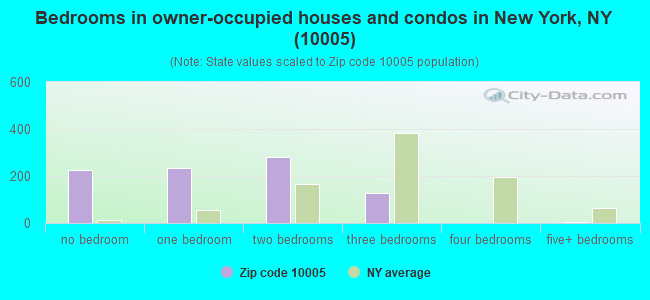
Median number of rooms in houses and condos:
Here:
3.0
State:
6.3
Median number of rooms in apartments:
Here:
2.1
State:
3.8
Notable locations in this zip code not listed on our city pages
Notable locations in zip code 10005: Wall Street Subway Station (A), New York Cocoa Exchange Building (B), Trump Building (C), New York Stock Exchange (D), Wall Street Plaza (E), Continental Center (F), American International Building (G), Wallace Building (H), Liberty Tower (I), New York Ladder Company 15 (J), Fire Department New York Engine 4 Ladder 15 (K). Display/hide their locations on the map
644 married couples with children.
235 single-parent households (3 men, 232 women).
75.2% of residents of 10005 zip code speak English at home.
6.0% of residents speak Spanish at home (81% very well, 19% well).
7.2% of residents speak other Indo-European language at home (100% very well).
9.1% of residents speak Asian or Pacific Island language at home (97% very well, 3% not well).
1.6% of residents speak other language at home (100% very well).
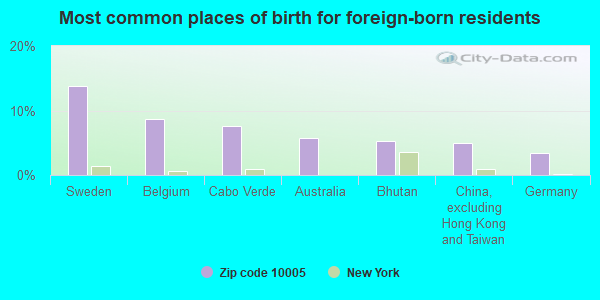
Foreign born population: 1,706 (19.7%) (36.9% of them are naturalized citizens)
Major facilities with environmental interests located in this zip code:
CON ED - V 137 (48 WALL ST in MANHATTAN, NY)
HAZARDOUS WASTE BIENNIAL REPORTER (Resource Conservation and Recovery Act (tracking hazardous waste)) (Resource Conservation and Recovery Act (tracking hazardous waste)) Alternative names: V1377
CON ED V 272 (2 CEDAR STREET in NEW YORK CITY, NY)
HAZARDOUS WASTE BIENNIAL REPORTER (Resource Conservation and Recovery Act (tracking hazardous waste)) (Resource Conservation and Recovery Act (tracking hazardous waste)) Alternative names: CON EDISON - CEDAR STREET SERVICE
CON ED V 3965 (41 NEW STREET in MANHATTAN, NY)
HAZARDOUS WASTE BIENNIAL REPORTER (Resource Conservation and Recovery Act (tracking hazardous waste)) (Resource Conservation and Recovery Act (tracking hazardous waste)) Alternative names: V3965
CON ED V6636 (43 EXCHANGE PLACE in MANHATTAN, NY)
HAZARDOUS WASTE BIENNIAL REPORTER (Resource Conservation and Recovery Act (tracking hazardous waste)) (Resource Conservation and Recovery Act (tracking hazardous waste))
H F STAIGER CO (WALL ST PLZ in NEW YORK, NY)
(Integrated Compliance Information System) - ICIS-02-1988-0024, FORMAL ENFORCEMENT ACTION
CON ED V 3155 (114 WALL STREET in MANHATTAN, NY)
HAZARDOUS WASTE BIENNIAL REPORTER (Resource Conservation and Recovery Act (tracking hazardous waste)) (Resource Conservation and Recovery Act (tracking hazardous waste)) Small Quantity Generators, between 100 kg and 1000 kg of hazardous waste/month (Resource Conservation and Recovery Act (tracking hazardous waste)) - notification Organizations: CITIBANK NA (CONTACT/OWNER)
Alternative names: CON EDISON - CITIBANK NA
77 WATER STREET LLC (WATER ST in NEW YORK, NY)
Large Quantity Generators, more that 1000 kg of hazardous waste/month (Resource Conservation and Recovery Act (tracking hazardous waste)) Organizations: WATER STREET LEASEHOLD LLC (CONTACT/OPERATOR)
, NICK GRASSO (CONTACT/OWNER)
Alternative names: 77 WATER STREET LLC - SAGE REALTY
140 BROADWAY MSDW PROPERTIES L L C (140 BROADWAY in NEW YORK, NY)
HAZARDOUS WASTE BIENNIAL REPORTER (Resource Conservation and Recovery Act (tracking hazardous waste)) Large Quantity Generators, more that 1000 kg of hazardous waste/month (Resource Conservation and Recovery Act (tracking hazardous waste)) Business NAICS classification: NONRESIDENTIAL PROPERTY MANAGERS. Alternative names: 140 BROADWAY MSDW PROPERTIES LLC
CON EDISON - 65TH FLOOR VAULT (40 WALL ST in NEW YORK, NY)
HAZARDOUS WASTE BIENNIAL REPORTER (Resource Conservation and Recovery Act (tracking hazardous waste)) (Resource Conservation and Recovery Act (tracking hazardous waste))
CON ED - V 5042 (28 S WILLIAM ST in MANHATTAN, NY)
HAZARDOUS WASTE BIENNIAL REPORTER (Resource Conservation and Recovery Act (tracking hazardous waste)) (Resource Conservation and Recovery Act (tracking hazardous waste))
CON ED - V4653 (41 NEW ST in MANHATTAN, NY)
HAZARDOUS WASTE BIENNIAL REPORTER (Resource Conservation and Recovery Act (tracking hazardous waste)) (Resource Conservation and Recovery Act (tracking hazardous waste))
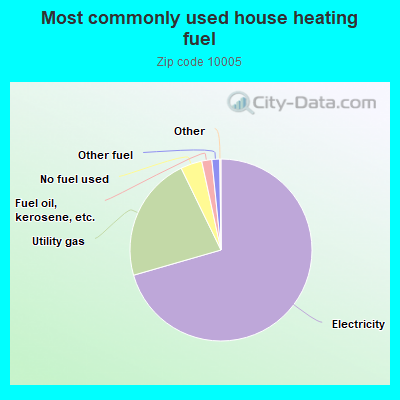
70.6%Electricity
22.3%Utility gas
3.8%No fuel used
1.8%Fuel oil, kerosene, etc.
1.4%Other fuel
Population in 1990: 202. Population change in the 1990s: +682 (+337.6%).
Place of birth for U.S.-born residents:
This state: 3,034
Northeast: 1,195
Midwest: 627
South: 1,171
West: 821
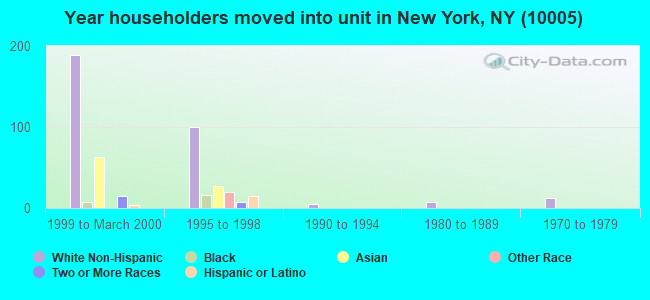
6% of the 10005 zip code residents lived in the same house 5 years ago. Out of people who lived in different houses, 25% lived in this county. Out of people who lived in different counties, 50% lived in New York.
65% of the 10005 zip code residents lived in the same house 1 year ago. Out of people who lived in different houses, 66% moved from this county. Out of people who lived in different houses, 9% moved from different county within same state. Out of people who lived in different houses, 19% moved from different state. Out of people who lived in different houses, 6% moved from abroad.
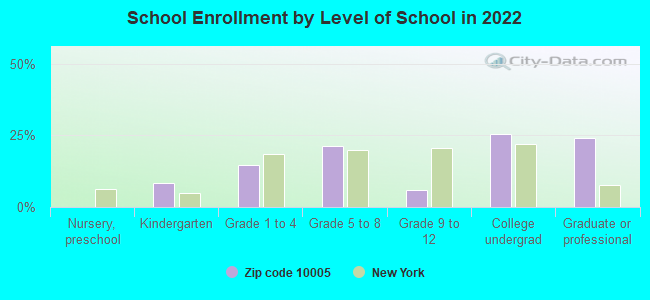
Private vs. public school enrollment:
Students in private schools in grades 1 to 8 (elementary and middle school): 66
Here:
21.4%
New York:
15.6%
Students in private schools in grades 9 to 12 (high school):
Here:
0.0%
New York:
15.0%
Students in private undergraduate colleges: 160
Here:
70.6%
New York:
39.2%
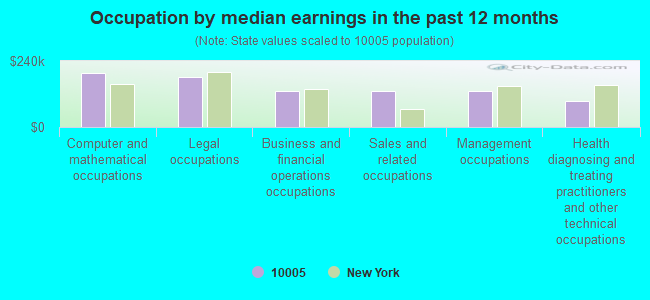
Occupation by median earnings in the past 12 months ($)
196,572Computer and mathematical occupations
180,360Legal occupations
132,204Business and financial operations occupations
132,013Sales and related occupations
131,097Management occupations
94,674Health diagnosing and treating practitioners and other technical occupations
Companies with federal contracts located in this zip code (NEW YORK, NY):
SKIDMORE, OWINGS & MERRILL LLP (14 WALL ST) : $7,677,391 in 29 contractsfrom 2000 to 2006
Contracts for Other Management Support Services, Architect - Engineer Services (including landscaping, interior layout, and designing), Other Architect and Engineering Services by Department of State, Air Force Signed by year:2000: $41,669; 2001: $431,046; 2002: $297,878; 2003: $6,322,903; 2004: $451,862; 2005: $126,409; 2006: $5,624.
Biggest contracts:
$4,066,323 with Department of State for Other Management Support Services. Taking place in DC. Signed on 2003-09-15. Completion date: 2004-11-15.
$1,831,438 with Air Force for Architect - Engineer Services (including landscaping, interior layout, and designing). Taking place in CO. Signed on 2003-07-17. Completion date: 2004-02-27.
$202,575, same as above.Signed on 2001-02-12. Completion date: 2001-09-30.
$189,983, same as above.Signed on 2002-11-18. Completion date: 2003-04-22.
INTERSYSTEMS INC (30 WALL ST FL 4; small business) : $1,161,181 in 2 contractsfrom 2000 to 2001
$746,000 with National Institutes of Health for Other Research and Development -- Basic Research (R&D). Signed on 2000-09-15. Completion date: 2002-09-15.
$415,181, same as above.Signed on 2001-03-06. Completion date: 2002-09-29.
ATLANTIC MUTUAL INSURANCE COMP (140 BROADWAY 34TH FLR) : $561,078 in 2 contractsfrom 2002 to 2003
$573,449 with Navy for Construction of Structures and Facilities -- Other Non-Building Facilities. Taking place in CA. Signed on 2002-11-20. Completion date: 2002-12-22.
-$12,371, same as above.Signed on 2003-03-19. Completion date: 2003-03-14.
RELIANCE NATIONAL INSURANCE CO (77 WATER STREET; small business) : $217,476 in 3 contractsfrom 2000 to 2001
$82,657 with U.S. Army Corps of Engineers - civil program financing only for Construction of Structures and Facilities -- Dredging. Taking place in PA. Signed on 2001-09-28. Completion date: 2000-06-22.
$77,382 with Army for Construction of Structures and Facilities -- Other Non-Building Facilities. Taking place in AL. Signed on 2000-09-26. Completion date: 2001-03-27.
$57,437 with U.S. Army Corps of Engineers - civil program financing only for Construction of Structures and Facilities -- Dredging. Taking place in PA. Signed on 2001-09-28. Completion date: 2000-06-30.
COUNCIL ON ACCREDITATION FOR C (120 WALL STREET; small business) : $197,800 in 3 contractsfrom 2001 to 2005
$97,000 with Office of Assistant Secretary for Health except national centers (disused code) for Other Professional Services. Signed on 2001-09-15. Completion date: 2002-09-15.
$75,100 with Navy for Certifications and Accreditations for Educational Institutions. Taking place in VA. Signed on 2005-09-27. Completion date: 2005-12-31.
$25,700 with Navy for Other Social Services. Signed on 2002-06-12. Completion date: 2002-09-30.
WILLIAM H SADLIER, INC (9 PINE STREET) : $87,466 in 10 contractsfrom 2001 to 2005
Contracts for Books and Pamphlets, Chaplain Services by Army Signed by year:2000: $0; 2001: $9,345; 2002: $13,996; 2003: $17,068; 2004: $21,174; 2005: $25,883; 2006: $0.
Biggest contracts:
$14,395 with Army for Books and Pamphlets. Taking place in VA. Signed on 2005-04-07. Completion date: 2005-07-01.
$13,996, same as above.Signed on 2002-06-18. Completion date: 2002-07-01.
$13,879, same as above.Signed on 2004-08-25. Completion date: 2004-08-31.
$13,296, same as above.Signed on 2003-08-19. Completion date: 2004-08-01.
JUVENILE DIABETES RESEARCH FOU (120 WALL ST 19TH FL)
$25,000 with Army for Other Management Support Services. Signed on 2004-10-04. Completion date: 2004-12-31.
Top industries in this zip code by the number of employees in 2005:
Administrative and Support and Waste Management and Remediation Services: Security Guards and Patrol Services (250-499: 3, 100-249: 6, 50-99: 2, 10-19: 1, 1-4: 4)
Health Care and Social Assistance: Services for the Elderly and Persons with Disabilities (over 1000: 1, 100-249: 1, 20-49: 2)
Detailed PMIC statistics for the following Tracts:0007.00
, 0009.00
2007 - 2018 National Fire Incident Reporting System (NFIRS) incidents
According to the data from the years 2007 - 2018 the average number of fire incidents per year is 32. The highest number of reported fires - 45 took place in 2008, and the least - 16 in 2007. The data has a growing trend.
When looking into fire subcategories, the most reports belonged to: Structure Fires (67.0%), and Outside Fires (23.0%).
Fire incident types reported to NFIRS in Zip Code 10005

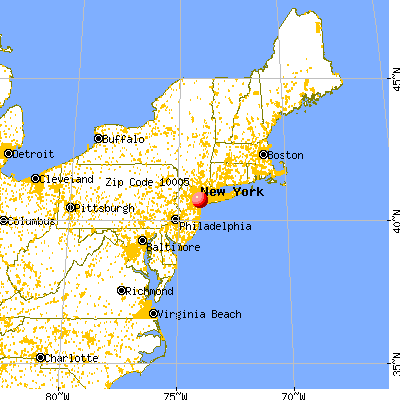


 Nearest zip codes: 10271, 10006, 10279, 10038, 10007, 10280.


 According to the data from the years 2007 - 2018 the average number of fire incidents per year is 32. The highest number of reported fires - 45 took place in 2008, and the least - 16 in 2007. The data has a growing trend.
 When looking into fire subcategories, the most reports belonged to: Structure Fires (67.0%), and Outside Fires (23.0%).