Estimated zip code population in 2022: 79,822 Zip code population in 2010: 80,018 Zip code population in 2000: 80,554
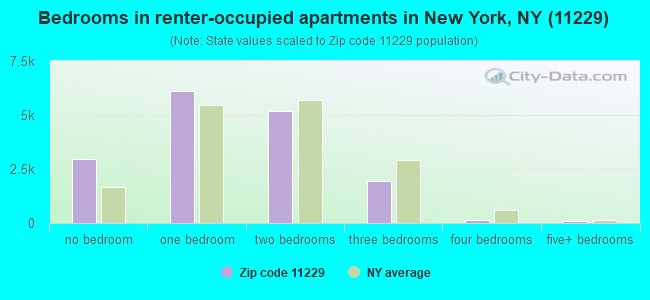
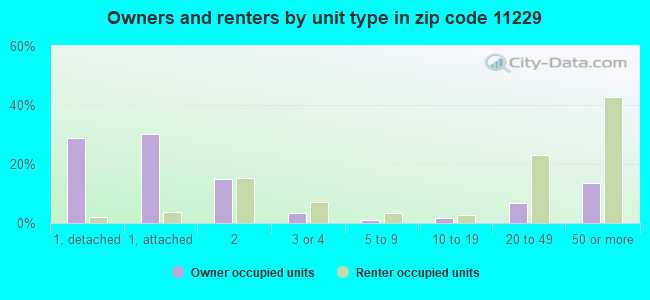
Houses and condos: 33,762 Renter-occupied apartments: 16,312
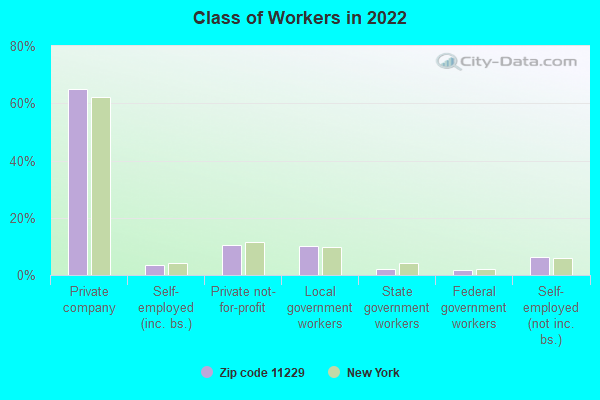
% of renters here:
52%
State:
46%
March 2022 cost of living index in zip code 11229: 154.6 (very high, U.S. average is 100)
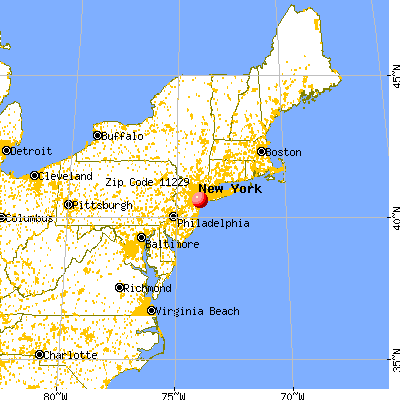
Land area: 2.2 sq. mi. Water area: 0.1 sq. mi.
Population density: 36,976 people per square mile
(very high).
OSM Map
General Map
Google Map
MSN Map
OSM Map
General Map
Google Map
MSN Map
OSM Map
General Map
Google Map
MSN Map
OSM Map
General Map
Google Map
MSN Map
Please wait while loading the map...
Real estate property taxes paid for housing units in 2022:
This zip code:
0.7% ($6,300)
New York:
1.5% ($6,180)
Median real estate property taxes paid for housing units with mortgages in 2022: $6,530 (0.7%) Median real estate property taxes paid for housing units with no mortgage in 2022: $6,078 (0.8%)
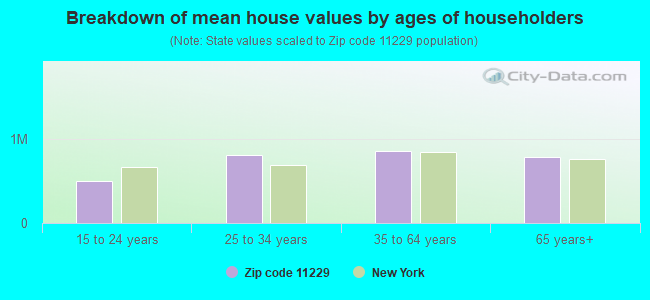
Estimated median house/condo value in 2022: $843,957
11229:
$843,957
New York:
$400,400
According to our research of New York and other state lists, there were 10 registered sex offenders living in 11229 zip code as of April 27, 2024. The ratio of all residents to sex offenders in zip code 11229 is 8,410 to 1. The ratio of registered sex offenders to all residents in this zip code is much lower than the state average.
Median resident age:
This zip code:
43.0 years
New York median age:
40.0 years
Average household size:
This zip code:
2.5 people
New York:
2.5 people
Averages for the 2020 tax year for zip code 11229, filed in 2021:
Average Adjusted Gross Income (AGI) in 2020: $65,524 (Individual Income Tax Returns)
Here:
$65,524
State:
$90,930
Salary/wage: $57,186 (reported on 76.7% of returns)
Here:
$57,186
State:
$72,104
(% of AGI for various income ranges: 954.2% for AGIs below $25k, 3399.8% for AGIs $25k-50k, 7132.2% for AGIs $50k-75k, 10667.0% for AGIs $75k-100k, 19337.9% for AGIs $100k-200k, 73768.6% for AGIs over 200k)
Taxable interest for individuals: $2,076 (reported on 31.5% of returns)
This zip code:
$2,076
New York:
$3,075
(% of AGI for various income ranges: 21.5% for AGIs below $25k, 30.3% for AGIs $25k-50k, 67.9% for AGIs $50k-75k, 95.9% for AGIs $75k-100k, 231.7% for AGIs $100k-200k, 2116.2% for AGIs over 200k)
Ordinary dividends: $4,192 (reported on 19.0% of returns)
Here:
$4,192
State:
$11,095
(% of AGI for various income ranges: 20.0% for AGIs below $25k, 33.1% for AGIs $25k-50k, 79.4% for AGIs $50k-75k, 135.5% for AGIs $75k-100k, 375.1% for AGIs $100k-200k, 2203.8% for AGIs over 200k)
Net capital gain/loss in AGI: +$13,264 (reported on 19.4% of returns)
Here:
+$13,264
State:
+$44,925
(% of AGI for various income ranges: 3.7% for AGIs below $25k, 33.0% for AGIs $25k-50k, 100.2% for AGIs $50k-75k, 122.7% for AGIs $75k-100k, 693.4% for AGIs $100k-200k, 14469.8% for AGIs over 200k)
Profit/loss from business: +$11,751 (reported on 21.6% of returns)
Here:
+$11,751
State:
+$14,940
(% of AGI for various income ranges: 276.9% for AGIs below $25k, 281.8% for AGIs $25k-50k, 245.2% for AGIs $50k-75k, 278.3% for AGIs $75k-100k, 602.9% for AGIs $100k-200k, 4676.6% for AGIs over 200k)
Taxable individual retirement arrangement distribution: $14,934 (reported on 5.2% of returns)
11229:
$14,934
New York:
$19,609
(% of AGI for various income ranges: 36.0% for AGIs below $25k, 39.9% for AGIs $25k-50k, 96.2% for AGIs $50k-75k, 155.5% for AGIs $75k-100k, 410.0% for AGIs $100k-200k, 1239.4% for AGIs over 200k)
Self-employed (Keogh) retirement plans: $35,520 (reported on 0.4% of returns)
11229:
$35,520
New York:
$32,497
(% of AGI for various income ranges: 9.3% for AGIs $50k-75k, 45.5% for AGIs $100k-200k, 752.6% for AGIs over 200k)
Total itemized deductions: $37,475 (reported on 9.5% of returns)
Here:
$37,475
State:
$39,326
(% of AGI for various income ranges: 42.4% for AGIs below $25k, 114.8% for AGIs $25k-50k, 342.5% for AGIs $50k-75k, 670.7% for AGIs $75k-100k, 1448.4% for AGIs $100k-200k, 12203.0% for AGIs over 200k)
Charity contributions: $15,854 (reported on 8.0% of returns)
Here:
$15,854
State:
$15,420
(% of AGI for various income ranges: 3.2% for AGIs below $25k, 12.2% for AGIs $25k-50k, 48.0% for AGIs $50k-75k, 105.0% for AGIs $75k-100k, 291.5% for AGIs $100k-200k, 7267.6% for AGIs over 200k)
Taxes paid: $9,175 (reported on 9.5% of returns)
11229:
$9,175
State:
$9,183
(% of AGI for various income ranges: 9.2% for AGIs below $25k, 29.2% for AGIs $25k-50k, 103.8% for AGIs $50k-75k, 238.0% for AGIs $75k-100k, 488.6% for AGIs $100k-200k, 1792.6% for AGIs over 200k)
Earned income credit: $2,107 (reported on 19.7% of returns)
Here:
$2,107
State:
$2,138
(% of AGI for various income ranges: 102.9% for AGIs below $25k, 101.9% for AGIs $25k-50k, 1.8% for AGIs $50k-75k)
Percentage of individuals using paid preparers for their 2020 taxes: 93.6%
Here:
94%
State:
95%
(% for various income ranges: 92.0% for AGIs below $25k, 94.7% for AGIs $25k-50k, 94.6% for AGIs $50k-75k, 93.8% for AGIs $75k-100k, 94.3% for AGIs $100k-200k, 95.8% for AGIs over 200k)
Averages for the 2012 tax year for zip code 11229, filed in 2013:
Average Adjusted Gross Income (AGI) in 2012: $54,225 (Individual Income Tax Returns)
Here:
$54,225
State:
$77,088
Salary/wage: $49,510 (reported on 79.6% of returns)
Here:
$49,510
State:
$60,593
(% of AGI for various income ranges: 67.0% for AGIs below $25k, 82.4% for AGIs $25k-50k, 81.9% for AGIs $50k-75k, 80.1% for AGIs $75k-100k, 77.7% for AGIs $100k-200k, 50.2% for AGIs over 200k)
Taxable interest for individuals: $1,825 (reported on 39.6% of returns)
This zip code:
$1,825
New York:
$3,125
(% of AGI for various income ranges: 1.3% for AGIs below $25k, 0.9% for AGIs $25k-50k, 1.0% for AGIs $50k-75k, 0.8% for AGIs $75k-100k, 1.0% for AGIs $100k-200k, 2.7% for AGIs over 200k)
Ordinary dividends: $3,742 (reported on 19.7% of returns)
Here:
$3,742
State:
$10,299
(% of AGI for various income ranges: 1.6% for AGIs below $25k, 0.9% for AGIs $25k-50k, 1.0% for AGIs $50k-75k, 1.3% for AGIs $75k-100k, 1.3% for AGIs $100k-200k, 1.9% for AGIs over 200k)
Net capital gain/loss in AGI: +$6,870 (reported on 16.5% of returns)
Here:
+$6,870
State:
+$42,474
(% of AGI for various income ranges: 0.1% for AGIs $75k-100k, 0.6% for AGIs $100k-200k, 9.7% for AGIs over 200k)
Profit/loss from business: +$12,671 (reported on 19.5% of returns)
Here:
+$12,671
State:
+$16,168
(% of AGI for various income ranges: 18.0% for AGIs below $25k, 4.5% for AGIs $25k-50k, 2.7% for AGIs $50k-75k, 1.6% for AGIs $75k-100k, 2.6% for AGIs $100k-200k, 4.5% for AGIs over 200k)
Taxable individual retirement arrangement distribution: $11,719 (reported on 7.1% of returns)
11229:
$11,719
New York:
$17,621
(% of AGI for various income ranges: 2.4% for AGIs below $25k, 1.5% for AGIs $25k-50k, 1.4% for AGIs $50k-75k, 1.7% for AGIs $75k-100k, 1.8% for AGIs $100k-200k, 0.9% for AGIs over 200k)
Self-employment retirement plans: $22,428 (reported on 0.5% of returns)
11229:
$22,428
New York:
$27,330
(% of AGI for various income ranges: 0.1% for AGIs $50k-75k, 0.2% for AGIs $100k-200k, 0.7% for AGIs over 200k)
Total itemized deductions: $29,091 (26% of AGI, reported on 32.6% of returns)
Here:
$29,091
State:
$34,985
Here:
26.4% of AGI
State:
21.3% of AGI
(% of AGI for various income ranges: 7.7% for AGIs below $25k, 11.1% for AGIs $25k-50k, 15.7% for AGIs $50k-75k, 19.3% for AGIs $75k-100k, 21.4% for AGIs $100k-200k, 21.5% for AGIs over 200k)
Charity contributions: $4,986 (reported on 28.2% of returns)
Here:
$4,986
State:
$5,572
(% of AGI for various income ranges: 0.5% for AGIs below $25k, 1.1% for AGIs $25k-50k, 1.6% for AGIs $50k-75k, 1.8% for AGIs $75k-100k, 2.5% for AGIs $100k-200k, 6.0% for AGIs over 200k)
Taxes paid: $12,548 (reported on 32.5% of returns)
11229:
$12,548
State:
$18,656
(% of AGI for various income ranges: 1.6% for AGIs below $25k, 3.0% for AGIs $25k-50k, 6.2% for AGIs $50k-75k, 7.8% for AGIs $75k-100k, 9.5% for AGIs $100k-200k, 11.5% for AGIs over 200k)
Earned income credit: $2,226 (reported on 23.2% of returns)
Here:
$2,226
State:
$2,230
(% of AGI for various income ranges: 8.3% for AGIs below $25k, 1.2% for AGIs $25k-50k)
Percentage of individuals using paid preparers for their 2012 taxes: 73.6%
Here:
74%
State:
66%
(% for various income ranges: 72.6% for AGIs below $25k, 72.4% for AGIs $25k-50k, 73.4% for AGIs $50k-75k, 76.1% for AGIs $75k-100k, 76.3% for AGIs $100k-200k, 81.5% for AGIs over 200k)
Averages for the 2004 tax year for zip code 11229, filed in 2005:
Average Adjusted Gross Income (AGI) in 2004: $44,567 (Individual Income Tax Returns)
Here:
$44,567
State:
$59,519
Salary/wage: $42,073 (reported on 79.5% of returns)
Here:
$42,073
State:
$50,673
(% of AGI for various income ranges: 109.4% for AGIs below $10k, 69.2% for AGIs $10k-25k, 83.9% for AGIs $25k-50k, 83.2% for AGIs $50k-75k, 81.7% for AGIs $75k-100k, 63.0% for AGIs over 100k)
Taxable interest for individuals: $1,677 (reported on 58.3% of returns)
This zip code:
$1,677
New York:
$2,377
(% of AGI for various income ranges: 11.2% for AGIs below $10k, 3.5% for AGIs $10k-25k, 2.0% for AGIs $25k-50k, 1.8% for AGIs $50k-75k, 1.9% for AGIs $75k-100k, 1.9% for AGIs over 100k)
Taxable dividends: $2,519 (reported on 26.0% of returns)
Here:
$2,519
State:
$5,394
(% of AGI for various income ranges: 6.0% for AGIs below $10k, 1.6% for AGIs $10k-25k, 1.1% for AGIs $25k-50k, 1.1% for AGIs $50k-75k, 1.2% for AGIs $75k-100k, 1.7% for AGIs over 100k)
Net capital gain/loss: +$5,496 (reported on 21.5% of returns)
Here:
+$5,496
State:
+$23,581
(% of AGI for various income ranges: -3.4% for AGIs below $10k, -0.3% for AGIs $10k-25k, -0.1% for AGIs $25k-50k, 0.3% for AGIs $50k-75k, 0.6% for AGIs $75k-100k, 7.3% for AGIs over 100k)
Profit/loss from business: +$11,272 (reported on 18.7% of returns)
Here:
+$11,272
State:
+$13,809
(% of AGI for various income ranges: 35.8% for AGIs below $10k, 12.8% for AGIs $10k-25k, 3.4% for AGIs $25k-50k, 2.3% for AGIs $50k-75k, 2.4% for AGIs $75k-100k, 4.5% for AGIs over 100k)
IRA payment deduction: $3,486 (reported on 5.3% of returns)
11229:
$3,486
New York:
$3,115
(% of AGI for various income ranges: 0.4% for AGIs below $10k, 0.5% for AGIs $10k-25k, 0.7% for AGIs $25k-50k, 0.5% for AGIs $50k-75k, 0.4% for AGIs $75k-100k, 0.2% for AGIs over 100k)
Self-employed pension: $13,684 (reported on 0.7% of returns)
Here:
$13,684
New York:
$19,016
(% of AGI for various income ranges: 0.0% for AGIs $10k-25k, 0.1% for AGIs $25k-50k, 0.1% for AGIs $50k-75k, 0.1% for AGIs $75k-100k, 0.5% for AGIs over 100k)
Total itemized deductions: $21,706 (25% of AGI, reported on 35.2% of returns)
Here:
$21,706
State:
$25,864
Here:
25.4% of AGI
State:
21.9% of AGI
(% of AGI for various income ranges: 9.4% for AGIs below $10k, 7.4% for AGIs $10k-25k, 13.2% for AGIs $25k-50k, 17.7% for AGIs $50k-75k, 18.8% for AGIs $75k-100k, 21.1% for AGIs over 100k)
Charity contributions deductions: $5,042 (6% of AGI, reported on 32.7% of returns)
Here:
$5,042
State:
$4,439
Here:
5.7% of AGI
State:
3.6% of AGI
(% of AGI for various income ranges: 0.7% for AGIs below $10k, 0.8% for AGIs $10k-25k, 2.0% for AGIs $25k-50k, 2.6% for AGIs $50k-75k, 2.8% for AGIs $75k-100k, 6.4% for AGIs over 100k)
Total tax: $6,731 (reported on 75.3% of returns)
11229:
$6,731
State:
$11,730
(% of AGI for various income ranges: 7.0% for AGIs below $10k, 4.5% for AGIs $10k-25k, 6.9% for AGIs $25k-50k, 9.6% for AGIs $50k-75k, 10.9% for AGIs $75k-100k, 16.8% for AGIs over 100k)
Earned income credit: $1,726 (reported on 19.3% of returns)
Here:
$1,726
State:
$1,757
Percentage of individuals using paid preparers for their 2004 taxes: 72.2%
Here:
72%
State:
67%
(% for various income ranges: 68.3% for AGIs below $10k, 73.9% for AGIs $10k-25k, 72.5% for AGIs $25k-50k, 71.2% for AGIs $50k-75k, 74.4% for AGIs $75k-100k, 76.0% for AGIs over 100k)
Likely homosexual households (counted as self-reported same-sex unmarried-partner households)
Lesbian couples: 0.1% of all households
Gay men: 0.0% of all households
Household received Food Stamps/SNAP in the past 12 months: 7,096 Household did not receive Food Stamps/SNAP in the past 12 months: 24,573
Women who had a birth in the past 12 months: 664 (570 now married, 87 unmarried) Women who did not have a birth in the past 12 months: 15,074 (6,821 now married, 8,187 unmarried)
Housing units in zip code 11229 with a mortgage: 7,161 (628 second mortgage, 64 home equity loan, 494 both second mortgage and home equity loan) Houses without a mortgage: 234
Median monthly owner costs for units with a mortgage: $2,949 Median monthly owner costs for units without a mortgage: $1,024
Residents with income below the poverty level in 2022:
This zip code:
16.2%
Whole state:
14.3%
Residents with income below 50% of the poverty level in 2022:
This zip code:
9.2%
Whole state:
6.8%
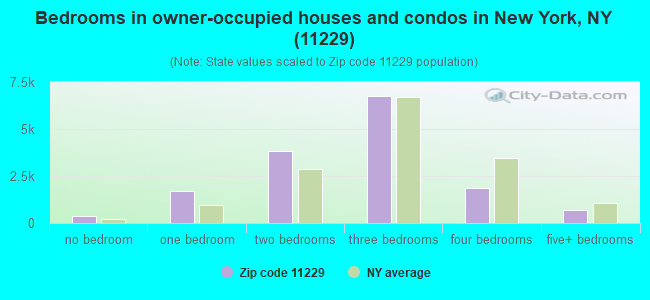
Median number of rooms in houses and condos:
Here:
5.3
State:
6.3
Median number of rooms in apartments:
Here:
3.3
State:
3.8
Notable locations in this zip code not listed on our city pages
Notable locations in zip code 11229: Covenant Ballet Theatre (A), Gerritsen Beach Branch Brooklyn Public Library (B), Kings Bay Branch Brooklyn Public Library (C), Fire Department New York Engine 276 Ladder 156 Battalion 33 (D), Fire Department New York Engine 321Brush Fire 6 Foam Unit 321 (E), New York Foam Company 87 (F), New York Ladder Company 156 (G). Display/hide their locations on the map
Churches in zip code 11229 include: First Baptist Church (A), Ocean Avenue Jewish Center (B), Kingdom Hall of Jehovah's Witnesses (C), Saint Edmund's Roman Catholic Church (D), Bethel Jewish Centre Synagogue (E), Homecrest Presbyterian Church (F), Saint Edmund's Convent (G), Temple Ahavath Sholom (H), Nachlath Zion Jewish Center (I). Display/hide their locations on the map
Parks in zip code 11229 include: Kelly Memorial Playground (1), Sergeant Joyce Kilmer Triangle (2), Corporal Wiltshire Triangle (3), Private First Class Thomas Norton Memorial Playground (4), Aimee Triangle (5), Mellett Playground (6), Galapo Playground (7), Herman Dolgon Playground (8). Display/hide their locations on the map
Tourist attraction (not listed on the city page) : Enrico Caruso Museum of America Inc (1942 East 19th Street).
11,789 married couples with children.
3,578 single-parent households (652 men, 2,926 women).
40.7% of residents of 11229 zip code speak English at home.
5.8% of residents speak Spanish at home (51% very well, 26% well, 17% not well, 7% not at all).
27.7% of residents speak other Indo-European language at home (45% very well, 33% well, 17% not well, 4% not at all).
21.4% of residents speak Asian or Pacific Island language at home (37% very well, 22% well, 25% not well, 17% not at all).
4.9% of residents speak other language at home (58% very well, 31% well, 10% not well, 1% not at all).
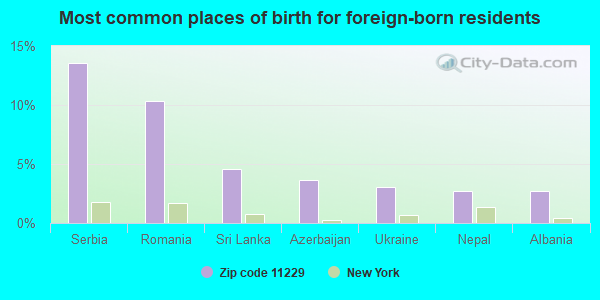
Foreign born population: 37,764 (47.3%) (71.4% of them are naturalized citizens)
This zip code:
47.3%
Whole state:
22.7%
14%Serbia
10%Romania
5%Sri Lanka
4%Azerbaijan
3%Ukraine
3%Nepal
3%Albania
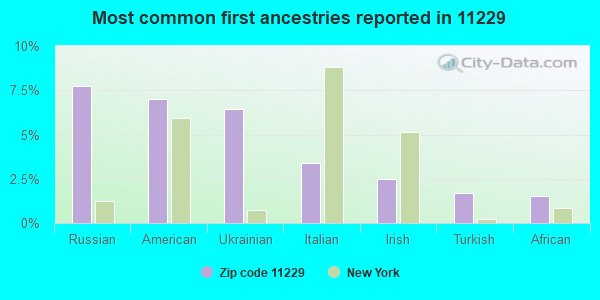
8%Russian
7%American
6%Ukrainian
3%Italian
2%Irish
2%Turkish
2%African
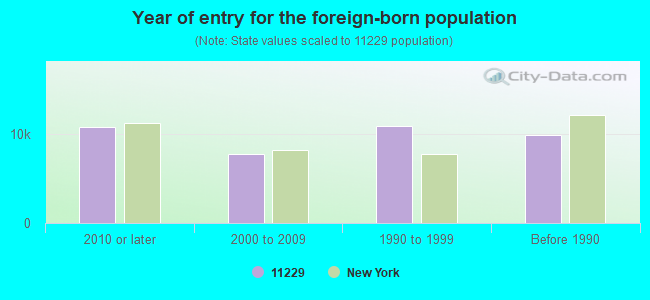
Year of entry for the foreign-born population
10,8252010 or later
7,7652000 to 2009
10,9401990 to 1999
9,894Before 1990
Major facilities with environmental interests located in this zip code:
ALMORT CLEANERS (1317 AVE U in BROOKLYN, NY)
AIR MINOR (AIRS/AFS) STATE MASTER (New York facility tracking) - HAZARDOUS WASTE PROGRAM (Resource Conservation and Recovery Act (tracking hazardous waste)) Business SIC classification: DRYCLEANING PLANTS, EXCEPT RUG CLEANING Business NAICS classification: DRYCLEANING AND LAUNDRY SERVICES (EXCEPT COIN-OPERATED). Organizations: MYUNG JA LEE (AIR COMPLIANCE CONTACT)
CLEAN O RAMA (3480 NOSTRAND AVE in BROOKLYN, NY)
AIR MINOR (AIRS/AFS) STATE MASTER (New York facility tracking) - AIR PROGRAM Small Quantity Generators, between 100 kg and 1000 kg of hazardous waste/month (Resource Conservation and Recovery Act (tracking hazardous waste)) - notification Business SIC classification: DRYCLEANING PLANTS, EXCEPT RUG CLEANING Business NAICS classification: DRYCLEANING AND LAUNDRY SERVICES (EXCEPT COIN-OPERATED). Organizations: HELENE TOBIN (CONTACT/OWNER)
, KING OF KLEAN DRIVE INC (LEGALLY RESPONSIBLE PARTY)
, CLEAN-O-RAMA INC (LEGALLY RESPONSIBLE PARTY)
, BEAARO INC (LEGALLY RESPONSIBLE PARTY)
ABIC LAUNDROMAT & DRY CLEANING (2166 COYLE ST in BROOKLYN, NY)
AIR MINOR (AIRS/AFS) STATE MASTER (New York facility tracking) - AIR PROGRAM, HAZARDOUS WASTE PROGRAM (Resource Conservation and Recovery Act (tracking hazardous waste)) Business SIC classification: DRYCLEANING PLANTS, EXCEPT RUG CLEANING Business NAICS classification: DRYCLEANING AND LAUNDRY SERVICES (EXCEPT COIN-OPERATED). Organizations: CLOTHES CARE (LEGALLY RESPONSIBLE PARTY)
Alternative names: CLOTHES CARE, COYLE LAUNDROMAT & DRY CLEANING
AMOCO-55130063005 (4100 AVENUE U in BROOKLYN, NY)
AIR MINOR (AIRS/AFS) STATE MASTER (New York facility tracking) - AIR PROGRAM, (Resource Conservation and Recovery Act (tracking hazardous waste)) Business SIC classification: GASOLINE SERVICE STATIONS Organizations: AMOCO OIL CO (LEGALLY RESPONSIBLE PARTY)
Alternative names: KERENS SERVICE STATION
HELEN S CLEANERS (3598 NOSTRAND AVENUE in BROOKLYN, NY)
AIR MINOR (AIRS/AFS) STATE MASTER (New York facility tracking) - AIR PROGRAM Small Quantity Generators, between 100 kg and 1000 kg of hazardous waste/month (Resource Conservation and Recovery Act (tracking hazardous waste)) - notification Business SIC classification: DRYCLEANING PLANTS, EXCEPT RUG CLEANING; LAUNDRY AND GARMENT SERVICES Business NAICS classification: DRYCLEANING AND LAUNDRY SERVICES (EXCEPT COIN-OPERATED). Organizations: HELENS CLEANERS (CONTACT/OWNER)
, 3598 HELEN CLEANER CORP (LEGALLY RESPONSIBLE PARTY)
, GOLDEN RUG & LEATHER CLEANERS INC (LEGALLY RESPONSIBLE PARTY)
Alternative names: HELEN'S CLEANERS
IDEAL CLEANERS (1922 KINGS HIGHWAY in BROOKLYN, NY)
AIR MINOR (AIRS/AFS) STATE MASTER (New York facility tracking) - AIR PROGRAM Small Quantity Generators, between 100 kg and 1000 kg of hazardous waste/month (Resource Conservation and Recovery Act (tracking hazardous waste)) - notification Business SIC classification: DRYCLEANING PLANTS, EXCEPT RUG CLEANING Business NAICS classification: DRYCLEANING AND LAUNDRY SERVICES (EXCEPT COIN-OPERATED). Organizations: JOY LEE CLEANERS INC (CONTACT/OWNER)
, MINT MAKERS INC (LEGALLY RESPONSIBLE PARTY)
Alternative names: DUTCH GIRL CLEANERS, JOY LEE CLEANERS INC DBA DUTCH GIRL CLNR, joy lee cleaners incorporated DUTCH GIRL CLEANERS
CHUN S LAUNDROMAT & DRY CLEANERS (2948 AVENUE R in BROOKLYN, NY)
AIR MINOR (AIRS/AFS) STATE MASTER (New York facility tracking) - AIR PROGRAM Small Quantity Generators, between 100 kg and 1000 kg of hazardous waste/month (Resource Conservation and Recovery Act (tracking hazardous waste)) - notification Business SIC classification: DRYCLEANING PLANTS, EXCEPT RUG CLEANING Business NAICS classification: DRYCLEANING AND LAUNDRY SERVICES (EXCEPT COIN-OPERATED). Organizations: KUN SHAN CHUN (CONTACT/OWNER)
, CHUN S LAUNDROMAT & DRY CLEANERS INC (LEGALLY RESPONSIBLE PARTY)
Alternative names: CHUNS LAUND & DRY CLEANERS INC, LEUNG'S CLEANERS
3380 NOSTRAND AVENUE BUILDING (3380 NOSTRAND AVE in BROOKLYN, NY)
STATE MASTER (New York facility tracking) - AIR PROGRAM ENFORCEMENT/COMPLIANCE ACTIVITY (Integrated Compliance Information System) Business SIC classification: OPERATORS OF APARTMENT BUILDINGS Business NAICS classification: LESSORS OF RESIDENTIAL BUILDINGS AND DWELLINGS. Organizations: RESIDENTIAL MANAGEMENT (AIR PERMITTING FACILITY OWNER CONTACT)
Alternative names: RESIDENTIAL MANAGEMENT-3380 NOSTRAND AVE
BETH JACOB OF FLATBUSH (1981 HOMECREST AVE in BROOKLYN, NY)
(Integrated Compliance Information System) - ICIS-02-1991-0034, FORMAL ENFORCEMENT ACTION COMPLIANCE ACTIVITY (Tracking inspections of insecticide, fungicide, and rodenticide, and toxic substances) Business SIC classification: ELEMENTARY AND SECONDARY SCHOOLS; RELIGIOUS ORGANIZATIONS
IS 234 W. A. CUNNINGHAM IS ( in BROOKLYN, NY)
(National Center for Education Statistics) - STATE ID-332200010234 Organizations: NEW YORK CITY PUBLIC SCHOOLS (SCHOOL DISTRICT)
IS 278 MARINE PARK IS ( in BROOKLYN, NY)
(National Center for Education Statistics) - STATE ID-332200010278 Organizations: NEW YORK CITY PUBLIC SCHOOLS (SCHOOL DISTRICT)
AMOCO SVCE STA #2471 (2563 OCEAN AVE & AVE U in BROOKLYN, NY)
AIR MINOR (AIRS/AFS) (Resource Conservation and Recovery Act (tracking hazardous waste)) Business SIC classification: GASOLINE SERVICE STATIONS Alternative names: AMOCO SERVICE STATION #2471
CON EDISON - MH 3623 (NOSTRAND AVE in BROOKLYN, NY)
Large Quantity Generators, more that 1000 kg of hazardous waste/month (Resource Conservation and Recovery Act (tracking hazardous waste)) Organizations: CONSOLIDATED EDISON COMPANY OF NY, INC. (CONTACT/OPERATOR)
Housing units lacking complete plumbing facilities: 0.5% Housing units lacking complete kitchen facilities: 1.3%
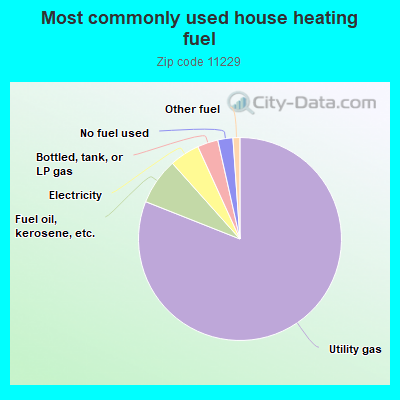
81.0%Utility gas
7.4%Fuel oil, kerosene, etc.
4.8%Electricity
3.3%Bottled, tank, or LP gas
2.4%No fuel used
1.1%Other fuel
Population in 1990: 72,660. Population change in the 1990s: +7,894 (+10.9%).
Place of birth for U.S.-born residents:
This state: 36,872
Northeast: 959
Midwest: 536
South: 1,386
West: 598
72% of the 11229 zip code residents lived in the same house 5 years ago. Out of people who lived in different houses, 86% lived in this county. Out of people who lived in different counties, 50% lived in New York.
94% of the 11229 zip code residents lived in the same house 1 year ago. Out of people who lived in different houses, 67% moved from this county. Out of people who lived in different houses, 14% moved from different county within same state. Out of people who lived in different houses, 6% moved from different state. Out of people who lived in different houses, 12% moved from abroad.
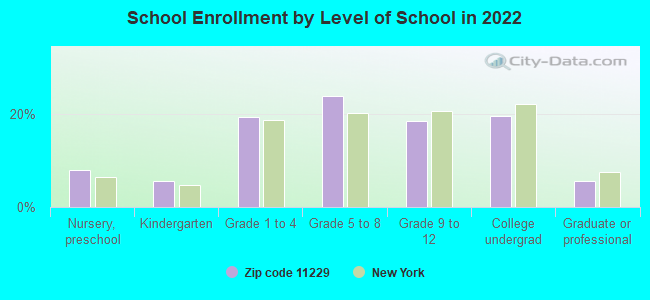
Private vs. public school enrollment:
Students in private schools in grades 1 to 8 (elementary and middle school): 2,339
Here:
28.7%
New York:
15.6%
Students in private schools in grades 9 to 12 (high school): 1,214
Here:
34.8%
New York:
15.0%
Students in private undergraduate colleges: 1,080
Here:
29.6%
New York:
39.2%
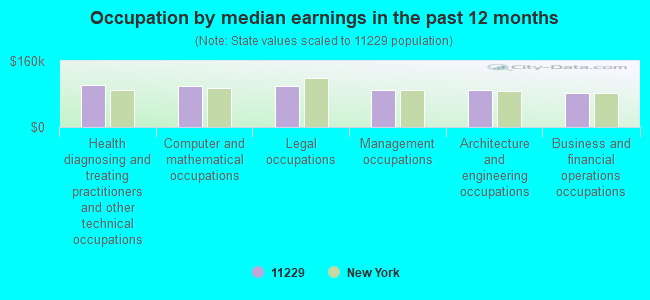
Occupation by median earnings in the past 12 months ($)
101,312Health diagnosing and treating practitioners and other technical occupations
99,859Computer and mathematical occupations
98,542Legal occupations
90,189Management occupations
88,902Architecture and engineering occupations
83,346Business and financial operations occupations
Companies with federal contracts located in this zip code (BROOKLYN, NY):
AURORA BROWN (31 LEFFERTS PL; small business) : $348,048 in 8 contractsfrom 2004 to 2006
Contracts for Custodial Janitorial Services by Army Signed by year:2000: $0; 2001: $0; 2002: $0; 2003: $0; 2004: $38,947; 2005: $138,242; 2006: $170,859.
Biggest contracts:
$88,307 with Army for Custodial Janitorial Services. Signed on 2006-03-08. Completion date: 2007-04-30.
$85,734, same as above.Signed on 2005-05-01. Completion date: 2006-04-30.
$82,552, same as above.Signed on 2006-02-24. Completion date: 2007-04-30.
$78,199, same as above.Signed on 2005-04-01. Completion date: 2006-04-30.
MARINE PARK CAMERA AND VIDEO I (3126 AVENUE U; small business) : $15,337 in 2 contractsfrom 2002 to 2004
$11,299 with Army for Video Recording and Reproducing Equipment. Taking place in AZ. Signed on 2004-05-13. Completion date: 2004-06-12.
$4,038 with Army for ADP Central Processing Unit (CPU, Computer), Analog. Taking place in SD. Signed on 2002-02-07. Completion date: 2002-03-01.
888 DIGITAL INC (3674 NOSTRAND AVE; small business)
$8,100 with Army for Cameras, Still Picture. Taking place in WA. Signed on 2002-09-05. Completion date: 2002-09-16.
LORI''S TROPHY AND SPORTING GO (3024 AVE U; small business) : $6,470 in 2 contractsin 2003
$3,445 with Army for Signs, Advertising Displays, and Identification Plates. Signed on 2003-11-24. Completion date: 2003-12-03.
$3,025, same as above.Signed on 2003-12-04. Completion date: 2003-12-03.
Top industries in this zip code by the number of employees in 2005:
Health Care and Social Assistance: Services for the Elderly and Persons with Disabilities (over 1000 employees: 1 establishment, 100-249 employees: 1 establishment, 10-19 employees: 2 establishments, 1-4 employees: 2 establishments)
Health Care and Social Assistance: Offices of Physicians (except Mental Health Specialists) (100-249: 1, 50-99: 2, 20-49: 5, 10-19: 9, 5-9: 39, 1-4: 78)
Health Care and Social Assistance: General Medical and Surgical Hospitals (500-999: 1)
Health Care and Social Assistance: Offices of Dentists (10-19: 6, 5-9: 30, 1-4: 49)
Other Services (except Public Administration): Religious Organizations (100-249: 1, 50-99: 1, 20-49: 2, 10-19: 4, 5-9: 1, 1-4: 14)
2007 - 2018 National Fire Incident Reporting System (NFIRS) incidents
According to the data from the years 2007 - 2018 the average number of fires per year is 280. The highest number of reported fires - 326 took place in 2010, and the least - 250 in 2016. The data has a decreasing trend.
When looking into fire subcategories, the most reports belonged to: Structure Fires (65.0%), and Outside Fires (26.3%).
Fire incident types reported to NFIRS in Zip Code 11229


 Nearest zip codes: 11235, 11210, 11223, 11230, 11234, 11204.


 According to the data from the years 2007 - 2018 the average number of fires per year is 280. The highest number of reported fires - 326 took place in 2010, and the least - 250 in 2016. The data has a decreasing trend.
 When looking into fire subcategories, the most reports belonged to: Structure Fires (65.0%), and Outside Fires (26.3%).