Estimated zip code population in 2022: 81,751 Zip code population in 2010: 79,132 Zip code population in 2000: 77,451
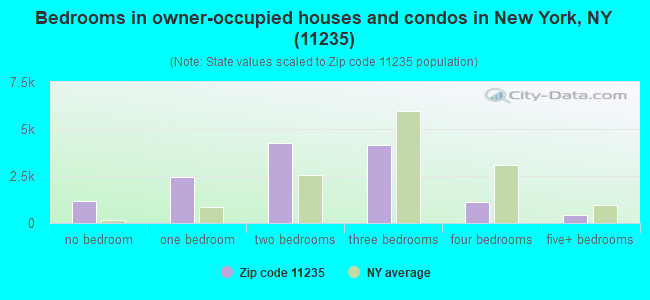
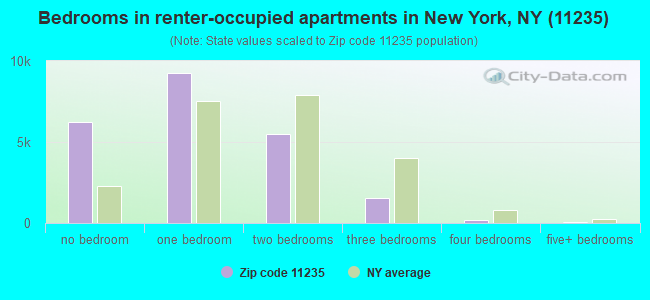
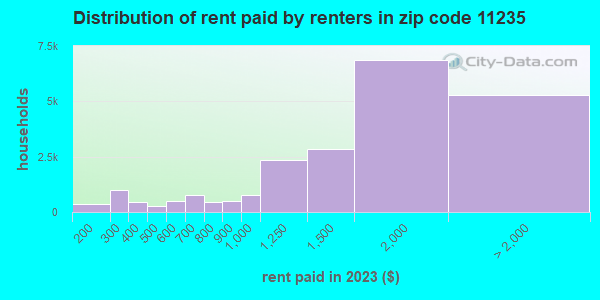
Houses and condos: 37,281 Renter-occupied apartments: 22,276
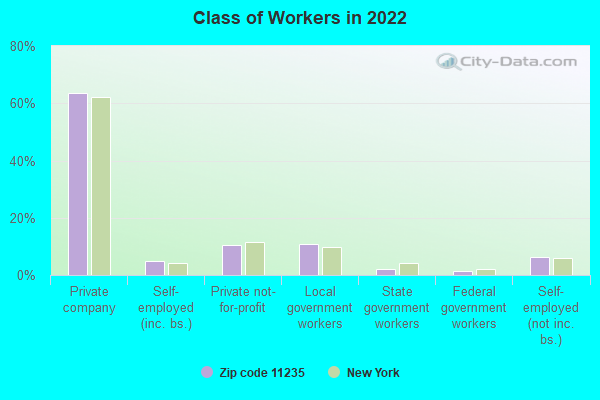
% of renters here:
63%
State:
46%
March 2022 cost of living index in zip code 11235: 155.9 (very high, U.S. average is 100)
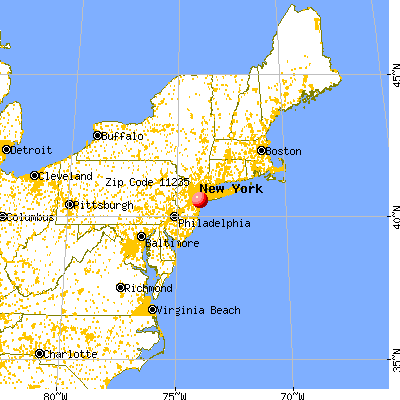
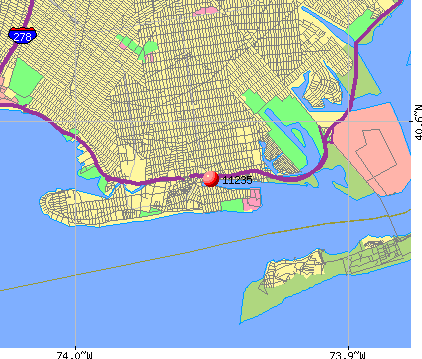
Land area: 2.2 sq. mi. Water area: 0.2 sq. mi.
Population density: 36,393 people per square mile
(very high).
OSM Map
General Map
Google Map
MSN Map
OSM Map
General Map
Google Map
MSN Map
OSM Map
General Map
Google Map
MSN Map
OSM Map
General Map
Google Map
MSN Map
Please wait while loading the map...
Real estate property taxes paid for housing units in 2022:
This zip code:
0.8% ($6,048)
New York:
1.5% ($6,180)
Median real estate property taxes paid for housing units with mortgages in 2022: $6,114 (0.7%) Median real estate property taxes paid for housing units with no mortgage in 2022: $5,981 (0.9%)
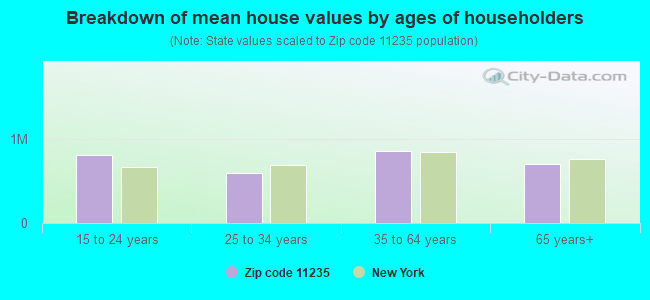
Estimated median house/condo value in 2022: $758,060
11235:
$758,060
New York:
$400,400
According to our research of New York and other state lists, there were 20 registered sex offenders living in 11235 zip code as of April 26, 2024. The ratio of all residents to sex offenders in zip code 11235 is 3,968 to 1. The ratio of registered sex offenders to all residents in this zip code is much lower than the state average.
Median resident age:
This zip code:
47.5 years
New York median age:
40.0 years
Average household size:
This zip code:
2.3 people
New York:
2.5 people
Averages for the 2020 tax year for zip code 11235, filed in 2021:
Average Adjusted Gross Income (AGI) in 2020: $64,062 (Individual Income Tax Returns)
Here:
$64,062
State:
$90,930
Salary/wage: $59,816 (reported on 73.4% of returns)
Here:
$59,816
State:
$72,104
(% of AGI for various income ranges: 915.9% for AGIs below $25k, 3481.9% for AGIs $25k-50k, 7587.1% for AGIs $50k-75k, 12011.4% for AGIs $75k-100k, 21051.3% for AGIs $100k-200k, 98359.3% for AGIs over 200k)
Taxable interest for individuals: $2,086 (reported on 28.1% of returns)
This zip code:
$2,086
New York:
$3,075
(% of AGI for various income ranges: 26.1% for AGIs below $25k, 24.2% for AGIs $25k-50k, 64.8% for AGIs $50k-75k, 114.7% for AGIs $75k-100k, 264.8% for AGIs $100k-200k, 2045.3% for AGIs over 200k)
Ordinary dividends: $5,603 (reported on 14.9% of returns)
Here:
$5,603
State:
$11,095
(% of AGI for various income ranges: 20.9% for AGIs below $25k, 26.4% for AGIs $25k-50k, 69.3% for AGIs $50k-75k, 131.1% for AGIs $75k-100k, 303.1% for AGIs $100k-200k, 4173.0% for AGIs over 200k)
Net capital gain/loss in AGI: +$11,226 (reported on 17.2% of returns)
Here:
+$11,226
State:
+$44,925
(% of AGI for various income ranges: 5.3% for AGIs below $25k, 18.1% for AGIs $25k-50k, 60.8% for AGIs $50k-75k, 155.0% for AGIs $75k-100k, 553.3% for AGIs $100k-200k, 13760.7% for AGIs over 200k)
Profit/loss from business: +$10,900 (reported on 26.7% of returns)
Here:
+$10,900
State:
+$14,940
(% of AGI for various income ranges: 420.9% for AGIs below $25k, 342.2% for AGIs $25k-50k, 252.0% for AGIs $50k-75k, 305.8% for AGIs $75k-100k, 523.0% for AGIs $100k-200k, 6870.5% for AGIs over 200k)
Taxable individual retirement arrangement distribution: $14,622 (reported on 5.0% of returns)
11235:
$14,622
New York:
$19,609
(% of AGI for various income ranges: 38.5% for AGIs below $25k, 56.7% for AGIs $25k-50k, 94.2% for AGIs $50k-75k, 170.4% for AGIs $75k-100k, 300.4% for AGIs $100k-200k, 1934.2% for AGIs over 200k)
Self-employed (Keogh) retirement plans: $25,906 (reported on 0.4% of returns)
11235:
$25,906
New York:
$32,497
(% of AGI for various income ranges: 12.4% for AGIs $50k-75k, 31.7% for AGIs $100k-200k, 666.0% for AGIs over 200k)
Total itemized deductions: $31,514 (reported on 7.8% of returns)
Here:
$31,514
State:
$39,326
(% of AGI for various income ranges: 40.1% for AGIs below $25k, 99.1% for AGIs $25k-50k, 276.6% for AGIs $50k-75k, 572.7% for AGIs $75k-100k, 1336.7% for AGIs $100k-200k, 8146.5% for AGIs over 200k)
Charity contributions: $7,774 (reported on 6.4% of returns)
Here:
$7,774
State:
$15,420
(% of AGI for various income ranges: 1.7% for AGIs below $25k, 9.1% for AGIs $25k-50k, 36.7% for AGIs $50k-75k, 83.8% for AGIs $75k-100k, 213.2% for AGIs $100k-200k, 2658.1% for AGIs over 200k)
Taxes paid: $8,940 (reported on 7.8% of returns)
11235:
$8,940
State:
$9,183
(% of AGI for various income ranges: 8.6% for AGIs below $25k, 26.1% for AGIs $25k-50k, 87.8% for AGIs $50k-75k, 211.0% for AGIs $75k-100k, 444.4% for AGIs $100k-200k, 1674.9% for AGIs over 200k)
Earned income credit: $1,990 (reported on 18.8% of returns)
Here:
$1,990
State:
$2,138
(% of AGI for various income ranges: 100.6% for AGIs below $25k, 90.0% for AGIs $25k-50k, 1.3% for AGIs $50k-75k)
Percentage of individuals using paid preparers for their 2020 taxes: 92.7%
Here:
93%
State:
95%
(% for various income ranges: 90.6% for AGIs below $25k, 93.0% for AGIs $25k-50k, 93.7% for AGIs $50k-75k, 94.2% for AGIs $75k-100k, 95.1% for AGIs $100k-200k, 97.0% for AGIs over 200k)
Averages for the 2012 tax year for zip code 11235, filed in 2013:
Average Adjusted Gross Income (AGI) in 2012: $52,018 (Individual Income Tax Returns)
Here:
$52,018
State:
$77,088
Salary/wage: $50,685 (reported on 76.1% of returns)
Here:
$50,685
State:
$60,593
(% of AGI for various income ranges: 62.0% for AGIs below $25k, 83.4% for AGIs $25k-50k, 83.7% for AGIs $50k-75k, 82.9% for AGIs $75k-100k, 80.2% for AGIs $100k-200k, 55.4% for AGIs over 200k)
Taxable interest for individuals: $1,932 (reported on 35.9% of returns)
This zip code:
$1,932
New York:
$3,125
(% of AGI for various income ranges: 1.7% for AGIs below $25k, 1.0% for AGIs $25k-50k, 1.0% for AGIs $50k-75k, 0.9% for AGIs $75k-100k, 1.0% for AGIs $100k-200k, 2.2% for AGIs over 200k)
Ordinary dividends: $4,557 (reported on 16.0% of returns)
Here:
$4,557
State:
$10,299
(% of AGI for various income ranges: 1.2% for AGIs below $25k, 0.9% for AGIs $25k-50k, 1.0% for AGIs $50k-75k, 1.0% for AGIs $75k-100k, 1.2% for AGIs $100k-200k, 2.6% for AGIs over 200k)
Net capital gain/loss in AGI: +$9,878 (reported on 14.7% of returns)
Here:
+$9,878
State:
+$42,474
(% of AGI for various income ranges: 0.7% for AGIs $100k-200k, 11.8% for AGIs over 200k)
Profit/loss from business: +$12,022 (reported on 24.6% of returns)
Here:
+$12,022
State:
+$16,168
(% of AGI for various income ranges: 24.8% for AGIs below $25k, 5.3% for AGIs $25k-50k, 2.3% for AGIs $50k-75k, 2.1% for AGIs $75k-100k, 2.5% for AGIs $100k-200k, 5.1% for AGIs over 200k)
Taxable individual retirement arrangement distribution: $11,625 (reported on 6.7% of returns)
11235:
$11,625
New York:
$17,621
(% of AGI for various income ranges: 2.3% for AGIs below $25k, 1.4% for AGIs $25k-50k, 1.5% for AGIs $50k-75k, 1.3% for AGIs $75k-100k, 1.5% for AGIs $100k-200k, 1.2% for AGIs over 200k)
Self-employment retirement plans: $18,312 (reported on 0.5% of returns)
11235:
$18,312
New York:
$27,330
(% of AGI for various income ranges: 0.2% for AGIs $50k-75k, 0.1% for AGIs $100k-200k, 0.4% for AGIs over 200k)
Total itemized deductions: $31,475 (29% of AGI, reported on 31.3% of returns)
Here:
$31,475
State:
$34,985
Here:
28.8% of AGI
State:
21.3% of AGI
(% of AGI for various income ranges: 10.1% for AGIs below $25k, 13.4% for AGIs $25k-50k, 17.8% for AGIs $50k-75k, 19.9% for AGIs $75k-100k, 23.3% for AGIs $100k-200k, 22.3% for AGIs over 200k)
Charity contributions: $2,882 (reported on 25.8% of returns)
Here:
$2,882
State:
$5,572
(% of AGI for various income ranges: 0.3% for AGIs below $25k, 1.0% for AGIs $25k-50k, 1.5% for AGIs $50k-75k, 1.6% for AGIs $75k-100k, 1.5% for AGIs $100k-200k, 2.0% for AGIs over 200k)
Taxes paid: $12,895 (reported on 31.2% of returns)
11235:
$12,895
State:
$18,656
(% of AGI for various income ranges: 1.7% for AGIs below $25k, 3.3% for AGIs $25k-50k, 5.9% for AGIs $50k-75k, 7.9% for AGIs $75k-100k, 9.6% for AGIs $100k-200k, 12.6% for AGIs over 200k)
Earned income credit: $1,991 (reported on 23.5% of returns)
Here:
$1,991
State:
$2,230
(% of AGI for various income ranges: 7.5% for AGIs below $25k, 1.0% for AGIs $25k-50k)
Percentage of individuals using paid preparers for their 2012 taxes: 75.1%
Here:
75%
State:
66%
(% for various income ranges: 73.1% for AGIs below $25k, 73.9% for AGIs $25k-50k, 76.3% for AGIs $50k-75k, 78.7% for AGIs $75k-100k, 79.6% for AGIs $100k-200k, 85.6% for AGIs over 200k)
Averages for the 2004 tax year for zip code 11235, filed in 2005:
Average Adjusted Gross Income (AGI) in 2004: $43,410 (Individual Income Tax Returns)
Here:
$43,410
State:
$59,519
Salary/wage: $41,647 (reported on 77.2% of returns)
Here:
$41,647
State:
$50,673
(% of AGI for various income ranges: 90.6% for AGIs below $10k, 68.5% for AGIs $10k-25k, 85.9% for AGIs $25k-50k, 82.6% for AGIs $50k-75k, 82.3% for AGIs $75k-100k, 60.5% for AGIs over 100k)
Taxable interest for individuals: $2,016 (reported on 54.8% of returns)
This zip code:
$2,016
New York:
$2,377
(% of AGI for various income ranges: 12.1% for AGIs below $10k, 4.2% for AGIs $10k-25k, 2.0% for AGIs $25k-50k, 2.4% for AGIs $50k-75k, 1.9% for AGIs $75k-100k, 2.2% for AGIs over 100k)
Taxable dividends: $3,022 (reported on 22.3% of returns)
Here:
$3,022
State:
$5,394
(% of AGI for various income ranges: 4.5% for AGIs below $10k, 1.4% for AGIs $10k-25k, 1.0% for AGIs $25k-50k, 1.2% for AGIs $50k-75k, 1.3% for AGIs $75k-100k, 2.0% for AGIs over 100k)
Net capital gain/loss: +$7,500 (reported on 19.9% of returns)
Here:
+$7,500
State:
+$23,581
(% of AGI for various income ranges: -2.7% for AGIs below $10k, -0.2% for AGIs $10k-25k, -0.2% for AGIs $25k-50k, 0.2% for AGIs $50k-75k, 0.9% for AGIs $75k-100k, 9.4% for AGIs over 100k)
Profit/loss from business: +$10,523 (reported on 23.3% of returns)
Here:
+$10,523
State:
+$13,809
(% of AGI for various income ranges: 45.6% for AGIs below $10k, 15.0% for AGIs $10k-25k, 3.9% for AGIs $25k-50k, 2.6% for AGIs $50k-75k, 2.9% for AGIs $75k-100k, 4.8% for AGIs over 100k)
IRA payment deduction: $3,404 (reported on 5.8% of returns)
11235:
$3,404
New York:
$3,115
(% of AGI for various income ranges: 0.5% for AGIs below $10k, 0.6% for AGIs $10k-25k, 0.8% for AGIs $25k-50k, 0.5% for AGIs $50k-75k, 0.4% for AGIs $75k-100k, 0.2% for AGIs over 100k)
Self-employed pension: $14,981 (reported on 0.8% of returns)
Here:
$14,981
New York:
$19,016
(% of AGI for various income ranges: 0.0% for AGIs $10k-25k, 0.1% for AGIs $25k-50k, 0.1% for AGIs $50k-75k, 0.2% for AGIs $75k-100k, 0.6% for AGIs over 100k)
Total itemized deductions: $20,973 (24% of AGI, reported on 32.6% of returns)
Here:
$20,973
State:
$25,864
Here:
23.9% of AGI
State:
21.9% of AGI
(% of AGI for various income ranges: 8.3% for AGIs below $10k, 8.6% for AGIs $10k-25k, 12.7% for AGIs $25k-50k, 16.7% for AGIs $50k-75k, 18.5% for AGIs $75k-100k, 18.3% for AGIs over 100k)
Charity contributions deductions: $3,240 (4% of AGI, reported on 29.3% of returns)
Here:
$3,240
State:
$4,439
Here:
3.6% of AGI
State:
3.6% of AGI
(% of AGI for various income ranges: 0.5% for AGIs below $10k, 0.8% for AGIs $10k-25k, 1.6% for AGIs $25k-50k, 2.3% for AGIs $50k-75k, 2.2% for AGIs $75k-100k, 2.9% for AGIs over 100k)
Total tax: $6,936 (reported on 77.0% of returns)
11235:
$6,936
State:
$11,730
(% of AGI for various income ranges: 8.2% for AGIs below $10k, 4.9% for AGIs $10k-25k, 7.3% for AGIs $25k-50k, 10.2% for AGIs $50k-75k, 11.5% for AGIs $75k-100k, 18.8% for AGIs over 100k)
Earned income credit: $1,536 (reported on 19.7% of returns)
Here:
$1,536
State:
$1,757
Percentage of individuals using paid preparers for their 2004 taxes: 72.5%
Here:
72%
State:
67%
(% for various income ranges: 68.4% for AGIs below $10k, 73.2% for AGIs $10k-25k, 72.0% for AGIs $25k-50k, 74.7% for AGIs $50k-75k, 75.0% for AGIs $75k-100k, 77.8% for AGIs over 100k)
Likely homosexual households (counted as self-reported same-sex unmarried-partner households)
Lesbian couples: 0.2% of all households
Gay men: 0.1% of all households
Household received Food Stamps/SNAP in the past 12 months: 9,032 Household did not receive Food Stamps/SNAP in the past 12 months: 26,894
Women who had a birth in the past 12 months: 904 (824 now married, 69 unmarried) Women who did not have a birth in the past 12 months: 15,371 (7,370 now married, 7,914 unmarried)
Housing units in zip code 11235 with a mortgage: 6,079 (578 second mortgage, 5 home equity loan, 570 both second mortgage and home equity loan) Houses without a mortgage: 110
Median monthly owner costs for units with a mortgage: $2,876 Median monthly owner costs for units without a mortgage: $908
Residents with income below the poverty level in 2022:
This zip code:
17.1%
Whole state:
14.3%
Residents with income below 50% of the poverty level in 2022:
This zip code:
10.6%
Whole state:
6.8%
Median number of rooms in houses and condos:
Here:
4.1
State:
6.3
Median number of rooms in apartments:
Here:
3.0
State:
3.8
Notable locations in this zip code not listed on our city pages
Notable locations in zip code 11235: Brooklyn Yacht Club (A), Gerald H Chambers Square (B), Bill Brown Square (C), Sheepshead Sub-Station New York Transit System (D), Dock Number 4 (E), Dock Number 5 (F), Dock Number 6 (G), Dock Number 7 (H), Dock Number 8 (I), Dock Number 9 (J), Dock Number 10 (K), Dock Number 3 (L), Dock Number 2 (M), Dock Number 1 (N), Sheepshead Bay Branch Brooklyn Public Library (O), Brighton Beach Branch Brooklyn Public Library (P), Fire Department New York Engine 246 Ladder 169 (Q), Oceana Theatre (R), New York Ladder Company 169 (S), Brighton Towers (T). Display/hide their locations on the map
Churches in zip code 11235 include: Temple Beth-El (A), Ocean View Jewish Center (B), Congregation Chasidei Bresslov (C), Roman Catholic Church of the Guardian Angel (D), Jewish Center of Brighton Beach (E), Hebrew Alliance of Brighton Beach (F), New Brighton Jewish Center (G), Saint Margaret Mary Catholic Church (H), Manhattan Beach Jewish Center (I). Display/hide their locations on the map
Parks in zip code 11235 include: Manhattan Beach Park (1), Homecrest Playground (2), Sixteen Trees Triangle (3), Grady Playground (4), Bill Brown Memorial Playground (5), Sheepshead Playground (6), Yak Playground (7), Century Playground (8), Brighton Playground (9). Display/hide their locations on the map
Tourist attractions (not listed on the city page) : Boardwalk Billiards (Amusement & Theme Parks; 3200 Coney Island Avenue), American Voyager Inc (424 Brighton Beach Av).
9,962 married couples with children.
2,409 single-parent households (274 men, 2,135 women).
24.3% of residents of 11235 zip code speak English at home.
7.3% of residents speak Spanish at home (41% very well, 30% well, 25% not well, 4% not at all).
54.0% of residents speak other Indo-European language at home (31% very well, 35% well, 26% not well, 7% not at all).
10.6% of residents speak Asian or Pacific Island language at home (32% very well, 29% well, 24% not well, 15% not at all).
3.6% of residents speak other language at home (35% very well, 38% well, 22% not well, 5% not at all).
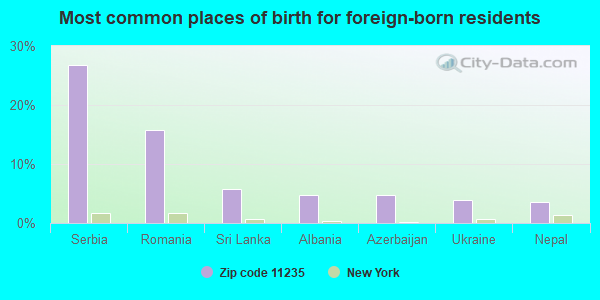
Foreign born population: 51,443 (62.9%) (70.7% of them are naturalized citizens)
This zip code:
62.9%
Whole state:
22.7%
27%Serbia
16%Romania
6%Sri Lanka
5%Albania
5%Azerbaijan
4%Ukraine
4%Nepal
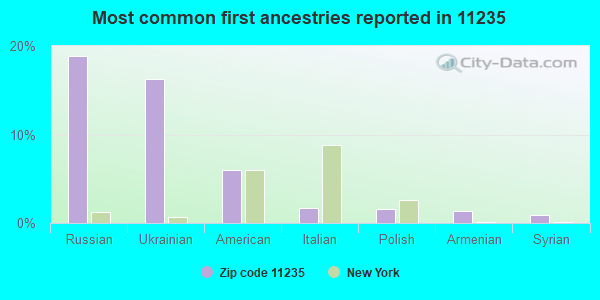
19%Russian
16%Ukrainian
6%American
2%Italian
2%Polish
1%Armenian
1%Syrian
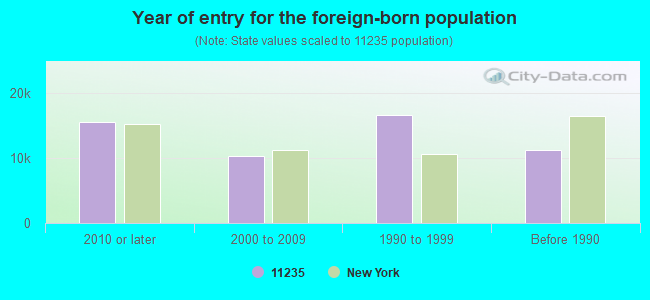
Year of entry for the foreign-born population
15,4282010 or later
10,2092000 to 2009
16,5691990 to 1999
11,190Before 1990
Major facilities with environmental interests located in this zip code:
ISLAND SVCE STA #7316 (3031 CONEY ISLAND AVENUE in BROOKLYN, NY)
AIR MINOR (AIRS/AFS) STATE MASTER (New York facility tracking) - AIR PROGRAM, GROUNDWATER PROGRAM, Small Quantity Generators, between 100 kg and 1000 kg of hazardous waste/month (Resource Conservation and Recovery Act (tracking hazardous waste)) Business SIC classification: GASOLINE SERVICE STATIONS Organizations: CUMBERLAND FARMS INC (CONTACT/OPERATOR)
, TOSCO (CONTACT/OWNER)
, EXXON CO USA (LEGALLY RESPONSIBLE PARTY)
Alternative names: EXXON, EXXON CO USA 37316, TOSCO #34763
3 MARINA S CLEANERS (2831-33 CONEY ISLAND AVE in BROOKLYN, NY)
AIR MINOR (AIRS/AFS) STATE MASTER (New York facility tracking) - AIR PROGRAM Small Quantity Generators, between 100 kg and 1000 kg of hazardous waste/month (Resource Conservation and Recovery Act (tracking hazardous waste)) - notification Business SIC classification: DRYCLEANING PLANTS, EXCEPT RUG CLEANING Business NAICS classification: DRYCLEANING AND LAUNDRY SERVICES (EXCEPT COIN-OPERATED). Organizations: LARISA SHTERU (CONTACT/OWNER)
, 3 MARINA S CLEANERS INC (LEGALLY RESPONSIBLE PARTY)
, S&I MANAGEMENT LP (LEGALLY RESPONSIBLE PARTY)
Alternative names: 3 MARINA'S CLEANERS, MARINA CLEANERS III
CRYSTAL PRIDE CLEANER (1627 SHEEPSHEAD BAY ROAD in BROOKLYN, NY)
AIR MINOR (AIRS/AFS) STATE MASTER (New York facility tracking) - AIR PROGRAM Small Quantity Generators, between 100 kg and 1000 kg of hazardous waste/month (Resource Conservation and Recovery Act (tracking hazardous waste)) Business SIC classification: DRYCLEANING PLANTS, EXCEPT RUG CLEANING Business NAICS classification: DRYCLEANING AND LAUNDRY SERVICES (EXCEPT COIN-OPERATED). Organizations: BETTY BRITE CLEANERS (LEGALLY RESPONSIBLE PARTY)
, LINTON CLEANERS INC (LEGALLY RESPONSIBLE PARTY)
, CRYSTAL PRIDE CLEANER INC (LEGALLY RESPONSIBLE PARTY)
Alternative names: BETTY BRITE CLEANERS
2626 HOMECREST AVE BLDG (2626 HOMECREST AVE in BROOKLYN, NY)
AIR SYNTHETIC MINOR (AIRS/AFS) STATE MASTER (New York facility tracking) - AIR PROGRAM Business SIC classification: OPERATORS OF APARTMENT BUILDINGS Business NAICS classification: LESSORS OF RESIDENTIAL BUILDINGS AND DWELLINGS. Organizations: BEVERLY HILLS OWNERS INC, SCHALIT MANAGEMENT ASSOCIATES LTD (AIR FEE BILLING CONTACT)
, BEVERLY HILLS LEASING CO (LEGALLY RESPONSIBLE PARTY)
2775 EAST 12 STREET BUILDING (2775 EAST 12 STREET in BROOKLYN, NY)
AIR MINOR (AIRS/AFS) STATE MASTER (New York facility tracking) - AIR PROGRAM Business SIC classification: OPERATORS OF APARTMENT BUILDINGS Business NAICS classification: LESSORS OF RESIDENTIAL BUILDINGS AND DWELLINGS. Organizations: BELAIR LEASING LP (LEGALLY RESPONSIBLE PARTY)
Alternative names: 2775 EAST 12TH ST BUILDING
ABRAHAM LINCOLN HIGH SCHOOL (2800 OCEAN PKY in BROOKLYN, NY)
(Geographic Names Information System) (National Center for Education Statistics) - STATE ID-337800010410 Small Quantity Generators, between 100 kg and 1000 kg of hazardous waste/month (Resource Conservation and Recovery Act (tracking hazardous waste)) - notification Organizations: NYC BD OF ED - NYC DEPT DESIGN & CONSTRU (CONTACT/OWNER)
, NEW YORK CITY PUBLIC SCHOOLS (SCHOOL DISTRICT)
Alternative names: ABRAHAM LINCOLN HS, NYC BD OF ED - ABRAHAM LINCOLN H S
CITGO (1611 AVENUE Y in BROOKLYN, NY)
(Integrated Compliance Information System) - ICIS-02-1992-0157, FORMAL ENFORCEMENT ACTION Conditionally Exempt Small Quantity Generators, less than 100 kg/month of hazardous waste (Resource Conservation and Recovery Act (tracking hazardous waste)) Organizations: NON REGULATED (CONTACT/OWNER)
Alternative names: CITY GAS
GOTHIC PRESS (1317 AVE. Z in BROOKLYN, NY)
STATE MASTER (New York facility tracking) - AIR PROGRAM TRI REPORTER (Tracking of toxic chemicals releasing facilities) Business SIC classification: COMMERCIAL PRINTING, LITHOGRAPHIC; PRIMARY SMELTING AND REFINING OF NONFERROUS METALS, EXCEPT COPPER AND ALUMINUM Organizations: GOTHIC PRESS INC (LEGALLY RESPONSIBLE PARTY)
IS 98-BAY ACAD ( in BROOKLYN, NY)
(National Center for Education Statistics) - STATE ID-332100010098 Organizations: NEW YORK CITY PUBLIC SCHOOLS (SCHOOL DISTRICT)
IS 14 SHELL BANK IS ( in BROOKLYN, NY)
(National Center for Education Statistics) - STATE ID-332200010014 Organizations: NEW YORK CITY PUBLIC SCHOOLS (SCHOOL DISTRICT)
IS 43 REYNOLDS IS ( in BROOKLYN, NY)
(National Center for Education Statistics) - STATE ID-332100010043 Organizations: NEW YORK CITY PUBLIC SCHOOLS (SCHOOL DISTRICT)
CON EDISON - TM 1060 (SURF AVE. & W. 12TH ST. in BROOKLYN, NY)
Large Quantity Generators, more that 1000 kg of hazardous waste/month (Resource Conservation and Recovery Act (tracking hazardous waste)) Organizations: CONSOLIDATED EDISON COMPANY OF NY, INC. (CONTACT/OPERATOR)
CON ED-MH 1978 (WILLOUGHBY AVE & WASHINGTN AVE in BROOKLYN, NY)
HAZARDOUS WASTE BIENNIAL REPORTER (Resource Conservation and Recovery Act (tracking hazardous waste)) (Resource Conservation and Recovery Act (tracking hazardous waste))
Housing units lacking complete plumbing facilities: 0.7% Housing units lacking complete kitchen facilities: 1.3%
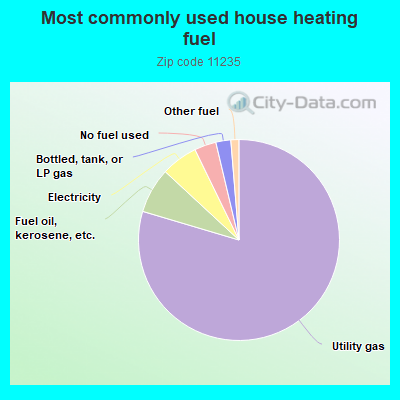
79.6%Utility gas
7.3%Fuel oil, kerosene, etc.
5.9%Electricity
3.5%No fuel used
2.4%Bottled, tank, or LP gas
1.3%Other fuel
Population in 1990: 67,088. Population change in the 1990s: +10,363 (+15.4%).
Place of birth for U.S.-born residents:
This state: 26,755
Northeast: 435
Midwest: 383
South: 634
West: 275
68% of the 11235 zip code residents lived in the same house 5 years ago. Out of people who lived in different houses, 85% lived in this county. Out of people who lived in different counties, 50% lived in New York.
93% of the 11235 zip code residents lived in the same house 1 year ago. Out of people who lived in different houses, 58% moved from this county. Out of people who lived in different houses, 17% moved from different county within same state. Out of people who lived in different houses, 9% moved from different state. Out of people who lived in different houses, 15% moved from abroad.
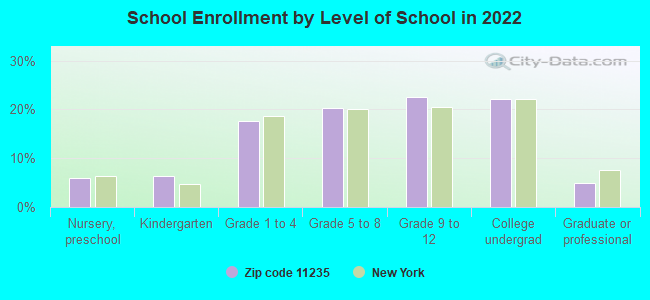
Private vs. public school enrollment:
Students in private schools in grades 1 to 8 (elementary and middle school): 1,004
Here:
18.1%
New York:
15.6%
Students in private schools in grades 9 to 12 (high school): 400
Here:
12.1%
New York:
15.0%
Students in private undergraduate colleges: 729
Here:
22.7%
New York:
39.2%
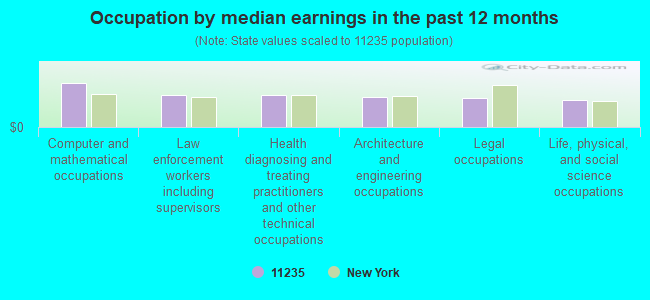
Occupation by median earnings in the past 12 months ($)
132,548Computer and mathematical occupations
96,847Law enforcement workers including supervisors
96,326Health diagnosing and treating practitioners and other technical occupations
90,809Architecture and engineering occupations
88,010Legal occupations
80,991Life, physical, and social science occupations
Companies with federal contracts located in this zip code:
ELCOMMTECH CORP (2620 OCEAN PKWY APT 4H in BROOKLYN, NY; small business) : $10,790 in 2 contractsin 2004
$10,180 with Navy for Miscellaneous Communication Equipment. Signed on 2004-05-25. Completion date: 2004-07-30.
$610, same as above.Signed on 2004-11-30. Completion date: 2004-12-17.
Top industries in this zip code by the number of employees in 2005:
Health Care and Social Assistance: General Medical and Surgical Hospitals (over 1000 employees: 1 establishment)
Health Care and Social Assistance: Offices of Physicians (except Mental Health Specialists) (20-49: 11, 10-19: 13, 5-9: 29, 1-4: 122)
Health Care and Social Assistance: Nursing Care Facilities (250-499: 2, 100-249: 1)
Health Care and Social Assistance: All Other Outpatient Care Centers (250-499: 1, 5-9: 1, 1-4: 2)
Other Services (except Public Administration): Other Similar Organizations (except Business, Professional, Labor, and Political Organizations) (20-49: 3, 10-19: 3, 5-9: 10, 1-4: 25)
People in group quarters in 2010:
810 people in nursing facilities/skilled-nursing facilities
230 people in emergency and transitional shelters (with sleeping facilities) for people experiencing homelessness
96 people in other noninstitutional facilities
67 people in group homes intended for adults
14 people in workers' group living quarters and job corps centers
People in group quarters in 2000:
756 people in nursing homes
535 people in other noninstitutional group quarters
318 people in other group homes
54 people in homes for the mentally retarded
50 people in agriculture workers' dormitories on farms
16 people in mental (psychiatric) hospitals or wards
12 people in religious group quarters
Fatal accident statistics in 2014:
Fatal accident count: 2
Vehicles involved in fatal accidents: 3
Fatal accidents caused by drunken drivers: 0
Fatalities: 2
Persons involved in fatal accidents: 3
Pedestrians involved in fatal accidents: 3
Fatal accident statistics in 2013:
Fatal accident count: 4
Vehicles involved in fatal accidents: 6
Fatal accidents caused by drunken drivers: 1
Fatalities: 4
Persons involved in fatal accidents: 13
Pedestrians involved in fatal accidents: 5
Home Mortgage Disclosure Act Aggregated Statistics For Year 2009 (Based on 17 full and 26 partial tracts)
A) FHA, FSA/RHS & VA Home Purchase Loans
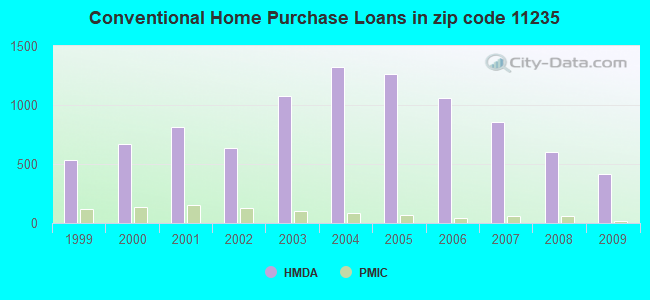
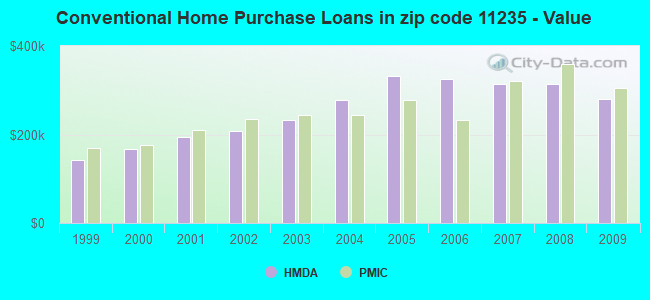
B) Conventional Home Purchase Loans
C) Refinancings
D) Home Improvement Loans
E) Loans on Dwellings For 5+ Families
F) Non-occupant Loans on < 5 Family Dwellings (A B C & D)
G) Loans On Manufactured Home Dwelling (A B C & D)
Number
Average Value
Number
Average Value
Number
Average Value
Number
Average Value
Number
Average Value
Number
Average Value
Number
Average Value
LOANS ORIGINATED
12
$442,429
416
$279,787
426
$288,846
15
$111,761
9
$982,222
32
$304,994
0
$0
APPLICATIONS APPROVED, NOT ACCEPTED
3
$294,133
59
$286,442
81
$295,712
0
$0
0
$0
6
$354,700
0
$0
APPLICATIONS DENIED
9
$502,382
146
$300,399
349
$337,221
42
$56,342
3
$581,053
37
$250,815
1
$15,000
APPLICATIONS WITHDRAWN
7
$481,527
74
$284,099
168
$337,756
6
$435,950
0
$0
10
$377,038
0
$0
FILES CLOSED FOR INCOMPLETENESS
3
$378,333
21
$265,680
56
$341,796
4
$153,398
0
$0
5
$356,558
0
$0
Aggregated Statistics For Year 2008 (Based on 17 full and 24 partial tracts)
A) FHA, FSA/RHS & VA Home Purchase Loans
B) Conventional Home Purchase Loans
C) Refinancings
D) Home Improvement Loans
E) Loans on Dwellings For 5+ Families
F) Non-occupant Loans on < 5 Family Dwellings (A B C & D)
G) Loans On Manufactured Home Dwelling (A B C & D)
Number
Average Value
Number
Average Value
Number
Average Value
Number
Average Value
Number
Average Value
Number
Average Value
Number
Average Value
LOANS ORIGINATED
4
$503,898
598
$313,495
264
$266,566
34
$123,775
25
$1,536,051
54
$358,316
4
$249,450
APPLICATIONS APPROVED, NOT ACCEPTED
0
$0
110
$361,301
89
$290,678
15
$136,305
2
$2,850,000
15
$325,586
0
$0
APPLICATIONS DENIED
10
$483,426
275
$360,600
280
$362,981
65
$104,740
0
$0
46
$356,076
3
$106,583
APPLICATIONS WITHDRAWN
4
$420,070
80
$300,130
102
$347,475
5
$185,552
2
$850,000
13
$317,865
0
$0
FILES CLOSED FOR INCOMPLETENESS
2
$287,270
51
$317,574
34
$369,027
7
$79,663
0
$0
5
$145,644
0
$0
Aggregated Statistics For Year 2007 (Based on 17 full and 26 partial tracts)
A) FHA, FSA/RHS & VA Home Purchase Loans
B) Conventional Home Purchase Loans
C) Refinancings
D) Home Improvement Loans
E) Loans on Dwellings For 5+ Families
F) Non-occupant Loans on < 5 Family Dwellings (A B C & D)
G) Loans On Manufactured Home Dwelling (A B C & D)
Number
Average Value
Number
Average Value
Number
Average Value
Number
Average Value
Number
Average Value
Number
Average Value
Number
Average Value
LOANS ORIGINATED
0
$0
852
$313,165
402
$331,799
74
$176,391
16
$1,273,612
82
$301,679
0
$0
APPLICATIONS APPROVED, NOT ACCEPTED
0
$0
187
$319,950
113
$354,145
23
$121,768
2
$1,983,505
16
$320,492
1
$23,000
APPLICATIONS DENIED
2
$495,450
403
$352,865
361
$377,583
79
$182,000
7
$4,589,689
73
$273,696
0
$0
APPLICATIONS WITHDRAWN
0
$0
115
$346,964
110
$332,392
29
$229,068
3
$1,094,003
19
$368,901
0
$0
FILES CLOSED FOR INCOMPLETENESS
0
$0
39
$291,507
42
$352,360
3
$63,427
0
$0
6
$363,760
0
$0
Aggregated Statistics For Year 2006 (Based on 17 full and 24 partial tracts)
B) Conventional Home Purchase Loans
C) Refinancings
D) Home Improvement Loans
E) Loans on Dwellings For 5+ Families
F) Non-occupant Loans on < 5 Family Dwellings (A B C & D)
G) Loans On Manufactured Home Dwelling (A B C & D)
Number
Average Value
Number
Average Value
Number
Average Value
Number
Average Value
Number
Average Value
Number
Average Value
LOANS ORIGINATED
1,060
$325,224
575
$340,964
88
$198,137
17
$1,473,815
132
$357,648
9
$102,921
APPLICATIONS APPROVED, NOT ACCEPTED
197
$324,104
151
$343,291
14
$190,962
1
$5,000,000
14
$424,368
0
$0
APPLICATIONS DENIED
436
$356,207
350
$401,283
86
$135,265
6
$3,035,240
49
$297,548
0
$0
APPLICATIONS WITHDRAWN
222
$350,105
242
$340,303
16
$188,588
1
$740,000
40
$373,003
0
$0
FILES CLOSED FOR INCOMPLETENESS
50
$351,574
89
$353,225
6
$95,213
0
$0
11
$402,044
1
$500,000
Aggregated Statistics For Year 2005 (Based on 17 full and 26 partial tracts)
B) Conventional Home Purchase Loans
C) Refinancings
D) Home Improvement Loans
E) Loans on Dwellings For 5+ Families
F) Non-occupant Loans on < 5 Family Dwellings (A B C & D)
G) Loans On Manufactured Home Dwelling (A B C & D)
Number
Average Value
Number
Average Value
Number
Average Value
Number
Average Value
Number
Average Value
Number
Average Value
LOANS ORIGINATED
1,266
$332,919
610
$295,517
96
$176,660
13
$1,075,202
170
$362,686
4
$256,788
APPLICATIONS APPROVED, NOT ACCEPTED
217
$364,748
170
$285,344
19
$79,759
2
$2,776,000
29
$326,394
4
$54,360
APPLICATIONS DENIED
421
$347,704
317
$318,749
78
$140,258
2
$564,500
71
$350,875
3
$199,020
APPLICATIONS WITHDRAWN
237
$347,015
335
$290,435
31
$229,901
2
$312,000
43
$350,393
1
$15,090
FILES CLOSED FOR INCOMPLETENESS
47
$381,891
88
$389,434
6
$254,025
0
$0
10
$489,712
0
$0
Aggregated Statistics For Year 2004 (Based on 17 full and 26 partial tracts)
A) FHA, FSA/RHS & VA Home Purchase Loans
B) Conventional Home Purchase Loans
C) Refinancings
D) Home Improvement Loans
E) Loans on Dwellings For 5+ Families
F) Non-occupant Loans on < 5 Family Dwellings (A B C & D)
G) Loans On Manufactured Home Dwelling (A B C & D)
Number
Average Value
Number
Average Value
Number
Average Value
Number
Average Value
Number
Average Value
Number
Average Value
Number
Average Value
LOANS ORIGINATED
1
$269,000
1,321
$278,189
740
$245,146
103
$171,722
29
$1,288,411
166
$304,836
0
$0
APPLICATIONS APPROVED, NOT ACCEPTED
0
$0
212
$300,396
225
$261,946
30
$152,467
2
$1,430,965
37
$306,991
0
$0
APPLICATIONS DENIED
1
$518,000
354
$305,635
386
$292,051
80
$150,271
2
$1,290,000
82
$278,785
1
$27,000
APPLICATIONS WITHDRAWN
2
$254,875
175
$315,615
305
$242,083
34
$208,762
1
$90,000
31
$331,699
0
$0
FILES CLOSED FOR INCOMPLETENESS
0
$0
51
$322,241
78
$310,182
8
$91,408
0
$0
9
$282,399
0
$0
Aggregated Statistics For Year 2003 (Based on 17 full and 26 partial tracts)
A) FHA, FSA/RHS & VA Home Purchase Loans
B) Conventional Home Purchase Loans
C) Refinancings
D) Home Improvement Loans
E) Loans on Dwellings For 5+ Families
F) Non-occupant Loans on < 5 Family Dwellings (A B C & D)
Number
Average Value
Number
Average Value
Number
Average Value
Number
Average Value
Number
Average Value
Number
Average Value
LOANS ORIGINATED
12
$271,641
1,073
$233,886
1,506
$201,570
113
$170,014
22
$1,551,503
114
$233,529
APPLICATIONS APPROVED, NOT ACCEPTED
4
$358,685
152
$262,334
348
$241,993
19
$58,470
0
$0
29
$247,843
APPLICATIONS DENIED
1
$452,820
189
$246,175
542
$218,813
53
$58,113
0
$0
72
$230,481
APPLICATIONS WITHDRAWN
5
$178,352
70
$259,551
366
$214,244
21
$99,162
2
$5,717,565
22
$240,149
FILES CLOSED FOR INCOMPLETENESS
2
$492,000
37
$267,402
102
$256,584
0
$0
0
$0
9
$221,174
Aggregated Statistics For Year 2002 (Based on 15 full and 20 partial tracts)
A) FHA, FSA/RHS & VA Home Purchase Loans
B) Conventional Home Purchase Loans
C) Refinancings
D) Home Improvement Loans
E) Loans on Dwellings For 5+ Families
F) Non-occupant Loans on < 5 Family Dwellings (A B C & D)
Number
Average Value
Number
Average Value
Number
Average Value
Number
Average Value
Number
Average Value
Number
Average Value
LOANS ORIGINATED
11
$232,570
636
$207,727
725
$257,952
75
$64,794
16
$723,961
64
$215,080
APPLICATIONS APPROVED, NOT ACCEPTED
1
$365,000
107
$216,012
207
$219,407
34
$106,064
1
$263,000
20
$241,057
APPLICATIONS DENIED
3
$330,840
174
$218,699
314
$203,957
60
$70,836
5
$261,608
35
$194,903
APPLICATIONS WITHDRAWN
1
$89,020
97
$252,435
253
$196,145
24
$73,437
5
$1,395,000
22
$189,856
FILES CLOSED FOR INCOMPLETENESS
0
$0
30
$231,790
93
$184,317
3
$26,857
0
$0
4
$164,652
Aggregated Statistics For Year 2001 (Based on 15 full and 20 partial tracts)
A) FHA, FSA/RHS & VA Home Purchase Loans
B) Conventional Home Purchase Loans
C) Refinancings
D) Home Improvement Loans
E) Loans on Dwellings For 5+ Families
F) Non-occupant Loans on < 5 Family Dwellings (A B C & D)
Number
Average Value
Number
Average Value
Number
Average Value
Number
Average Value
Number
Average Value
Number
Average Value
LOANS ORIGINATED
14
$272,840
810
$194,639
477
$172,743
44
$86,120
14
$1,590,401
56
$178,558
APPLICATIONS APPROVED, NOT ACCEPTED
0
$0
91
$149,950
138
$158,583
19
$36,284
0
$0
9
$165,688
APPLICATIONS DENIED
6
$243,133
198
$201,138
254
$166,254
86
$56,537
2
$1,275,000
39
$198,963
APPLICATIONS WITHDRAWN
3
$300,000
85
$223,858
251
$181,749
38
$49,246
4
$6,333,280
12
$154,808
FILES CLOSED FOR INCOMPLETENESS
3
$211,307
22
$212,516
38
$166,955
11
$47,739
1
$130,000
1
$152,000
Aggregated Statistics For Year 2000 (Based on 15 full and 20 partial tracts)
A) FHA, FSA/RHS & VA Home Purchase Loans
B) Conventional Home Purchase Loans
C) Refinancings
D) Home Improvement Loans
E) Loans on Dwellings For 5+ Families
F) Non-occupant Loans on < 5 Family Dwellings (A B C & D)
Number
Average Value
Number
Average Value
Number
Average Value
Number
Average Value
Number
Average Value
Number
Average Value
LOANS ORIGINATED
25
$214,565
668
$167,423
144
$136,642
72
$33,277
10
$574,076
44
$169,727
APPLICATIONS APPROVED, NOT ACCEPTED
0
$0
156
$168,421
53
$156,476
25
$36,254
0
$0
8
$138,554
APPLICATIONS DENIED
1
$285,740
176
$180,410
166
$123,271
85
$44,360
0
$0
21
$151,138
APPLICATIONS WITHDRAWN
5
$274,258
74
$200,311
221
$110,154
27
$71,326
1
$1,095,160
16
$138,194
FILES CLOSED FOR INCOMPLETENESS
0
$0
29
$186,790
30
$122,853
3
$28,730
0
$0
2
$266,650
Aggregated Statistics For Year 1999 (Based on 10 full and 19 partial tracts)
A) FHA, FSA/RHS & VA Home Purchase Loans
B) Conventional Home Purchase Loans
C) Refinancings
D) Home Improvement Loans
E) Loans on Dwellings For 5+ Families
F) Non-occupant Loans on < 5 Family Dwellings (A B C & D)
2007 - 2018 National Fire Incident Reporting System (NFIRS) incidents
According to the data from the years 2007 - 2018 the average number of fires per year is 256. The highest number of reported fires - 331 took place in 2008, and the least - 202 in 2011. The data has a decreasing trend.
When looking into fire subcategories, the most reports belonged to: Structure Fires (61.6%), and Outside Fires (27.4%).
Fire incident types reported to NFIRS in Zip Code 11235


 Nearest zip codes: 11229, 11223, 11697, 11224, 11230, 11234.


 According to the data from the years 2007 - 2018 the average number of fires per year is 256. The highest number of reported fires - 331 took place in 2008, and the least - 202 in 2011. The data has a decreasing trend.
 When looking into fire subcategories, the most reports belonged to: Structure Fires (61.6%), and Outside Fires (27.4%).