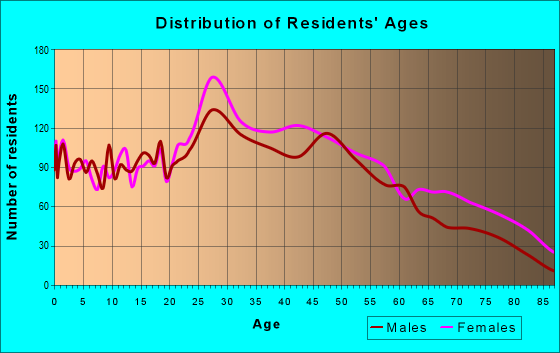
Estimated zip code population in 2022: 15,145 Zip code population in 2010: 15,293 Zip code population in 2000: 15,780
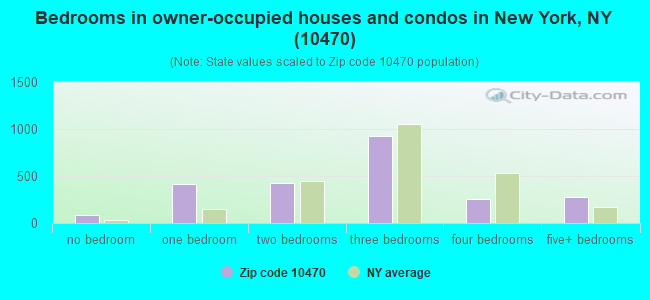
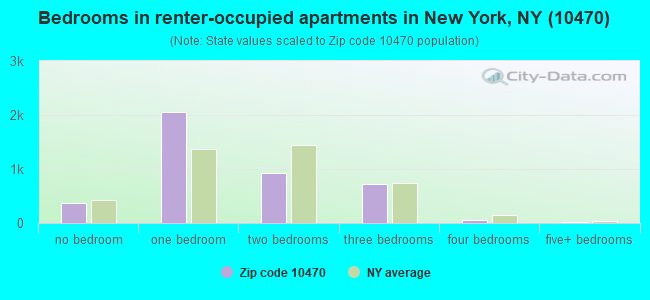
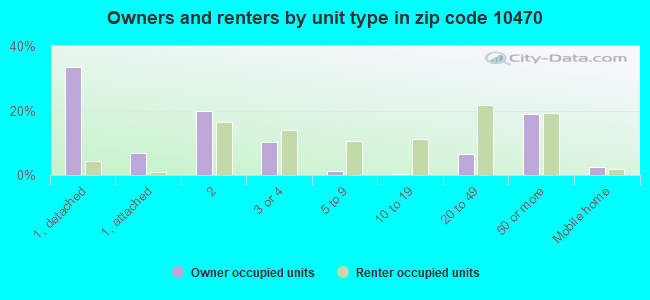
Houses and condos: 6,648 Renter-occupied apartments: 4,130
% of renters here:
64%
State:
46%
March 2022 cost of living index in zip code 10470: 148.0 (very high, U.S. average is 100)
Land area: 1.4 sq. mi. Water area: 0.0 sq. mi.
Population density: 10,630 people per square mile
(high).
OSM Map
General Map
Google Map
MSN Map
OSM Map
General Map
Google Map
MSN Map
OSM Map
General Map
Google Map
MSN Map
OSM Map
General Map
Google Map
MSN Map
Please wait while loading the map...
Real estate property taxes paid for housing units in 2022:
This zip code:
1.0% ($5,653)
New York:
1.5% ($6,180)
Median real estate property taxes paid for housing units with mortgages in 2022: $5,831 (1.0%) Median real estate property taxes paid for housing units with no mortgage in 2022: $5,324 (0.9%)
Averages for the 2020 tax year for zip code 10470, filed in 2021:
Average Adjusted Gross Income (AGI) in 2020: $56,357 (Individual Income Tax Returns)
Here:
$56,357
State:
$90,930
Salary/wage: $54,343 (reported on 78.7% of returns)
Here:
$54,343
State:
$72,104
(% of AGI for various income ranges: 917.9% for AGIs below $25k, 3617.7% for AGIs $25k-50k, 6747.3% for AGIs $50k-75k, 9877.0% for AGIs $75k-100k, 18384.6% for AGIs $100k-200k, 47020.0% for AGIs over 200k)
Taxable interest for individuals: $718 (reported on 23.6% of returns)
This zip code:
$718
New York:
$3,075
(% of AGI for various income ranges: 15.6% for AGIs below $25k, 15.2% for AGIs $25k-50k, 19.0% for AGIs $50k-75k, 52.2% for AGIs $75k-100k, 48.0% for AGIs $100k-200k, 98.8% for AGIs over 200k)
Ordinary dividends: $3,461 (reported on 11.8% of returns)
Here:
$3,461
State:
$11,095
(% of AGI for various income ranges: 14.4% for AGIs below $25k, 15.7% for AGIs $25k-50k, 36.5% for AGIs $50k-75k, 79.8% for AGIs $75k-100k, 156.3% for AGIs $100k-200k, 1306.2% for AGIs over 200k)
Net capital gain/loss in AGI: +$5,911 (reported on 11.1% of returns)
Here:
+$5,911
State:
+$44,925
(% of AGI for various income ranges: 1.8% for AGIs below $25k, 17.5% for AGIs $25k-50k, 39.8% for AGIs $50k-75k, 72.2% for AGIs $75k-100k, 348.8% for AGIs $100k-200k, 2572.5% for AGIs over 200k)
Profit/loss from business: +$6,627 (reported on 16.0% of returns)
Here:
+$6,627
State:
+$14,940
(% of AGI for various income ranges: 225.2% for AGIs below $25k, 103.5% for AGIs $25k-50k, 59.2% for AGIs $50k-75k, 100.0% for AGIs $75k-100k, 137.6% for AGIs $100k-200k, 996.2% for AGIs over 200k)
Taxable individual retirement arrangement distribution: $13,033 (reported on 4.5% of returns)
10470:
$13,033
New York:
$19,609
(% of AGI for various income ranges: 31.7% for AGIs below $25k, 25.2% for AGIs $25k-50k, 67.8% for AGIs $50k-75k, 150.8% for AGIs $75k-100k, 248.6% for AGIs $100k-200k, 1000.0% for AGIs over 200k)
Total itemized deductions: $25,614 (reported on 8.3% of returns)
Here:
$25,614
State:
$39,326
(% of AGI for various income ranges: 34.9% for AGIs below $25k, 121.6% for AGIs $25k-50k, 257.1% for AGIs $50k-75k, 551.2% for AGIs $75k-100k, 1134.2% for AGIs $100k-200k, 2783.8% for AGIs over 200k)
Charity contributions: $5,682 (reported on 6.9% of returns)
Here:
$5,682
State:
$15,420
(% of AGI for various income ranges: 2.7% for AGIs below $25k, 18.1% for AGIs $25k-50k, 38.7% for AGIs $50k-75k, 97.2% for AGIs $75k-100k, 230.5% for AGIs $100k-200k, 675.0% for AGIs over 200k)
Taxes paid: $8,595 (reported on 8.3% of returns)
10470:
$8,595
State:
$9,183
(% of AGI for various income ranges: 7.8% for AGIs below $25k, 30.8% for AGIs $25k-50k, 91.3% for AGIs $50k-75k, 199.0% for AGIs $75k-100k, 411.9% for AGIs $100k-200k, 841.2% for AGIs over 200k)
Earned income credit: $2,294 (reported on 18.0% of returns)
Here:
$2,294
State:
$2,138
(% of AGI for various income ranges: 129.5% for AGIs below $25k, 59.8% for AGIs $25k-50k)
Percentage of individuals using paid preparers for their 2020 taxes: 94.3%
Here:
94%
State:
95%
(% for various income ranges: 92.5% for AGIs below $25k, 95.6% for AGIs $25k-50k, 94.9% for AGIs $50k-75k, 94.4% for AGIs $75k-100k, 96.0% for AGIs $100k-200k, 94.4% for AGIs over 200k)
Averages for the 2012 tax year for zip code 10470, filed in 2013:
Average Adjusted Gross Income (AGI) in 2012: $45,914 (Individual Income Tax Returns)
Here:
$45,914
State:
$77,088
Salary/wage: $46,557 (reported on 79.9% of returns)
Here:
$46,557
State:
$60,593
(% of AGI for various income ranges: 65.0% for AGIs below $25k, 85.8% for AGIs $25k-50k, 83.3% for AGIs $50k-75k, 82.0% for AGIs $75k-100k, 83.1% for AGIs $100k-200k, 73.2% for AGIs over 200k)
Taxable interest for individuals: $807 (reported on 30.0% of returns)
This zip code:
$807
New York:
$3,125
(% of AGI for various income ranges: 1.0% for AGIs below $25k, 0.5% for AGIs $25k-50k, 0.6% for AGIs $50k-75k, 0.7% for AGIs $75k-100k, 0.3% for AGIs $100k-200k, 0.2% for AGIs over 200k)
Ordinary dividends: $3,145 (reported on 13.3% of returns)
Here:
$3,145
State:
$10,299
(% of AGI for various income ranges: 1.0% for AGIs below $25k, 0.6% for AGIs $25k-50k, 1.0% for AGIs $50k-75k, 1.0% for AGIs $75k-100k, 0.9% for AGIs $100k-200k, 1.4% for AGIs over 200k)
Net capital gain/loss in AGI: +$1,282 (reported on 8.9% of returns)
Here:
+$1,282
State:
+$42,474
(% of AGI for various income ranges: 0.5% for AGIs $100k-200k, 2.6% for AGIs over 200k)
Profit/loss from business: +$8,768 (reported on 14.9% of returns)
Here:
+$8,768
State:
+$16,168
(% of AGI for various income ranges: 17.4% for AGIs below $25k, 1.6% for AGIs $25k-50k, 0.9% for AGIs $50k-75k, 1.2% for AGIs $75k-100k, 1.1% for AGIs $100k-200k)
Taxable individual retirement arrangement distribution: $9,438 (reported on 7.2% of returns)
10470:
$9,438
New York:
$17,621
(% of AGI for various income ranges: 1.8% for AGIs below $25k, 1.3% for AGIs $25k-50k, 1.6% for AGIs $50k-75k, 1.2% for AGIs $75k-100k, 1.9% for AGIs $100k-200k)
Total itemized deductions: $19,769 (25% of AGI, reported on 34.5% of returns)
Here:
$19,769
State:
$34,985
Here:
24.6% of AGI
State:
21.3% of AGI
(% of AGI for various income ranges: 7.0% for AGIs below $25k, 12.4% for AGIs $25k-50k, 15.0% for AGIs $50k-75k, 17.0% for AGIs $75k-100k, 18.3% for AGIs $100k-200k, 15.9% for AGIs over 200k)
Charity contributions: $2,868 (reported on 29.8% of returns)
Here:
$2,868
State:
$5,572
(% of AGI for various income ranges: 0.6% for AGIs below $25k, 1.7% for AGIs $25k-50k, 2.1% for AGIs $50k-75k, 2.3% for AGIs $75k-100k, 2.0% for AGIs $100k-200k, 1.9% for AGIs over 200k)
Taxes paid: $8,264 (reported on 34.5% of returns)
10470:
$8,264
State:
$18,656
(% of AGI for various income ranges: 1.5% for AGIs below $25k, 3.1% for AGIs $25k-50k, 5.6% for AGIs $50k-75k, 8.3% for AGIs $75k-100k, 9.0% for AGIs $100k-200k, 9.4% for AGIs over 200k)
Earned income credit: $2,348 (reported on 22.1% of returns)
Here:
$2,348
State:
$2,230
(% of AGI for various income ranges: 8.8% for AGIs below $25k, 0.9% for AGIs $25k-50k)
Percentage of individuals using paid preparers for their 2012 taxes: 72.2%
Here:
72%
State:
66%
(% for various income ranges: 71.5% for AGIs below $25k, 72.4% for AGIs $25k-50k, 67.6% for AGIs $50k-75k, 75.8% for AGIs $75k-100k, 77.3% for AGIs $100k-200k, 85.7% for AGIs over 200k)
Averages for the 2004 tax year for zip code 10470, filed in 2005:
Average Adjusted Gross Income (AGI) in 2004: $39,704 (Individual Income Tax Returns)
Here:
$39,704
State:
$59,519
Salary/wage: $40,263 (reported on 81.3% of returns)
Here:
$40,263
State:
$50,673
(% of AGI for various income ranges: 81.5% for AGIs below $10k, 71.9% for AGIs $10k-25k, 86.4% for AGIs $25k-50k, 85.0% for AGIs $50k-75k, 83.1% for AGIs $75k-100k, 78.2% for AGIs over 100k)
Taxable interest for individuals: $1,171 (reported on 46.9% of returns)
This zip code:
$1,171
New York:
$2,377
(% of AGI for various income ranges: 5.0% for AGIs below $10k, 2.4% for AGIs $10k-25k, 1.4% for AGIs $25k-50k, 1.4% for AGIs $50k-75k, 1.1% for AGIs $75k-100k, 0.7% for AGIs over 100k)
Taxable dividends: $2,098 (reported on 20.1% of returns)
Here:
$2,098
State:
$5,394
(% of AGI for various income ranges: 3.1% for AGIs below $10k, 1.5% for AGIs $10k-25k, 0.9% for AGIs $25k-50k, 1.2% for AGIs $50k-75k, 1.0% for AGIs $75k-100k, 0.8% for AGIs over 100k)
Net capital gain/loss: +$2,176 (reported on 13.5% of returns)
Here:
+$2,176
State:
+$23,581
(% of AGI for various income ranges: -1.7% for AGIs below $10k, -0.2% for AGIs $10k-25k, 0.1% for AGIs $25k-50k, 0.1% for AGIs $50k-75k, 0.8% for AGIs $75k-100k, 3.2% for AGIs over 100k)
Profit/loss from business: +$6,902 (reported on 11.9% of returns)
Here:
+$6,902
State:
+$13,809
(% of AGI for various income ranges: 22.2% for AGIs below $10k, 7.7% for AGIs $10k-25k, 0.9% for AGIs $25k-50k, 0.6% for AGIs $50k-75k, 0.7% for AGIs $75k-100k, 1.8% for AGIs over 100k)
IRA payment deduction: $2,893 (reported on 2.2% of returns)
10470:
$2,893
New York:
$3,115
(% of AGI for various income ranges: 0.2% for AGIs $10k-25k, 0.3% for AGIs $25k-50k, 0.2% for AGIs $50k-75k, 0.1% for AGIs $75k-100k)
Total itemized deductions: $16,413 (27% of AGI, reported on 39.8% of returns)
Here:
$16,413
State:
$25,864
Here:
26.5% of AGI
State:
21.9% of AGI
(% of AGI for various income ranges: 14.0% for AGIs below $10k, 10.3% for AGIs $10k-25k, 15.5% for AGIs $25k-50k, 18.1% for AGIs $50k-75k, 18.0% for AGIs $75k-100k, 18.0% for AGIs over 100k)
Charity contributions deductions: $2,815 (4% of AGI, reported on 37.2% of returns)
Here:
$2,815
State:
$4,439
Here:
4.4% of AGI
State:
3.6% of AGI
(% of AGI for various income ranges: 0.7% for AGIs below $10k, 1.5% for AGIs $10k-25k, 2.8% for AGIs $25k-50k, 3.2% for AGIs $50k-75k, 2.8% for AGIs $75k-100k, 2.4% for AGIs over 100k)
Total tax: $4,998 (reported on 76.2% of returns)
10470:
$4,998
State:
$11,730
(% of AGI for various income ranges: 4.4% for AGIs below $10k, 3.9% for AGIs $10k-25k, 6.7% for AGIs $25k-50k, 10.0% for AGIs $50k-75k, 11.5% for AGIs $75k-100k, 15.3% for AGIs over 100k)
Earned income credit: $1,672 (reported on 17.1% of returns)
Here:
$1,672
State:
$1,757
Percentage of individuals using paid preparers for their 2004 taxes: 70.9%
Here:
71%
State:
67%
(% for various income ranges: 67.3% for AGIs below $10k, 71.0% for AGIs $10k-25k, 70.2% for AGIs $25k-50k, 72.7% for AGIs $50k-75k, 74.2% for AGIs $75k-100k, 76.1% for AGIs over 100k)
Likely homosexual households (counted as self-reported same-sex unmarried-partner households)
Lesbian couples: 0.1% of all households
Gay men: 0.1% of all households
Household received Food Stamps/SNAP in the past 12 months: 936 Household did not receive Food Stamps/SNAP in the past 12 months: 5,542
Women who had a birth in the past 12 months: 243 (125 now married, 120 unmarried) Women who did not have a birth in the past 12 months: 3,416 (877 now married, 2,557 unmarried)
Housing units in zip code 10470 with a mortgage: 1,333 (113 second mortgage, 108 both second mortgage and home equity loan) Houses without a mortgage: 14
Median monthly owner costs for units with a mortgage: $2,959 Median monthly owner costs for units without a mortgage: $919
Residents with income below the poverty level in 2022:
This zip code:
11.2%
Whole state:
14.3%
Residents with income below 50% of the poverty level in 2022:
This zip code:
5.6%
Whole state:
6.8%
Median number of rooms in houses and condos:
Here:
5.1
State:
6.3
Median number of rooms in apartments:
Here:
3.5
State:
3.8
Notable locations in this zip code not listed on our city pages
Notable locations in zip code 10470: Wakefield Station (A), Woodland Heights Branch New York Public Library (B), Fire Department New York Ladder 39 (C), Jerome Avenue Gate House and Police Station (D). Display/hide their locations on the map
Churches in zip code 10470 include: Saint Luke's Methodist Church (A), Saint Stephens Episcopal Church (B), Woodlawn Heights Presbyterian Church (C), Church of the Good Shepherd (D), Wakefield Grace United Methodist Church (E), Saint Paul's Slovak Evangelical Lutheran Church (F). Display/hide their locations on the map
In group quarters: 375 (-1 institutionalized population)
Size of family households: 1,307 2-persons, 986 3-persons, 534 4-persons, 336 5-persons, 181 6-persons, 95 7-or-more-persons
Size of nonfamily households: 2,581 1-person, 431 2-persons, 57 3-persons
1,447 married couples with children.
674 single-parent households (39 men, 635 women).
72.4% of residents of 10470 zip code speak English at home.
16.2% of residents speak Spanish at home (71% very well, 12% well, 13% not well, 4% not at all).
6.1% of residents speak other Indo-European language at home (73% very well, 22% well, 4% not well).
0.4% of residents speak Asian or Pacific Island language at home (13% very well, 55% well, 32% not well).
4.7% of residents speak other language at home (81% very well, 6% well, 13% not well).
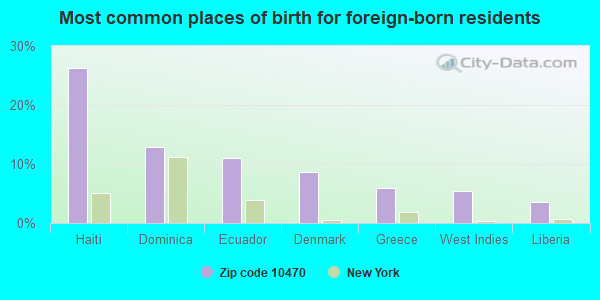
Foreign born population: 4,996 (33.0%) (68.3% of them are naturalized citizens)
This zip code:
33.0%
Whole state:
22.7%
26%Haiti
13%Dominica
11%Ecuador
9%Denmark
6%Greece
5%West Indies
3%Liberia
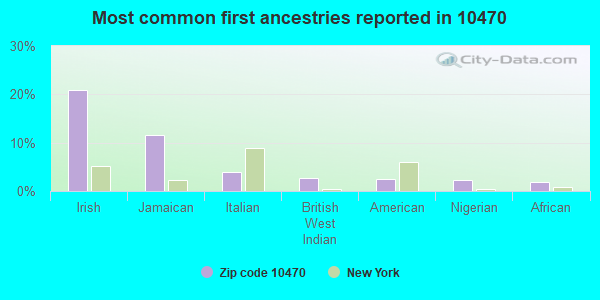
21%Irish
12%Jamaican
4%Italian
3%British West Indian
3%American
2%Nigerian
2%African
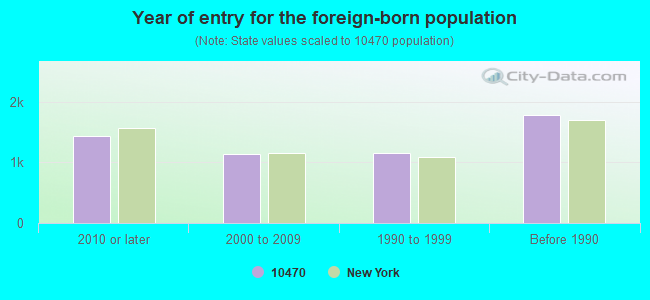
Year of entry for the foreign-born population
1,4362010 or later
1,1322000 to 2009
1,1531990 to 1999
1,779Before 1990
Facilities with environmental interests located in this zip code:
HESS S/S #32273 (610 NERIED AVE in BRONX, NY)
AIR MINOR (AIRS/AFS) STATE MASTER (New York facility tracking) - AIR PROGRAM Conditionally Exempt Small Quantity Generators, less than 100 kg/month of hazardous waste (Resource Conservation and Recovery Act (tracking hazardous waste)) - notification Business SIC classification: GASOLINE SERVICE STATIONS Organizations: HESS CORPORATION, AMERADA HESS CORP (CONTACT/OWNER)
Alternative names: AMERADA HESS STATION 32273, HESS CORPORATION
4811 CLEANERS (4811 WHITE PLAINS RD in BRONX, NY)
AIR MINOR (AIRS/AFS) STATE MASTER (New York facility tracking) - AIR PROGRAM, HAZARDOUS WASTE PROGRAM Small Quantity Generators, between 100 kg and 1000 kg of hazardous waste/month (Resource Conservation and Recovery Act (tracking hazardous waste)) Business SIC classification: DRYCLEANING PLANTS, EXCEPT RUG CLEANING Business NAICS classification: DRYCLEANING AND LAUNDRY SERVICES (EXCEPT COIN-OPERATED). Organizations: 4811 CLEANERS CORP (LEGALLY RESPONSIBLE PARTY)
Alternative names: THREE RS CLEANERS
IMPACT BODY REPAIR-AUTOBODY (4454 BRONX BLVD in BRONX, NY)
STATE MASTER (New York facility tracking) - AIR PROGRAM, Small Quantity Generators, between 100 kg and 1000 kg of hazardous waste/month (Resource Conservation and Recovery Act (tracking hazardous waste)) - notification Organizations: VICTOR BORSELLA, JACK MANGALHAES (CONTACT/OWNER)
Alternative names: IMPACT BODY REPAIR INC.
CON ED - V 2596 (233 ST & CARPENTER AVE in BRONX, NY)
HAZARDOUS WASTE BIENNIAL REPORTER (Resource Conservation and Recovery Act (tracking hazardous waste)) (Resource Conservation and Recovery Act (tracking hazardous waste))
2540 BARKER AVE BUILDING (2540 BARKER AVE in BRONX, NY)
AIR MINOR (AIRS/AFS) Business SIC classification: NONCLASSIFIABLE ESTABLISHMENTS
A A A BEST AUTO BODY (44-54 WHITE PLAIN AVE in BRONX, NY)
(Resource Conservation and Recovery Act (tracking hazardous waste))
Housing units lacking complete plumbing facilities: 0.5% Housing units lacking complete kitchen facilities: 1.3%
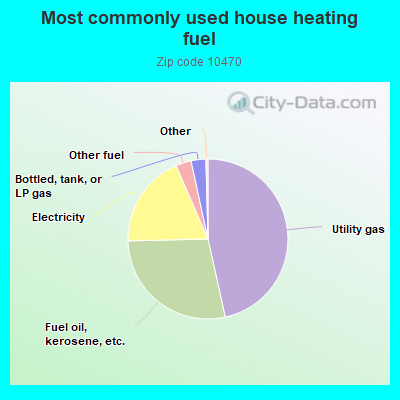
46.6%Utility gas
28.1%Fuel oil, kerosene, etc.
18.9%Electricity
3.1%Other fuel
3.0%Bottled, tank, or LP gas
Population in 1990: 13,254. Population change in the 1990s: +2,526 (+19.1%).
Place of birth for U.S.-born residents:
This state: 8,225
Northeast: 585
Midwest: 221
South: 443
West: 147
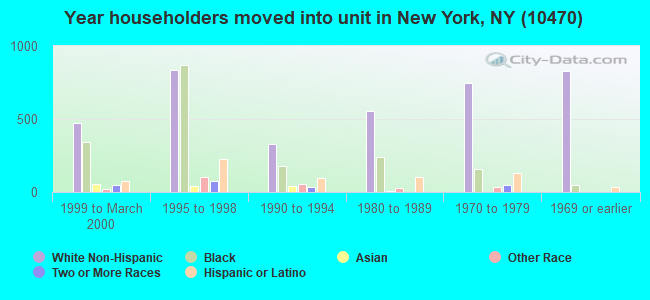
65% of the 10470 zip code residents lived in the same house 5 years ago. Out of people who lived in different houses, 65% lived in this county. Out of people who lived in different counties, 50% lived in New York.
86% of the 10470 zip code residents lived in the same house 1 year ago. Out of people who lived in different houses, 43% moved from this county. Out of people who lived in different houses, 43% moved from different county within same state. Out of people who lived in different houses, 13% moved from different state. Out of people who lived in different houses, 2% moved from abroad.
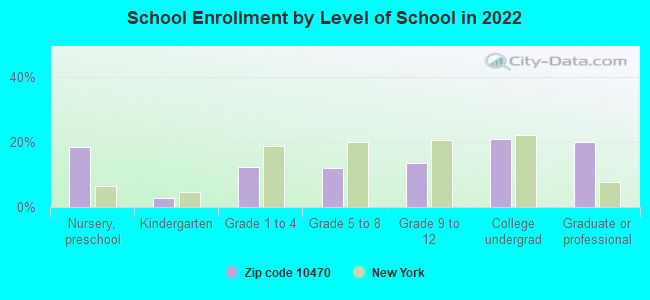
Private vs. public school enrollment:
Students in private schools in grades 1 to 8 (elementary and middle school): 57
Here:
8.4%
New York:
15.6%
Students in private schools in grades 9 to 12 (high school): 170
Here:
43.7%
New York:
15.0%
Students in private undergraduate colleges: 220
Here:
37.4%
New York:
39.2%
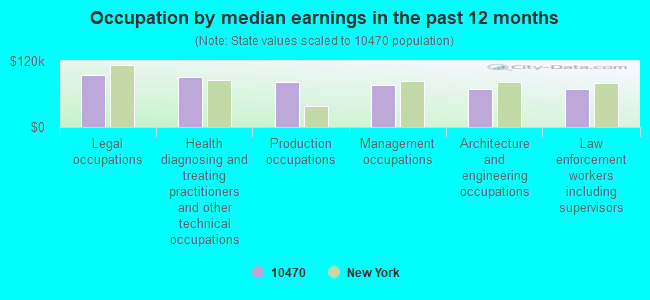
Occupation by median earnings in the past 12 months ($)
95,053Legal occupations
91,187Health diagnosing and treating practitioners and other technical occupations
81,019Production occupations
76,450Management occupations
69,394Architecture and engineering occupations
68,326Law enforcement workers including supervisors
Companies with federal contracts located in this zip code:
SRM CONSTRUCTION CORPORATION (4459 BRONX BLVD in BRONX, NY; small business) : $1,912,646 in 12 contractsfrom 2000 to 2002
Contracts for Maintenance, Repair or Alteration of Real Property -- Highways, Roads, Streets, Bridges, and Railways (includes resurfacing) by Army Signed by year:2000: $1,401,716; 2001: $513,827; 2002: -$2,897; 2003: $0; 2004: $0; 2005: $0; 2006: $0.
Biggest contracts:
$475,000 with Army for Maintenance, Repair or Alteration of Real Property -- Highways, Roads, Streets, Bridges, and Railways (includes resurfacing). Signed on 2000-02-01. Completion date: 2000-11-18.
$350,000, same as above.Signed on 2000-03-01. Completion date: 2001-01-17.
$268,755, same as above.Signed on 2000-08-31. Completion date: 2001-03-19.
$210,490, same as above.Signed on 2001-02-08. Completion date: 2001-06-17.
SPACE AGE PLASTIC FABRICATORS (4519 WHITE PLAINS RD in BRONX, NY; small business)
$29,585 with Defense Logistics Agency for Radar Equipment, Airborne. Signed on 2002-03-11. Completion date: 2002-05-06.
D R A SECURITY SYSTEMS, INC (4645 BULLARD AVE in BRONX, NY; small business)
$4,940 with Navy for Maintenance, Repair and Rebuilding of Equipment -- Fire Control Equipment. Signed on 2005-09-08. Completion date: 2005-09-08.
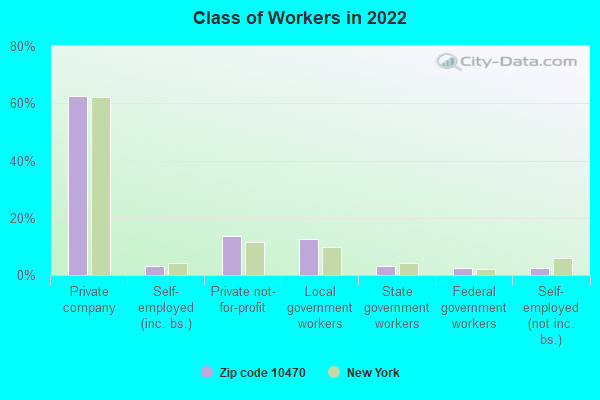
Top industries in this zip code by the number of employees in 2005:
Health Care and Social Assistance: Residential Mental Retardation Facilities (100-249 employees: 1 establishment, 50-99 employees: 1 establishment, 20-49 employees: 1 establishment)
2007 - 2018 National Fire Incident Reporting System (NFIRS) incidents
Based on the data from the years 2007 - 2018 the average number of fire incidents per year is 61. The highest number of reported fires - 90 took place in 2014, and the least - 26 in 2007. The data has an increasing trend.
When looking into fire subcategories, the most incidents belonged to: Structure Fires (69.2%), and Outside Fires (21.2%).
Fire incident types reported to NFIRS in Zip Code 10470
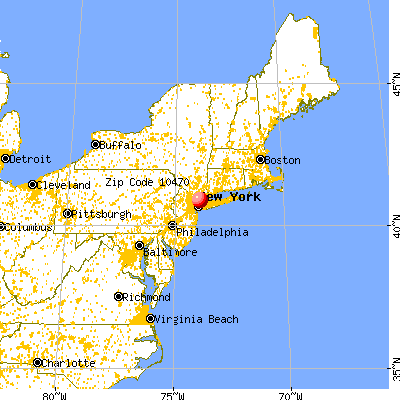


 Nearest zip codes: 10467, 10466, 10458, 10704, 10471, 10469.
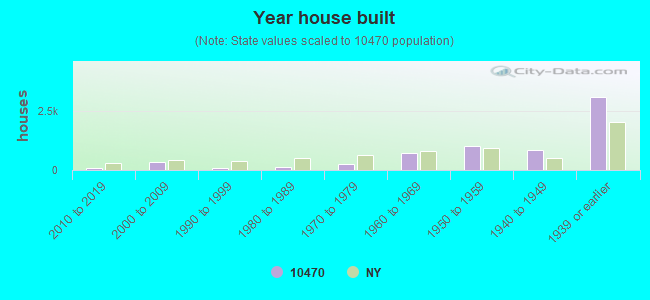


 Based on the data from the years 2007 - 2018 the average number of fire incidents per year is 61. The highest number of reported fires - 90 took place in 2014, and the least - 26 in 2007. The data has an increasing trend.
 When looking into fire subcategories, the most incidents belonged to: Structure Fires (69.2%), and Outside Fires (21.2%).