Estimated zip code population in 2022: 31,923 Zip code population in 2010: 30,165 Zip code population in 2000: 29,158
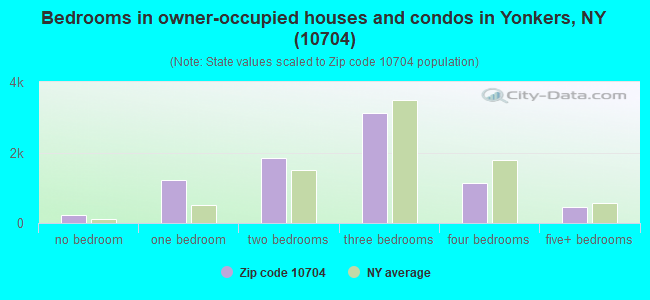
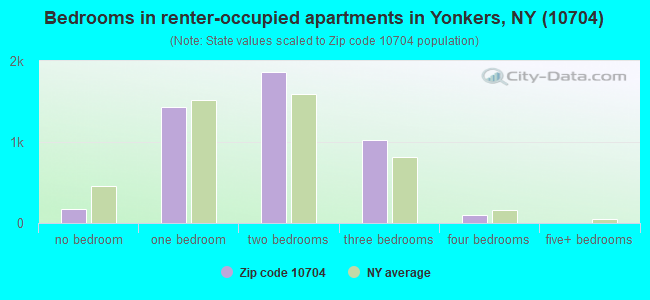
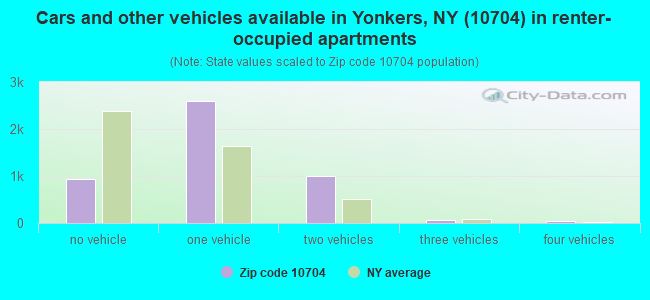
Houses and condos: 13,034 Renter-occupied apartments: 4,617
% of renters here:
37%
State:
46%
March 2022 cost of living index in zip code 10704: 147.9 (very high, U.S. average is 100)
Land area: 2.7 sq. mi. Water area: 0.1 sq. mi.
Population density: 11,950 people per square mile
(high).
OSM Map
General Map
Google Map
MSN Map
OSM Map
General Map
Google Map
MSN Map
OSM Map
General Map
Google Map
MSN Map
OSM Map
General Map
Google Map
MSN Map
Please wait while loading the map...
Real estate property taxes paid for housing units in 2022:
This zip code:
1.9% ($9,376)
New York:
1.5% ($6,180)
Median real estate property taxes paid for housing units with mortgages in 2022: $9,858 (1.8%) Median real estate property taxes paid for housing units with no mortgage in 2022: $8,133 (1.7%)
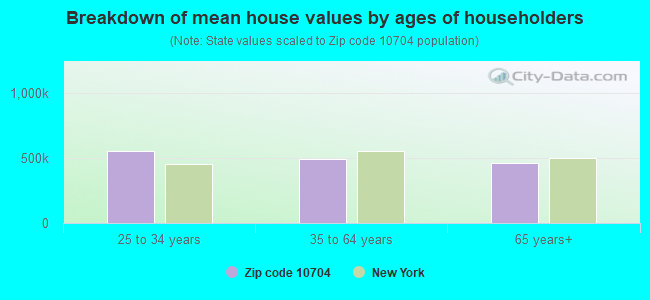
Estimated median house/condo value in 2022: $499,327
10704:
$499,327
New York:
$400,400
According to our research of New York and other state lists, there were 7 registered sex offenders living in 10704 zip code as of April 27, 2024. The ratio of all residents to sex offenders in zip code 10704 is 4,655 to 1. The ratio of registered sex offenders to all residents in this zip code is much lower than the state average.
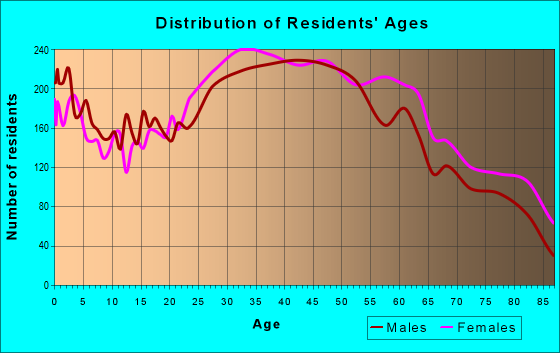
Median resident age:
This zip code:
41.4 years
New York median age:
40.0 years
Average household size:
This zip code:
2.5 people
New York:
2.5 people
Averages for the 2020 tax year for zip code 10704, filed in 2021:
Average Adjusted Gross Income (AGI) in 2020: $67,442 (Individual Income Tax Returns)
Here:
$67,442
State:
$90,930
Salary/wage: $63,969 (reported on 79.6% of returns)
Here:
$63,969
State:
$72,104
(% of AGI for various income ranges: 1018.2% for AGIs below $25k, 3487.7% for AGIs $25k-50k, 6787.1% for AGIs $50k-75k, 10264.3% for AGIs $75k-100k, 18530.6% for AGIs $100k-200k, 62164.8% for AGIs over 200k)
Taxable interest for individuals: $1,110 (reported on 30.4% of returns)
This zip code:
$1,110
New York:
$3,075
(% of AGI for various income ranges: 19.0% for AGIs below $25k, 26.4% for AGIs $25k-50k, 50.9% for AGIs $50k-75k, 54.6% for AGIs $75k-100k, 93.2% for AGIs $100k-200k, 477.6% for AGIs over 200k)
Ordinary dividends: $3,673 (reported on 16.6% of returns)
Here:
$3,673
State:
$11,095
(% of AGI for various income ranges: 26.8% for AGIs below $25k, 32.1% for AGIs $25k-50k, 59.7% for AGIs $50k-75k, 77.7% for AGIs $75k-100k, 190.5% for AGIs $100k-200k, 1501.9% for AGIs over 200k)
Net capital gain/loss in AGI: +$9,141 (reported on 15.6% of returns)
Here:
+$9,141
State:
+$44,925
(% of AGI for various income ranges: 3.8% for AGIs below $25k, 21.7% for AGIs $25k-50k, 67.5% for AGIs $50k-75k, 83.7% for AGIs $75k-100k, 346.9% for AGIs $100k-200k, 7398.1% for AGIs over 200k)
Profit/loss from business: +$9,452 (reported on 15.8% of returns)
Here:
+$9,452
State:
+$14,940
(% of AGI for various income ranges: 234.4% for AGIs below $25k, 180.4% for AGIs $25k-50k, 112.2% for AGIs $50k-75k, 149.6% for AGIs $75k-100k, 260.9% for AGIs $100k-200k, 2377.1% for AGIs over 200k)
Taxable individual retirement arrangement distribution: $14,673 (reported on 6.2% of returns)
10704:
$14,673
New York:
$19,609
(% of AGI for various income ranges: 55.4% for AGIs below $25k, 59.6% for AGIs $25k-50k, 138.5% for AGIs $50k-75k, 141.4% for AGIs $75k-100k, 289.3% for AGIs $100k-200k, 1125.7% for AGIs over 200k)
Self-employed (Keogh) retirement plans: $22,633 (reported on 0.2% of returns)
10704:
$22,633
New York:
$32,497
(% of AGI for various income ranges: 37.1% for AGIs $100k-200k)
Total itemized deductions: $26,745 (reported on 11.8% of returns)
Here:
$26,745
State:
$39,326
(% of AGI for various income ranges: 100.1% for AGIs below $25k, 145.6% for AGIs $25k-50k, 299.8% for AGIs $50k-75k, 620.4% for AGIs $75k-100k, 1270.4% for AGIs $100k-200k, 4825.2% for AGIs over 200k)
Charity contributions: $4,748 (reported on 9.9% of returns)
Here:
$4,748
State:
$15,420
(% of AGI for various income ranges: 4.9% for AGIs below $25k, 11.6% for AGIs $25k-50k, 36.3% for AGIs $50k-75k, 94.8% for AGIs $75k-100k, 213.3% for AGIs $100k-200k, 842.9% for AGIs over 200k)
Taxes paid: $9,086 (reported on 11.8% of returns)
10704:
$9,086
State:
$9,183
(% of AGI for various income ranges: 32.5% for AGIs below $25k, 45.1% for AGIs $25k-50k, 103.1% for AGIs $50k-75k, 225.8% for AGIs $75k-100k, 469.5% for AGIs $100k-200k, 1275.2% for AGIs over 200k)
Earned income credit: $1,980 (reported on 11.8% of returns)
Here:
$1,980
State:
$2,138
(% of AGI for various income ranges: 84.9% for AGIs below $25k, 57.4% for AGIs $25k-50k)
Percentage of individuals using paid preparers for their 2020 taxes: 94.7%
Here:
95%
State:
95%
(% for various income ranges: 92.7% for AGIs below $25k, 95.4% for AGIs $25k-50k, 95.3% for AGIs $50k-75k, 95.2% for AGIs $75k-100k, 95.6% for AGIs $100k-200k, 95.2% for AGIs over 200k)
Averages for the 2012 tax year for zip code 10704, filed in 2013:
Average Adjusted Gross Income (AGI) in 2012: $58,651 (Individual Income Tax Returns)
Here:
$58,651
State:
$77,088
Salary/wage: $56,368 (reported on 81.3% of returns)
Here:
$56,368
State:
$60,593
(% of AGI for various income ranges: 63.6% for AGIs below $25k, 80.6% for AGIs $25k-50k, 81.9% for AGIs $50k-75k, 81.9% for AGIs $75k-100k, 83.5% for AGIs $100k-200k, 58.7% for AGIs over 200k)
Taxable interest for individuals: $1,040 (reported on 38.4% of returns)
This zip code:
$1,040
New York:
$3,125
(% of AGI for various income ranges: 1.5% for AGIs below $25k, 0.7% for AGIs $25k-50k, 0.5% for AGIs $50k-75k, 0.6% for AGIs $75k-100k, 0.6% for AGIs $100k-200k, 0.8% for AGIs over 200k)
Ordinary dividends: $3,220 (reported on 19.0% of returns)
Here:
$3,220
State:
$10,299
(% of AGI for various income ranges: 1.9% for AGIs below $25k, 0.8% for AGIs $25k-50k, 1.0% for AGIs $50k-75k, 0.9% for AGIs $75k-100k, 0.9% for AGIs $100k-200k, 1.4% for AGIs over 200k)
Net capital gain/loss in AGI: +$3,747 (reported on 13.6% of returns)
Here:
+$3,747
State:
+$42,474
(% of AGI for various income ranges: 0.3% for AGIs $75k-100k, 0.3% for AGIs $100k-200k, 6.1% for AGIs over 200k)
Profit/loss from business: +$9,760 (reported on 13.6% of returns)
Here:
+$9,760
State:
+$16,168
(% of AGI for various income ranges: 13.4% for AGIs below $25k, 3.1% for AGIs $25k-50k, 1.8% for AGIs $50k-75k, 0.9% for AGIs $75k-100k, 1.2% for AGIs $100k-200k, 0.3% for AGIs over 200k)
Taxable individual retirement arrangement distribution: $11,885 (reported on 9.1% of returns)
10704:
$11,885
New York:
$17,621
(% of AGI for various income ranges: 3.6% for AGIs below $25k, 2.0% for AGIs $25k-50k, 1.8% for AGIs $50k-75k, 1.7% for AGIs $75k-100k, 1.6% for AGIs $100k-200k, 1.6% for AGIs over 200k)
Self-employment retirement plans: $20,150 (reported on 0.2% of returns)
10704:
$20,150
New York:
$27,330
Total itemized deductions: $22,818 (25% of AGI, reported on 43.0% of returns)
Here:
$22,818
State:
$34,985
Here:
24.6% of AGI
State:
21.3% of AGI
(% of AGI for various income ranges: 12.4% for AGIs below $25k, 13.7% for AGIs $25k-50k, 15.3% for AGIs $50k-75k, 18.1% for AGIs $75k-100k, 19.5% for AGIs $100k-200k, 15.8% for AGIs over 200k)
Charity contributions: $2,589 (reported on 37.8% of returns)
Here:
$2,589
State:
$5,572
(% of AGI for various income ranges: 0.9% for AGIs below $25k, 1.5% for AGIs $25k-50k, 1.8% for AGIs $50k-75k, 1.9% for AGIs $75k-100k, 1.9% for AGIs $100k-200k, 1.4% for AGIs over 200k)
Taxes paid: $10,153 (reported on 42.9% of returns)
10704:
$10,153
State:
$18,656
(% of AGI for various income ranges: 4.5% for AGIs below $25k, 4.4% for AGIs $25k-50k, 5.9% for AGIs $50k-75k, 7.6% for AGIs $75k-100k, 9.2% for AGIs $100k-200k, 10.3% for AGIs over 200k)
Earned income credit: $2,005 (reported on 12.7% of returns)
Here:
$2,005
State:
$2,230
(% of AGI for various income ranges: 5.0% for AGIs below $25k, 0.7% for AGIs $25k-50k)
Percentage of individuals using paid preparers for their 2012 taxes: 73.3%
Here:
73%
State:
66%
(% for various income ranges: 69.1% for AGIs below $25k, 72.0% for AGIs $25k-50k, 73.9% for AGIs $50k-75k, 77.7% for AGIs $75k-100k, 79.6% for AGIs $100k-200k, 81.2% for AGIs over 200k)
Averages for the 2004 tax year for zip code 10704, filed in 2005:
Average Adjusted Gross Income (AGI) in 2004: $48,094 (Individual Income Tax Returns)
Here:
$48,094
State:
$59,519
Salary/wage: $47,485 (reported on 80.2% of returns)
Here:
$47,485
State:
$50,673
(% of AGI for various income ranges: 86.4% for AGIs below $10k, 63.4% for AGIs $10k-25k, 82.9% for AGIs $25k-50k, 84.4% for AGIs $50k-75k, 84.7% for AGIs $75k-100k, 72.4% for AGIs over 100k)
Taxable interest for individuals: $1,437 (reported on 58.2% of returns)
This zip code:
$1,437
New York:
$2,377
(% of AGI for various income ranges: 9.4% for AGIs below $10k, 3.6% for AGIs $10k-25k, 1.6% for AGIs $25k-50k, 1.3% for AGIs $50k-75k, 1.2% for AGIs $75k-100k, 1.7% for AGIs over 100k)
Taxable dividends: $2,074 (reported on 27.3% of returns)
Here:
$2,074
State:
$5,394
(% of AGI for various income ranges: 6.2% for AGIs below $10k, 2.4% for AGIs $10k-25k, 0.9% for AGIs $25k-50k, 1.0% for AGIs $50k-75k, 0.9% for AGIs $75k-100k, 1.2% for AGIs over 100k)
Net capital gain/loss: +$5,446 (reported on 20.5% of returns)
Here:
+$5,446
State:
+$23,581
(% of AGI for various income ranges: -3.6% for AGIs below $10k, -0.3% for AGIs $10k-25k, 0.2% for AGIs $25k-50k, 0.3% for AGIs $50k-75k, 0.4% for AGIs $75k-100k, 7.5% for AGIs over 100k)
Profit/loss from business: +$9,429 (reported on 12.7% of returns)
Here:
+$9,429
State:
+$13,809
(% of AGI for various income ranges: 20.5% for AGIs below $10k, 9.9% for AGIs $10k-25k, 2.5% for AGIs $25k-50k, 1.5% for AGIs $50k-75k, 1.0% for AGIs $75k-100k, 1.7% for AGIs over 100k)
IRA payment deduction: $3,104 (reported on 3.0% of returns)
10704:
$3,104
New York:
$3,115
(% of AGI for various income ranges: 0.5% for AGIs below $10k, 0.3% for AGIs $10k-25k, 0.3% for AGIs $25k-50k, 0.2% for AGIs $50k-75k, 0.1% for AGIs $75k-100k, 0.1% for AGIs over 100k)
Self-employed pension: $10,333 (reported on 0.4% of returns)
Here:
$10,333
New York:
$19,016
(% of AGI for various income ranges: 0.1% for AGIs $25k-50k, 0.0% for AGIs $50k-75k, 0.1% for AGIs $75k-100k, 0.2% for AGIs over 100k)
Total itemized deductions: $18,367 (25% of AGI, reported on 44.5% of returns)
Here:
$18,367
State:
$25,864
Here:
25.4% of AGI
State:
21.9% of AGI
(% of AGI for various income ranges: 17.2% for AGIs below $10k, 14.9% for AGIs $10k-25k, 15.7% for AGIs $25k-50k, 17.8% for AGIs $50k-75k, 18.4% for AGIs $75k-100k, 17.0% for AGIs over 100k)
Charity contributions deductions: $2,626 (4% of AGI, reported on 41.6% of returns)
Here:
$2,626
State:
$4,439
Here:
3.5% of AGI
State:
3.6% of AGI
(% of AGI for various income ranges: 1.0% for AGIs below $10k, 1.6% for AGIs $10k-25k, 2.3% for AGIs $25k-50k, 2.6% for AGIs $50k-75k, 2.5% for AGIs $75k-100k, 2.1% for AGIs over 100k)
Total tax: $6,548 (reported on 81.7% of returns)
10704:
$6,548
State:
$11,730
(% of AGI for various income ranges: 4.5% for AGIs below $10k, 4.7% for AGIs $10k-25k, 7.7% for AGIs $25k-50k, 10.4% for AGIs $50k-75k, 11.5% for AGIs $75k-100k, 15.9% for AGIs over 100k)
Earned income credit: $1,425 (reported on 9.1% of returns)
Here:
$1,425
State:
$1,757
Percentage of individuals using paid preparers for their 2004 taxes: 70.6%
Here:
71%
State:
67%
(% for various income ranges: 64.8% for AGIs below $10k, 71.1% for AGIs $10k-25k, 69.2% for AGIs $25k-50k, 73.0% for AGIs $50k-75k, 72.2% for AGIs $75k-100k, 77.2% for AGIs over 100k)
Likely homosexual households (counted as self-reported same-sex unmarried-partner households)
Lesbian couples: 0.0% of all households
Gay men: 0.2% of all households
Household received Food Stamps/SNAP in the past 12 months: 746 Household did not receive Food Stamps/SNAP in the past 12 months: 11,630
Women who had a birth in the past 12 months: 556 (473 now married, 78 unmarried) Women who did not have a birth in the past 12 months: 7,110 (2,675 now married, 4,430 unmarried)
Housing units in zip code 10704 with a mortgage: 4,469 (257 second mortgage, 16 home equity loan, 187 both second mortgage and home equity loan) Houses without a mortgage: 79
Median monthly owner costs for units with a mortgage: $2,932 Median monthly owner costs for units without a mortgage: $1,202
Residents with income below the poverty level in 2022:
This zip code:
12.1%
Whole state:
14.3%
Residents with income below 50% of the poverty level in 2022:
This zip code:
3.7%
Whole state:
6.8%
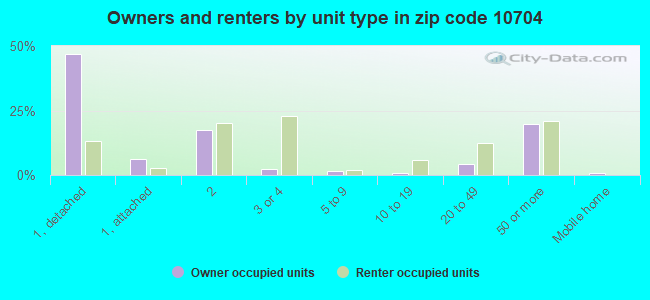
Median number of rooms in houses and condos:
Here:
5.5
State:
6.3
Median number of rooms in apartments:
Here:
4.1
State:
3.8
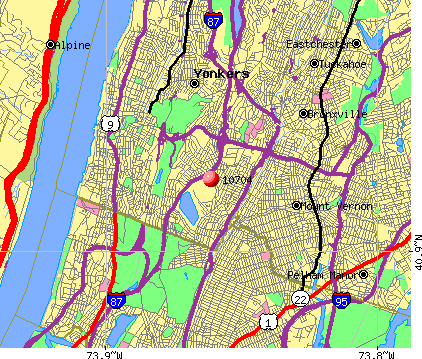
Notable locations in this zip code not listed on our city pages
Notable locations in zip code 10704: Yonkers Raceway (A), Yonkers Fire Department Station 7 (B), Yonkers Fire Department Station 13 (C). Display/hide their locations on the map
Churches in zip code 10704 include: Saint Marks Lutheran Church (A), Saint Barnabas Parish Center (B), Saint John the Baptist Catholic Church (C), Saint Ann's Church (D), Saint Andrew's Marthoma Church (E), Dunwoodie Baptist Church (F), Crescent Place Reformed Church (G). Display/hide their locations on the map
Parks in zip code 10704 include: Bregano Memorial Park (1), Coyne Park (2), Wakefield Park (3), Cerone Avenue Park (4), Stillwell Park (5), Trenchard Street Park (6). Display/hide their locations on the map
4,222 married couples with children.
1,315 single-parent households (215 men, 1,100 women).
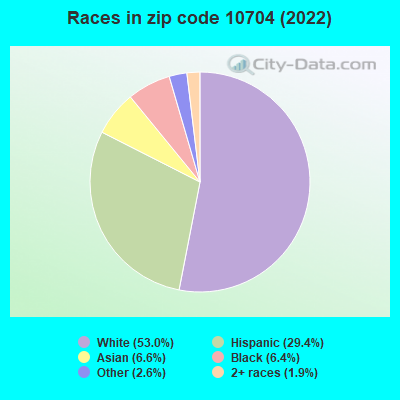
55.4% of residents of 10704 zip code speak English at home.
22.5% of residents speak Spanish at home (69% very well, 17% well, 7% not well, 7% not at all).
14.6% of residents speak other Indo-European language at home (67% very well, 26% well, 6% not well).
5.3% of residents speak Asian or Pacific Island language at home (59% very well, 32% well, 8% not well, 1% not at all).
2.2% of residents speak other language at home (87% very well, 7% well, 6% not well).
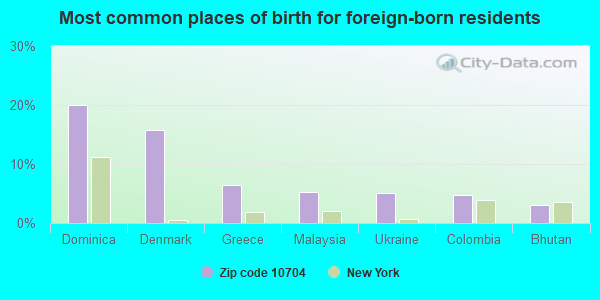
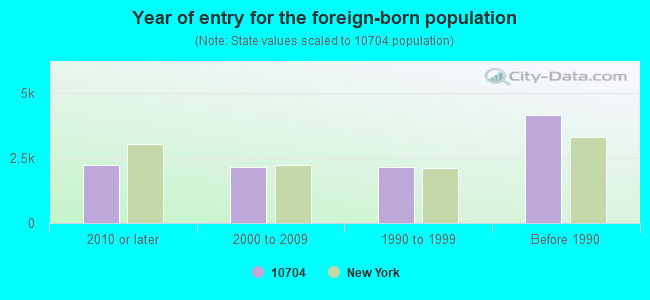
Foreign born population: 9,841 (30.8%) (76.4% of them are naturalized citizens)
Facilities with environmental interests located in this zip code:
CRYSTAL CLEANERS (796 YONKERS AVE in YONKERS, NY)
AIR MINOR (AIRS/AFS) STATE MASTER (New York facility tracking) - AIR PROGRAM, HAZARDOUS WASTE PROGRAM Small Quantity Generators, between 100 kg and 1000 kg of hazardous waste/month (Resource Conservation and Recovery Act (tracking hazardous waste)) - notification Business SIC classification: DRYCLEANING PLANTS, EXCEPT RUG CLEANING Business NAICS classification: DRYCLEANING AND LAUNDRY SERVICES (EXCEPT COIN-OPERATED). Organizations: SEONG YONG AHN (CONTACT/OWNER)
GOLDEN TOUCH CLEANERS (558 KIMBALL AVENUE in YONKERS, NY)
AIR MINOR (AIRS/AFS) STATE MASTER (New York facility tracking) - AIR PROGRAM Small Quantity Generators, between 100 kg and 1000 kg of hazardous waste/month (Resource Conservation and Recovery Act (tracking hazardous waste)) - notification Business SIC classification: DRYCLEANING PLANTS, EXCEPT RUG CLEANING Business NAICS classification: DRYCLEANING AND LAUNDRY SERVICES (EXCEPT COIN-OPERATED). Organizations: KENNY KIM (CONTACT/OWNER)
, K & Y CLEANERS INC (LEGALLY RESPONSIBLE PARTY)
Alternative names: GOLDEN TOUCH DBA K&Y CLEANERS, K&S CLEANERS, K & Y CLEANERS, KEY CLEANERS, SPOT DOCTOR CLEANERS
ANGEL DRY CLEANERS OF YONKERS INC (346 KIMBALL AVENUE in YONKERS, NY)
AIR MINOR (AIRS/AFS) STATE MASTER (New York facility tracking) - AIR PROGRAM Business SIC classification: DRYCLEANING PLANTS, EXCEPT RUG CLEANING Business NAICS classification: DRYCLEANING AND LAUNDRY SERVICES (EXCEPT COIN-OPERATED).
CONSOLIDATED EDISON DUNWOODIE SUBSTATION (SMART AND MARCO AVENUE in YONKERS, NY)
National Pollutant Discharge Elimination System NON-MAJOR (Tracking pollutant discharge elimination systems) - permit HAZARDOUS WASTE BIENNIAL REPORTER (Resource Conservation and Recovery Act (tracking hazardous waste)) Large Quantity Generators, more that 1000 kg of hazardous waste/month (Resource Conservation and Recovery Act (tracking hazardous waste)) Business SIC classification: ELECTRIC AND OTHER SERVICES COMBINED Business NAICS classification: ELECTRIC POWER DISTRIBUTION. Organizations: CONSOLIDATED EDISON COMPANY OF NY, INC. (CONTACT/OPERATOR)
, CONSOLIDATED EDISON CO OF NY (CONTACT/OWNER)
Alternative names: CON EDISON - DUNWOODIE SUB, CONSOLIDATED EDISON CHEM LAB, DUNWOODIE CENTRAL SUBSTATION
GIDRON CADILLAC OLDSMOBILE (1245 CENTRAL PARK AVE in YONKERS, NY)
(Resource Conservation and Recovery Act (tracking hazardous waste)) Alternative names: CHAMPION CADILLAC OLDSMOBILE, COLONIAL CADILLAC SALES INC
CON EDISON - FEEDERS 99031 & 99032 (MARCO & SMART AVE in YONKERS, NY)
Large Quantity Generators, more that 1000 kg of hazardous waste/month (Resource Conservation and Recovery Act (tracking hazardous waste)) Organizations: CON EDISON CO ON NY (CONTACT/OPERATOR)
AMOCO SERVICE STATION 5040 (631 YONKERS AVE in YONKERS, NY)
(Resource Conservation and Recovery Act (tracking hazardous waste))
CON ED-MH 2079 (ST JOHNS AVE in YONKERS, NY)
HAZARDOUS WASTE BIENNIAL REPORTER (Resource Conservation and Recovery Act (tracking hazardous waste)) (Resource Conservation and Recovery Act (tracking hazardous waste))
GETTY PETROLEUM CORP (1800 CENTRAL AVE in YONKERS, NY)
(Resource Conservation and Recovery Act (tracking hazardous waste))
GETTY PETROLEUM CORP (1115 YONKERS AVE in YONKERS, NY)
(Resource Conservation and Recovery Act (tracking hazardous waste))
CORNELL UNIVERSITY EQUINE DRUG (YONKERS RACEWAY LAB CEN AVE in YONKERS, NY)
(Resource Conservation and Recovery Act (tracking hazardous waste))
Housing units lacking complete plumbing facilities: 0.7% Housing units lacking complete kitchen facilities: 1.1%
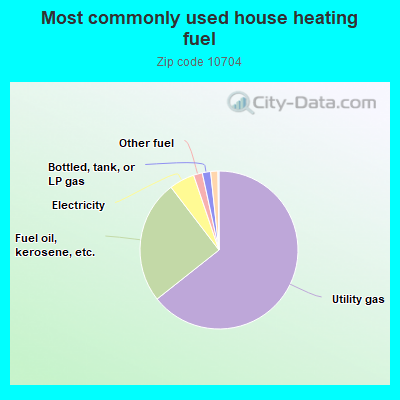
64.4%Utility gas
25.3%Fuel oil, kerosene, etc.
5.2%Electricity
1.8%Other fuel
1.7%Bottled, tank, or LP gas
1.5%No fuel used
Population in 1990: 31,604.
Place of birth for U.S.-born residents:
This state: 18,253
Northeast: 1,647
Midwest: 428
South: 475
West: 256
69% of the 10704 zip code residents lived in the same house 5 years ago. Out of people who lived in different houses, 57% lived in this county. Out of people who lived in different counties, 50% lived in New York.
92% of the 10704 zip code residents lived in the same house 1 year ago. Out of people who lived in different houses, 40% moved from this county. Out of people who lived in different houses, 40% moved from different county within same state. Out of people who lived in different houses, 20% moved from different state. Out of people who lived in different houses, 1% moved from abroad.
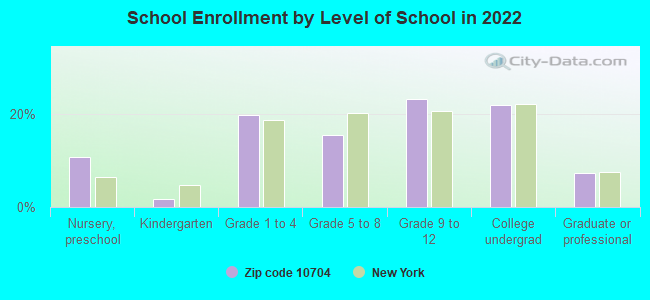
Private vs. public school enrollment:
Students in private schools in grades 1 to 8 (elementary and middle school): 491
Here:
19.7%
New York:
15.6%
Students in private schools in grades 9 to 12 (high school): 358
Here:
22.0%
New York:
15.0%
Students in private undergraduate colleges: 613
Here:
39.8%
New York:
39.2%
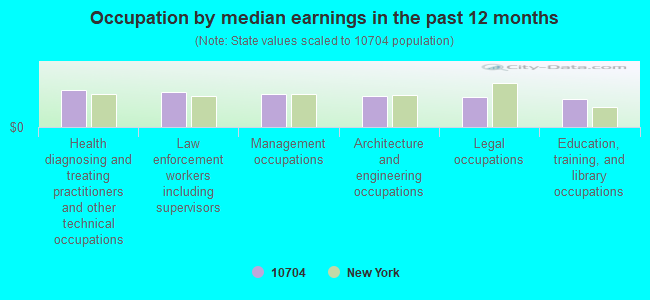
Occupation by median earnings in the past 12 months ($)
102,177Health diagnosing and treating practitioners and other technical occupations
96,729Law enforcement workers including supervisors
90,810Management occupations
83,657Architecture and engineering occupations
80,962Legal occupations
75,361Education, training, and library occupations
Companies with federal contracts located in this zip code:
WENLAB USA, INC (999 CENTRAL PARK AVENUE in YONKERS, NY; small business) : $2,842,193 in 9 contractsfrom 2002 to 2003
Contracts for Engineering and Technical Services, ADPE System Configuration, ADP Central Processing Unit (CPU, Computer), Analog, ADP Central Processing Unit (CPU, Computer), Digital, and moreby Navy, Air Force, Army, U.S. Army Corps of Engineers - civil program financing only, and others Signed by year:2000: $0; 2001: $0; 2002: $2,727,192; 2003: $115,001; 2004: $0; 2005: $0; 2006: $0.
Biggest contracts:
$2,727,192 with Navy for Engineering and Technical Services. Taking place in MD. Signed on 2002-05-28. Completion date: 2003-09-06.
$42,400 with Air Force for ADPE System Configuration. Signed on 2003-05-16. Completion date: 2003-06-16.
$36,608, same as above.Signed on 2003-06-11. Completion date: 2003-09-30.
$33,720 with Air Force for ADP Central Processing Unit (CPU, Computer), Analog. Signed on 2003-03-07. Completion date: 2003-04-07.
YONKERS CONTRACTING COMPANY, I (969 MIDLAND AVENUE in YONKERS, NY; small business) : $3,387 in 2 contractsfrom 2001 to 2003
$3,387 with Army for Carpet Laying and Cleaning. Signed on 2003-09-30. Completion date: 2003-10-30.
$0 with Army for Mineral Construction Materials, Bulk. Signed on 2001-11-29. Completion date: 2003-11-30.
Top industries in this zip code by the number of employees in 2005:
Construction: Other Heavy and Civil Engineering Construction (250-499 employees: 1 establishment, 20-49 employees: 1 establishment)
2002 - 2018 National Fire Incident Reporting System (NFIRS) incidents
According to the data from the years 2002 - 2018 the average number of fires per year is 76. The highest number of reported fire incidents - 200 took place in 2017, and the least - 0 in 2007. The data has a growing trend.
When looking into fire subcategories, the most incidents belonged to: Structure Fires (73.8%), and Outside Fires (14.2%).
Fire incident types reported to NFIRS in Zip Code 10704
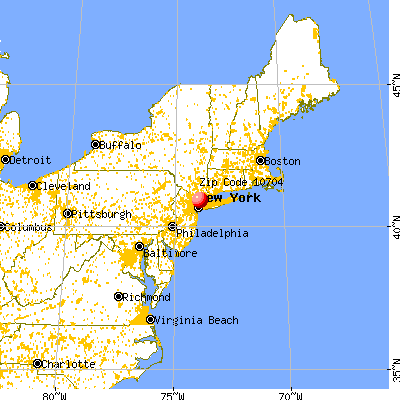


 Nearest zip codes: 10705, 10550, 10701, 10470, 10466, 10552.


 According to the data from the years 2002 - 2018 the average number of fires per year is 76. The highest number of reported fire incidents - 200 took place in 2017, and the least - 0 in 2007. The data has a growing trend.
 When looking into fire subcategories, the most incidents belonged to: Structure Fires (73.8%), and Outside Fires (14.2%).