Estimated zip code population in 2022: 38,244 Zip code population in 2010: 38,777 Zip code population in 2000: 38,115
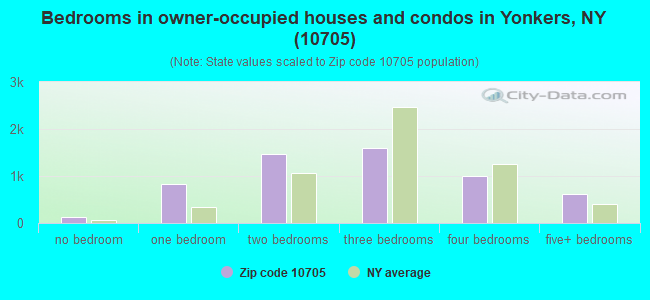
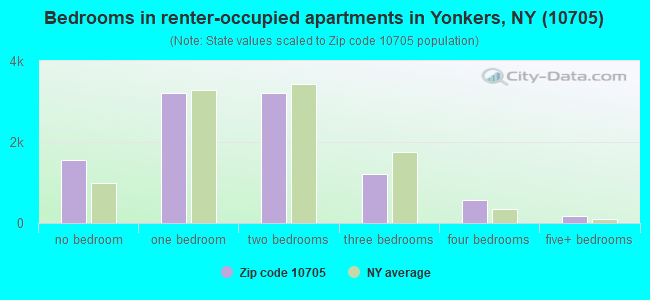
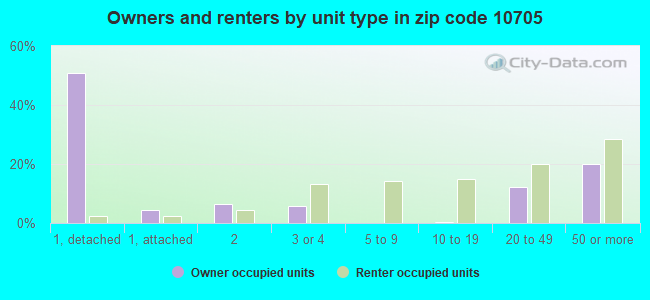
Houses and condos: 15,865 Renter-occupied apartments: 9,850
% of renters here:
64%
State:
46%
March 2022 cost of living index in zip code 10705: 150.5 (very high, U.S. average is 100)
Land area: 2.2 sq. mi. Water area: 0.0 sq. mi.
Population density: 17,280 people per square mile
(very high).
OSM Map
General Map
Google Map
MSN Map
OSM Map
General Map
Google Map
MSN Map
OSM Map
General Map
Google Map
MSN Map
OSM Map
General Map
Google Map
MSN Map
Please wait while loading the map...
Real estate property taxes paid for housing units in 2022:
This zip code:
1.9% ($9,070)
New York:
1.5% ($6,180)
Median real estate property taxes paid for housing units with mortgages in 2022: $8,783 (2.0%) Median real estate property taxes paid for housing units with no mortgage in 2022: $9,574 (1.8%)
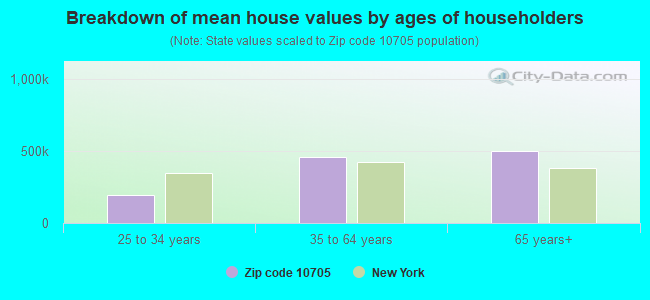
Estimated median house/condo value in 2022: $466,699
10705:
$466,699
New York:
$400,400
According to our research of New York and other state lists, there were 31 registered sex offenders living in 10705 zip code as of April 27, 2024. The ratio of all residents to sex offenders in zip code 10705 is 1,342 to 1. The ratio of registered sex offenders to all residents in this zip code is lower than the state average.
Median resident age:
This zip code:
38.9 years
New York median age:
40.0 years
Average household size:
This zip code:
2.5 people
New York:
2.5 people
Averages for the 2020 tax year for zip code 10705, filed in 2021:
Average Adjusted Gross Income (AGI) in 2020: $50,082 (Individual Income Tax Returns)
Here:
$50,082
State:
$90,930
Salary/wage: $48,015 (reported on 78.6% of returns)
Here:
$48,015
State:
$72,104
(% of AGI for various income ranges: 999.4% for AGIs below $25k, 3432.3% for AGIs $25k-50k, 6830.1% for AGIs $50k-75k, 10271.6% for AGIs $75k-100k, 18547.6% for AGIs $100k-200k, 70738.8% for AGIs over 200k)
Taxable interest for individuals: $1,209 (reported on 19.2% of returns)
This zip code:
$1,209
New York:
$3,075
(% of AGI for various income ranges: 7.3% for AGIs below $25k, 8.9% for AGIs $25k-50k, 21.3% for AGIs $50k-75k, 66.0% for AGIs $75k-100k, 150.3% for AGIs $100k-200k, 781.9% for AGIs over 200k)
Ordinary dividends: $5,887 (reported on 8.9% of returns)
Here:
$5,887
State:
$11,095
(% of AGI for various income ranges: 9.5% for AGIs below $25k, 10.5% for AGIs $25k-50k, 43.4% for AGIs $50k-75k, 119.9% for AGIs $75k-100k, 400.6% for AGIs $100k-200k, 2128.1% for AGIs over 200k)
Net capital gain/loss in AGI: +$12,218 (reported on 8.8% of returns)
Here:
+$12,218
State:
+$44,925
(% of AGI for various income ranges: 2.8% for AGIs below $25k, 9.1% for AGIs $25k-50k, 32.5% for AGIs $50k-75k, 96.2% for AGIs $75k-100k, 322.1% for AGIs $100k-200k, 10134.4% for AGIs over 200k)
Profit/loss from business: +$6,844 (reported on 19.5% of returns)
Here:
+$6,844
State:
+$14,940
(% of AGI for various income ranges: 226.7% for AGIs below $25k, 101.1% for AGIs $25k-50k, 93.4% for AGIs $50k-75k, 145.9% for AGIs $75k-100k, 374.0% for AGIs $100k-200k, 1796.9% for AGIs over 200k)
Taxable individual retirement arrangement distribution: $16,903 (reported on 3.1% of returns)
10705:
$16,903
New York:
$19,609
(% of AGI for various income ranges: 13.1% for AGIs below $25k, 20.5% for AGIs $25k-50k, 63.3% for AGIs $50k-75k, 142.4% for AGIs $75k-100k, 378.0% for AGIs $100k-200k, 1560.0% for AGIs over 200k)
Self-employed (Keogh) retirement plans: $18,400 (reported on 0.2% of returns)
10705:
$18,400
New York:
$32,497
(% of AGI for various income ranges: 5.2% for AGIs below $25k, 287.5% for AGIs over 200k)
Total itemized deductions: $29,232 (reported on 6.9% of returns)
Here:
$29,232
State:
$39,326
(% of AGI for various income ranges: 32.1% for AGIs below $25k, 66.0% for AGIs $25k-50k, 278.5% for AGIs $50k-75k, 562.6% for AGIs $75k-100k, 1565.0% for AGIs $100k-200k, 5515.6% for AGIs over 200k)
Charity contributions: $6,481 (reported on 5.6% of returns)
Here:
$6,481
State:
$15,420
(% of AGI for various income ranges: 1.7% for AGIs below $25k, 6.3% for AGIs $25k-50k, 36.1% for AGIs $50k-75k, 85.4% for AGIs $75k-100k, 291.2% for AGIs $100k-200k, 1521.2% for AGIs over 200k)
Taxes paid: $8,729 (reported on 6.9% of returns)
10705:
$8,729
State:
$9,183
(% of AGI for various income ranges: 8.5% for AGIs below $25k, 17.3% for AGIs $25k-50k, 79.6% for AGIs $50k-75k, 186.4% for AGIs $75k-100k, 503.9% for AGIs $100k-200k, 1461.9% for AGIs over 200k)
Earned income credit: $2,388 (reported on 21.9% of returns)
Here:
$2,388
State:
$2,138
(% of AGI for various income ranges: 129.8% for AGIs below $25k, 78.6% for AGIs $25k-50k, 0.9% for AGIs $50k-75k)
Percentage of individuals using paid preparers for their 2020 taxes: 94.5%
Here:
95%
State:
95%
(% for various income ranges: 92.2% for AGIs below $25k, 96.6% for AGIs $25k-50k, 95.9% for AGIs $50k-75k, 95.0% for AGIs $75k-100k, 94.4% for AGIs $100k-200k, 98.0% for AGIs over 200k)
Averages for the 2012 tax year for zip code 10705, filed in 2013:
Average Adjusted Gross Income (AGI) in 2012: $44,421 (Individual Income Tax Returns)
Here:
$44,421
State:
$77,088
Salary/wage: $42,585 (reported on 82.2% of returns)
Here:
$42,585
State:
$60,593
(% of AGI for various income ranges: 71.2% for AGIs below $25k, 88.4% for AGIs $25k-50k, 86.1% for AGIs $50k-75k, 81.2% for AGIs $75k-100k, 78.1% for AGIs $100k-200k, 62.0% for AGIs over 200k)
Taxable interest for individuals: $1,217 (reported on 22.3% of returns)
This zip code:
$1,217
New York:
$3,125
(% of AGI for various income ranges: 0.6% for AGIs below $25k, 0.4% for AGIs $25k-50k, 0.5% for AGIs $50k-75k, 0.6% for AGIs $75k-100k, 0.8% for AGIs $100k-200k, 0.8% for AGIs over 200k)
Ordinary dividends: $4,388 (reported on 10.4% of returns)
Here:
$4,388
State:
$10,299
(% of AGI for various income ranges: 0.6% for AGIs below $25k, 0.6% for AGIs $25k-50k, 0.7% for AGIs $50k-75k, 1.0% for AGIs $75k-100k, 1.5% for AGIs $100k-200k, 1.6% for AGIs over 200k)
Net capital gain/loss in AGI: +$5,520 (reported on 8.1% of returns)
Here:
+$5,520
State:
+$42,474
(% of AGI for various income ranges: 1.0% for AGIs $100k-200k, 5.9% for AGIs over 200k)
Profit/loss from business: +$10,230 (reported on 17.7% of returns)
Here:
+$10,230
State:
+$16,168
(% of AGI for various income ranges: 17.6% for AGIs below $25k, 2.2% for AGIs $25k-50k, 1.2% for AGIs $50k-75k, 1.9% for AGIs $75k-100k, 2.2% for AGIs $100k-200k, 3.0% for AGIs over 200k)
Taxable individual retirement arrangement distribution: $12,986 (reported on 5.0% of returns)
10705:
$12,986
New York:
$17,621
(% of AGI for various income ranges: 1.0% for AGIs below $25k, 0.9% for AGIs $25k-50k, 1.1% for AGIs $50k-75k, 1.8% for AGIs $75k-100k, 2.2% for AGIs $100k-200k, 1.5% for AGIs over 200k)
Self-employment retirement plans: $17,350 (reported on 0.3% of returns)
10705:
$17,350
New York:
$27,330
Total itemized deductions: $23,187 (25% of AGI, reported on 29.1% of returns)
Here:
$23,187
State:
$34,985
Here:
25.5% of AGI
State:
21.3% of AGI
(% of AGI for various income ranges: 5.7% for AGIs below $25k, 11.8% for AGIs $25k-50k, 15.6% for AGIs $50k-75k, 18.6% for AGIs $75k-100k, 20.0% for AGIs $100k-200k, 17.6% for AGIs over 200k)
Charity contributions: $3,238 (reported on 24.7% of returns)
Here:
$3,238
State:
$5,572
(% of AGI for various income ranges: 0.4% for AGIs below $25k, 1.4% for AGIs $25k-50k, 2.1% for AGIs $50k-75k, 2.3% for AGIs $75k-100k, 2.2% for AGIs $100k-200k, 2.2% for AGIs over 200k)
Taxes paid: $9,749 (reported on 29.1% of returns)
10705:
$9,749
State:
$18,656
(% of AGI for various income ranges: 1.7% for AGIs below $25k, 3.0% for AGIs $25k-50k, 5.6% for AGIs $50k-75k, 7.6% for AGIs $75k-100k, 9.6% for AGIs $100k-200k, 10.5% for AGIs over 200k)
Earned income credit: $2,524 (reported on 29.4% of returns)
Here:
$2,524
State:
$2,230
(% of AGI for various income ranges: 10.7% for AGIs below $25k, 1.3% for AGIs $25k-50k)
Percentage of individuals using paid preparers for their 2012 taxes: 75.7%
Here:
76%
State:
66%
(% for various income ranges: 75.6% for AGIs below $25k, 75.2% for AGIs $25k-50k, 75.5% for AGIs $50k-75k, 76.8% for AGIs $75k-100k, 78.1% for AGIs $100k-200k, 75.9% for AGIs over 200k)
Averages for the 2004 tax year for zip code 10705, filed in 2005:
Average Adjusted Gross Income (AGI) in 2004: $38,891 (Individual Income Tax Returns)
Here:
$38,891
State:
$59,519
Salary/wage: $37,163 (reported on 82.9% of returns)
Here:
$37,163
State:
$50,673
(% of AGI for various income ranges: 95.2% for AGIs below $10k, 78.4% for AGIs $10k-25k, 89.7% for AGIs $25k-50k, 85.9% for AGIs $50k-75k, 81.2% for AGIs $75k-100k, 64.3% for AGIs over 100k)
Taxable interest for individuals: $1,827 (reported on 36.4% of returns)
This zip code:
$1,827
New York:
$2,377
(% of AGI for various income ranges: 15.4% for AGIs below $10k, 1.7% for AGIs $10k-25k, 1.1% for AGIs $25k-50k, 1.2% for AGIs $50k-75k, 1.2% for AGIs $75k-100k, 1.9% for AGIs over 100k)
Taxable dividends: $3,368 (reported on 15.7% of returns)
Here:
$3,368
State:
$5,394
(% of AGI for various income ranges: 2.8% for AGIs below $10k, 1.0% for AGIs $10k-25k, 0.7% for AGIs $25k-50k, 1.1% for AGIs $50k-75k, 1.5% for AGIs $75k-100k, 2.1% for AGIs over 100k)
Net capital gain/loss: +$7,137 (reported on 9.9% of returns)
Here:
+$7,137
State:
+$23,581
(% of AGI for various income ranges: -1.6% for AGIs below $10k, 0.3% for AGIs $10k-25k, 0.3% for AGIs $25k-50k, 0.4% for AGIs $50k-75k, 0.7% for AGIs $75k-100k, 5.4% for AGIs over 100k)
Profit/loss from business: +$8,833 (reported on 15.6% of returns)
Here:
+$8,833
State:
+$13,809
(% of AGI for various income ranges: 38.2% for AGIs below $10k, 10.2% for AGIs $10k-25k, 1.7% for AGIs $25k-50k, 0.7% for AGIs $50k-75k, 1.3% for AGIs $75k-100k, 2.8% for AGIs over 100k)
IRA payment deduction: $3,079 (reported on 1.9% of returns)
10705:
$3,079
New York:
$3,115
(% of AGI for various income ranges: 0.2% for AGIs below $10k, 0.1% for AGIs $10k-25k, 0.2% for AGIs $25k-50k, 0.1% for AGIs $50k-75k, 0.2% for AGIs $75k-100k, 0.1% for AGIs over 100k)
Self-employed pension: $12,800 (reported on 0.4% of returns)
Here:
$12,800
New York:
$19,016
Total itemized deductions: $19,426 (26% of AGI, reported on 31.5% of returns)
Here:
$19,426
State:
$25,864
Here:
25.7% of AGI
State:
21.9% of AGI
(% of AGI for various income ranges: 8.7% for AGIs below $10k, 7.1% for AGIs $10k-25k, 14.8% for AGIs $25k-50k, 18.1% for AGIs $50k-75k, 19.5% for AGIs $75k-100k, 17.5% for AGIs over 100k)
Charity contributions deductions: $3,077 (4% of AGI, reported on 28.8% of returns)
Here:
$3,077
State:
$4,439
Here:
3.9% of AGI
State:
3.6% of AGI
(% of AGI for various income ranges: 0.7% for AGIs below $10k, 0.9% for AGIs $10k-25k, 2.2% for AGIs $25k-50k, 2.8% for AGIs $50k-75k, 2.9% for AGIs $75k-100k, 2.4% for AGIs over 100k)
Total tax: $5,618 (reported on 69.2% of returns)
10705:
$5,618
State:
$11,730
(% of AGI for various income ranges: 6.4% for AGIs below $10k, 3.6% for AGIs $10k-25k, 6.0% for AGIs $25k-50k, 9.3% for AGIs $50k-75k, 11.0% for AGIs $75k-100k, 16.4% for AGIs over 100k)
Earned income credit: $1,999 (reported on 27.1% of returns)
Here:
$1,999
State:
$1,757
Percentage of individuals using paid preparers for their 2004 taxes: 75.2%
Here:
75%
State:
67%
(% for various income ranges: 72.1% for AGIs below $10k, 78.4% for AGIs $10k-25k, 74.9% for AGIs $25k-50k, 72.4% for AGIs $50k-75k, 77.1% for AGIs $75k-100k, 76.2% for AGIs over 100k)
Likely homosexual households (counted as self-reported same-sex unmarried-partner households)
Lesbian couples: 0.3% of all households
Gay men: 0.1% of all households
Household received Food Stamps/SNAP in the past 12 months: 4,588 Household did not receive Food Stamps/SNAP in the past 12 months: 11,077
Women who had a birth in the past 12 months: 224 (164 now married, 59 unmarried) Women who did not have a birth in the past 12 months: 8,456 (3,303 now married, 5,141 unmarried)
Housing units in zip code 10705 with a mortgage: 3,312 (240 second mortgage, 230 both second mortgage and home equity loan) Houses without a mortgage: 67
Median monthly owner costs for units with a mortgage: $2,803 Median monthly owner costs for units without a mortgage: $1,309
Residents with income below the poverty level in 2022:
This zip code:
19.1%
Whole state:
14.3%
Residents with income below 50% of the poverty level in 2022:
This zip code:
9.4%
Whole state:
6.8%
Median number of rooms in houses and condos:
Here:
5.8
State:
6.3
Median number of rooms in apartments:
Here:
3.8
State:
3.8
Notable locations in this zip code not listed on our city pages
Notable locations in zip code 10705: Yonkers Joint Wastewater Treatment Plant (A), Ludlow Station (B), Watts Home (C), Yonkers Fire Department Station 4 (D), Saint Michael's Home Adult Care Facility (E). Display/hide their locations on the map
Churches in zip code 10705 include: Temple Emanu-el (A), Our Lady of Fatima Center (B), Seventh Day Adventist Church (C), Greek Orthodox Church (D), Indian Assembly of God (E), Saint Denis Church (F), Abundant Life Christian Center (G), Resurrection Deliverance Church (H), Temple Emanuel (I). Display/hide their locations on the map
Parks in zip code 10705 include: Clemens Memorial Park (1), Leslie Sutherland Park (2), Culver Park (3), Martin J Fay Memorial Park (4), Pelton Field Park And Playground (5), Lewis Conor Park (6), Caryl Avenue Park (7), Heafy Park (8), Joseph E Pickett Memorial Playground (9). Display/hide their locations on the map
In group quarters: 233 (-1 institutionalized population)
Size of family households: 2,884 2-persons, 2,576 3-persons, 1,778 4-persons, 627 5-persons, 836 6-persons, 319 7-or-more-persons
Size of nonfamily households: 5,410 1-person, 660 2-persons, 273 3-persons
4,091 married couples with children.
2,854 single-parent households (456 men, 2,398 women).
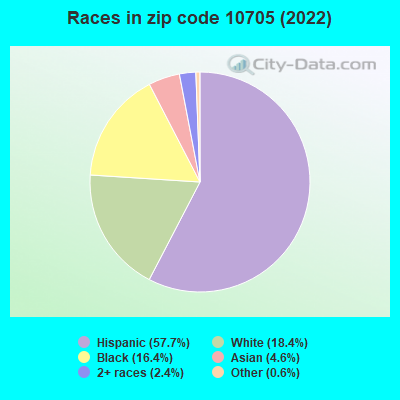
39.5% of residents of 10705 zip code speak English at home.
50.1% of residents speak Spanish at home (54% very well, 18% well, 16% not well, 12% not at all).
3.9% of residents speak other Indo-European language at home (74% very well, 15% well, 10% not well, 1% not at all).
3.6% of residents speak Asian or Pacific Island language at home (58% very well, 5% well, 35% not well, 1% not at all).
2.9% of residents speak other language at home (74% very well, 15% well, 12% not well).
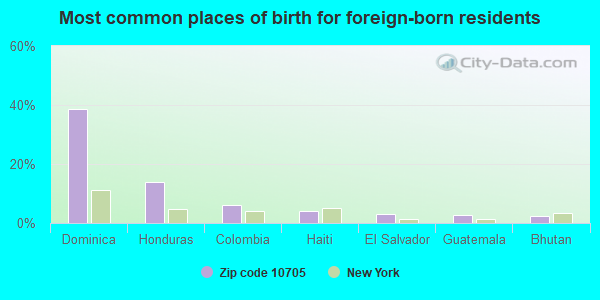
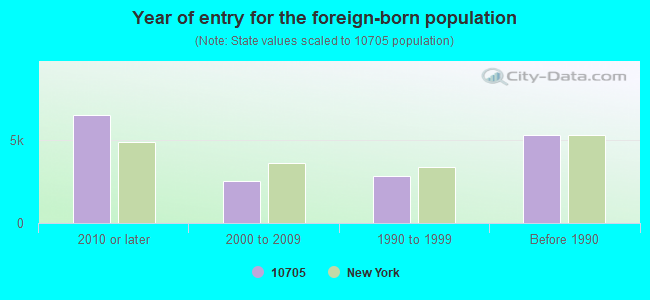
Foreign born population: 15,008 (39.2%) (59.5% of them are naturalized citizens)
Major facilities with environmental interests located in this zip code:
COSMETIC CAR CARE INC (320 RIVERDALE AVE in YONKERS, NY)
AIR MINOR (AIRS/AFS) STATE MASTER (New York facility tracking) - AIR PROGRAM, HAZARDOUS WASTE PROGRAM, Conditionally Exempt Small Quantity Generators, less than 100 kg/month of hazardous waste (Resource Conservation and Recovery Act (tracking hazardous waste)) - notification Business SIC classification: TOP, BODY, AND UPHOLSTERY REPAIR SHOPS AND PAINT SHOPS Organizations: JULIE K KANE (CONTACT/OWNER)
25 SUNNYSIDE DR (25 SUNNYSIDE DR in YONKERS, NY)
AIR MINOR (AIRS/AFS) STATE MASTER (New York facility tracking) - AIR PROGRAM, Business SIC classification: OPERATORS OF APARTMENT BUILDINGS Business NAICS classification: LESSORS OF RESIDENTIAL BUILDINGS AND DWELLINGS. Organizations: PRIME LOCATIONS INC (AIR FEE BILLING CONTACT)
, WINCREST TENANTS CORP (LEGALLY RESPONSIBLE PARTY)
GETTY (311 MCLEAN AVE in YONKERS, NY)
STATE MASTER (New York facility tracking) - AIR PROGRAM (Resource Conservation and Recovery Act (tracking hazardous waste)) Organizations: GETTY OIL CORP (CONTACT/OPERATOR)
, GETTY PETROLEUM MARKETING INC (LEGALLY RESPONSIBLE PARTY)
Alternative names: GETTY SERVICE STATION
COLLISION SPECIALIST INC (999 SAW MILL RIVER RD in YONKERS, NY)
STATE MASTER (New York facility tracking) - AIR PROGRAM, (Resource Conservation and Recovery Act (tracking hazardous waste)) Alternative names: CUSTOM AUTO BODY
CON EDISON (VALENTINE LANE & RIVERDALE AVE in YONKERS, NY)
(Resource Conservation and Recovery Act (tracking hazardous waste))
CON ED - M/H 2054 (CARYL AVE in YONKERS, NY)
HAZARDOUS WASTE BIENNIAL REPORTER (Resource Conservation and Recovery Act (tracking hazardous waste)) (Resource Conservation and Recovery Act (tracking hazardous waste))
CON ED - V 2055 (W VAN CORTLAND PK AVE in YONKERS, NY)
HAZARDOUS WASTE BIENNIAL REPORTER (Resource Conservation and Recovery Act (tracking hazardous waste)) (Resource Conservation and Recovery Act (tracking hazardous waste))
CON ED-MH 2057 (CARYL AVE 400' W/O MCLEAN AVE in YONKERS, NY)
HAZARDOUS WASTE BIENNIAL REPORTER (Resource Conservation and Recovery Act (tracking hazardous waste)) (Resource Conservation and Recovery Act (tracking hazardous waste))
CON ED-MH 2063 (MCLEAN AVE & TIBBETTS RD in YONKERS, NY)
HAZARDOUS WASTE BIENNIAL REPORTER (Resource Conservation and Recovery Act (tracking hazardous waste)) (Resource Conservation and Recovery Act (tracking hazardous waste))
CON ED-MH 2065 (LANTON ST & TIBBETTS RD in YONKERS, NY)
HAZARDOUS WASTE BIENNIAL REPORTER (Resource Conservation and Recovery Act (tracking hazardous waste)) (Resource Conservation and Recovery Act (tracking hazardous waste))
Housing units lacking complete plumbing facilities: 0.7% Housing units lacking complete kitchen facilities: 1.5%
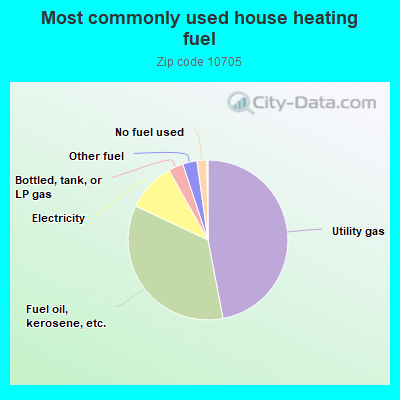
47.0%Utility gas
35.0%Fuel oil, kerosene, etc.
9.9%Electricity
3.0%Bottled, tank, or LP gas
2.9%Other fuel
2.0%No fuel used
Population in 1990: 36,141. Population change in the 1990s: +1,974 (+5.5%).
Place of birth for U.S.-born residents:
This state: 19,359
Northeast: 731
Midwest: 162
South: 860
West: 331
59% of the 10705 zip code residents lived in the same house 5 years ago. Out of people who lived in different houses, 62% lived in this county. Out of people who lived in different counties, 50% lived in New York.
92% of the 10705 zip code residents lived in the same house 1 year ago. Out of people who lived in different houses, 54% moved from this county. Out of people who lived in different houses, 37% moved from different county within same state. Out of people who lived in different houses, 2% moved from different state. Out of people who lived in different houses, 6% moved from abroad.
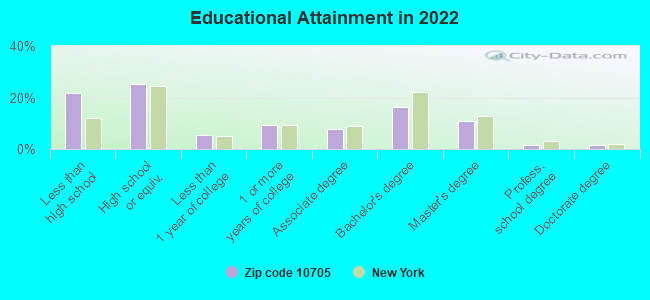
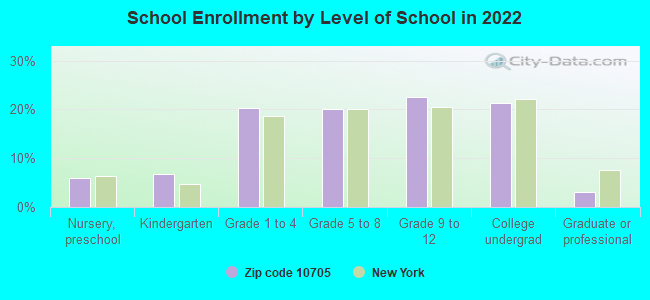
Private vs. public school enrollment:
Students in private schools in grades 1 to 8 (elementary and middle school): 483
Here:
12.7%
New York:
15.6%
Students in private schools in grades 9 to 12 (high school): 289
Here:
13.6%
New York:
15.0%
Students in private undergraduate colleges: 742
Here:
36.8%
New York:
39.2%
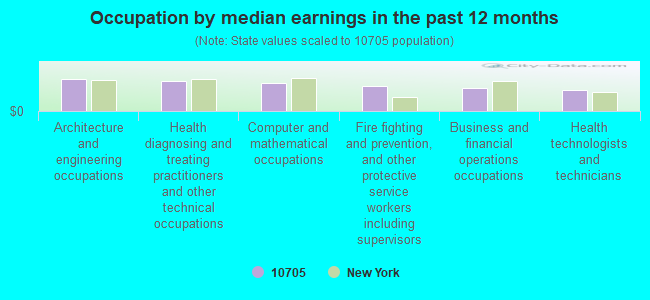
Occupation by median earnings in the past 12 months ($)
110,604Architecture and engineering occupations
105,919Health diagnosing and treating practitioners and other technical occupations
96,558Computer and mathematical occupations
85,171Fire fighting and prevention, and other protective service workers including supervisors
80,870Business and financial operations occupations
73,458Health technologists and technicians
Companies with federal contracts located in this zip code:
AMERICAN SUGAR REFINING INC (1 FEDERAL ST in YONKERS, NY) : $427,462 in 13 contractsfrom 2003 to 2006
Contracts for Sugar, Confectionery, and Nuts by Defense Logistics Agency Signed by year:2000: $0; 2001: $0; 2002: $0; 2003: $101,520; 2004: $172,447; 2005: $136,515; 2006: $16,980.
Biggest contracts:
$101,520 with Defense Logistics Agency for Sugar, Confectionery, and Nuts. Taking place in MD. Signed on 2003-12-23. Completion date: 2004-05-15.
$78,010, same as above.Signed on 2005-01-03. Completion date: 2005-07-15.
$48,000, same as above.Signed on 2004-11-03. Completion date: 2005-01-15.
$48,000, same as above.Signed on 2004-11-04. Completion date: 2005-01-06.
KIMBER MFG INC (1 LAWTON ST in YONKERS, NY) : $103,667 in 5 contractsfrom 2003 to 2004
Contracts for Guns, over 30 mm up to 75 mm, Night Vision Equipment, Emitted and Reflected Radiation, Miscellaneous Weapons, Guns, through 30 mm by Army Signed by year:2000: $0; 2001: $0; 2002: $0; 2003: $77,254; 2004: $26,413; 2005: $0; 2006: $0.
Biggest contracts:
$65,704 with Army for Guns, over 30 mm up to 75 mm. Signed on 2003-05-08. Completion date: 2003-05-16.
$11,793 with Army for Night Vision Equipment, Emitted and Reflected Radiation. Signed on 2004-08-30. Completion date: 2004-10-08.
$11,550 with Army for Miscellaneous Weapons. Signed on 2003-09-24. Completion date: 2003-11-24.
$7,390 with Army for Guns, through 30 mm. Signed on 2004-02-04. Completion date: 2004-03-05.
Top industries in this zip code by the number of employees in 2005:
Health Care and Social Assistance: Child and Youth Services (500-999 employees: 1 establishment)
Real Estate and Rental and Leasing: Lessors of Residential Buildings and Dwellings (100-249: 1, 10-19: 2, 5-9: 1, 1-4: 33)
Other Services (except Public Administration): Religious Organizations (20-49: 1, 10-19: 5, 5-9: 5, 1-4: 10)
Educational Services: Elementary and Secondary Schools (20-49: 3, 10-19: 1)
2002 - 2018 National Fire Incident Reporting System (NFIRS) incidents
According to the data from the years 2002 - 2018 the average number of fires per year is 77. The highest number of reported fire incidents - 178 took place in 2018, and the least - 0 in 2007. The data has a growing trend.
When looking into fire subcategories, the most incidents belonged to: Structure Fires (81.0%), and Outside Fires (12.5%).
Fire incident types reported to NFIRS in Zip Code 10705


 Nearest zip codes: 10471, 10704, 10701, 10470, 10703, 10463.


 According to the data from the years 2002 - 2018 the average number of fires per year is 77. The highest number of reported fire incidents - 178 took place in 2018, and the least - 0 in 2007. The data has a growing trend.
 When looking into fire subcategories, the most incidents belonged to: Structure Fires (81.0%), and Outside Fires (12.5%).