Estimated zip code population in 2022: 21,748 Zip code population in 2010: 19,786 Zip code population in 2000: 19,948
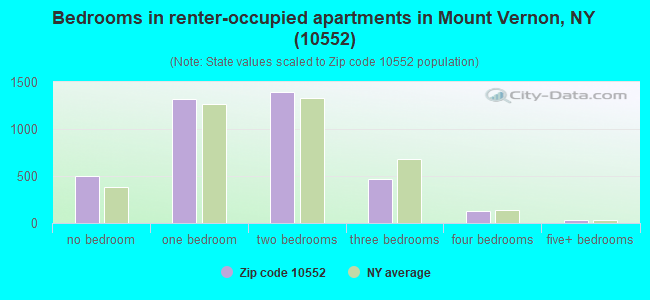
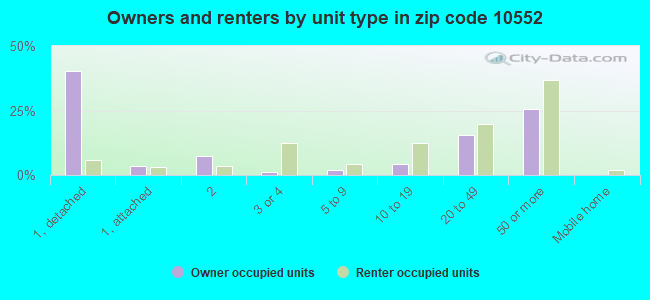
Houses and condos: 10,022 Renter-occupied apartments: 3,830
% of renters here:
40%
State:
46%
March 2022 cost of living index in zip code 10552: 146.8 (very high, U.S. average is 100)
Land area: 1.7 sq. mi. Water area: 0.0 sq. mi.
Population density: 13,124 people per square mile
(very high).
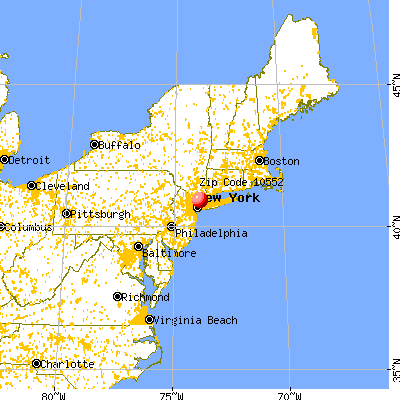
OSM Map
General Map
Google Map
MSN Map
OSM Map
General Map
Google Map
MSN Map
OSM Map
General Map
Google Map
MSN Map
OSM Map
General Map
Google Map
MSN Map
Please wait while loading the map...
Real estate property taxes paid for housing units in 2022:
This zip code:
2.3% ($9,805)
New York:
1.5% ($6,180)
Median real estate property taxes paid for housing units with mortgages in 2022: $9,858 (2.0%) Median real estate property taxes paid for housing units with no mortgage in 2022: $9,755 (2.6%)
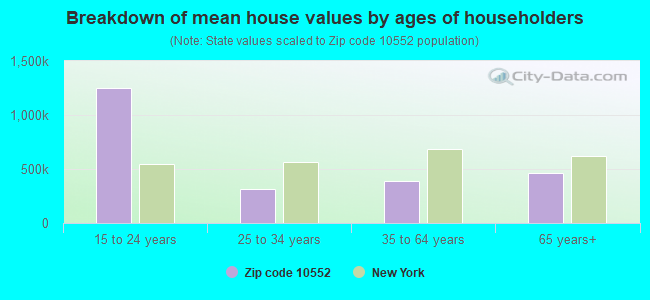
Estimated median house/condo value in 2022: $428,025
10552:
$428,025
New York:
$400,400
According to our research of New York and other state lists, there were 8 registered sex offenders living in 10552 zip code as of April 27, 2024. The ratio of all residents to sex offenders in zip code 10552 is 2,488 to 1. The ratio of registered sex offenders to all residents in this zip code is much lower than the state average.
Median resident age:
This zip code:
44.7 years
New York median age:
40.0 years
Average household size:
This zip code:
2.2 people
New York:
2.5 people
Averages for the 2020 tax year for zip code 10552, filed in 2021:
Average Adjusted Gross Income (AGI) in 2020: $80,303 (Individual Income Tax Returns)
Here:
$80,303
State:
$90,930
Salary/wage: $76,566 (reported on 79.6% of returns)
Here:
$76,566
State:
$72,104
(% of AGI for various income ranges: 1028.8% for AGIs below $25k, 3654.2% for AGIs $25k-50k, 6676.2% for AGIs $50k-75k, 10163.0% for AGIs $75k-100k, 18267.9% for AGIs $100k-200k, 85757.9% for AGIs over 200k)
Taxable interest for individuals: $1,173 (reported on 32.5% of returns)
This zip code:
$1,173
New York:
$3,075
(% of AGI for various income ranges: 17.7% for AGIs below $25k, 16.2% for AGIs $25k-50k, 34.8% for AGIs $50k-75k, 49.3% for AGIs $75k-100k, 105.7% for AGIs $100k-200k, 643.3% for AGIs over 200k)
Ordinary dividends: $4,886 (reported on 19.9% of returns)
Here:
$4,886
State:
$11,095
(% of AGI for various income ranges: 27.2% for AGIs below $25k, 36.3% for AGIs $25k-50k, 66.3% for AGIs $50k-75k, 101.2% for AGIs $75k-100k, 246.3% for AGIs $100k-200k, 2153.3% for AGIs over 200k)
Net capital gain/loss in AGI: +$8,636 (reported on 17.8% of returns)
Here:
+$8,636
State:
+$44,925
(% of AGI for various income ranges: 2.3% for AGIs below $25k, 13.8% for AGIs $25k-50k, 36.9% for AGIs $50k-75k, 145.3% for AGIs $75k-100k, 338.1% for AGIs $100k-200k, 4738.8% for AGIs over 200k)
Profit/loss from business: +$9,450 (reported on 18.2% of returns)
Here:
+$9,450
State:
+$14,940
(% of AGI for various income ranges: 241.8% for AGIs below $25k, 132.0% for AGIs $25k-50k, 108.6% for AGIs $50k-75k, 122.8% for AGIs $75k-100k, 327.3% for AGIs $100k-200k, 2640.0% for AGIs over 200k)
Taxable individual retirement arrangement distribution: $19,309 (reported on 7.3% of returns)
10552:
$19,309
New York:
$19,609
(% of AGI for various income ranges: 49.9% for AGIs below $25k, 59.0% for AGIs $25k-50k, 128.5% for AGIs $50k-75k, 155.6% for AGIs $75k-100k, 449.2% for AGIs $100k-200k, 2283.8% for AGIs over 200k)
Self-employed (Keogh) retirement plans: $28,443 (reported on 0.6% of returns)
10552:
$28,443
New York:
$32,497
(% of AGI for various income ranges: 27.3% for AGIs $50k-75k, 662.1% for AGIs over 200k)
Total itemized deductions: $28,453 (reported on 16.5% of returns)
Here:
$28,453
State:
$39,326
(% of AGI for various income ranges: 95.8% for AGIs below $25k, 170.4% for AGIs $25k-50k, 373.1% for AGIs $50k-75k, 806.5% for AGIs $75k-100k, 1656.9% for AGIs $100k-200k, 6897.1% for AGIs over 200k)
Charity contributions: $7,269 (reported on 13.9% of returns)
Here:
$7,269
State:
$15,420
(% of AGI for various income ranges: 8.9% for AGIs below $25k, 23.1% for AGIs $25k-50k, 63.1% for AGIs $50k-75k, 132.1% for AGIs $75k-100k, 377.5% for AGIs $100k-200k, 1843.3% for AGIs over 200k)
Taxes paid: $8,986 (reported on 16.4% of returns)
10552:
$8,986
State:
$9,183
(% of AGI for various income ranges: 29.4% for AGIs below $25k, 51.6% for AGIs $25k-50k, 115.2% for AGIs $50k-75k, 284.3% for AGIs $75k-100k, 581.8% for AGIs $100k-200k, 1792.5% for AGIs over 200k)
Earned income credit: $1,796 (reported on 10.6% of returns)
Here:
$1,796
State:
$2,138
(% of AGI for various income ranges: 78.5% for AGIs below $25k, 43.2% for AGIs $25k-50k)
Percentage of individuals using paid preparers for their 2020 taxes: 92.7%
Here:
93%
State:
95%
(% for various income ranges: 90.3% for AGIs below $25k, 94.2% for AGIs $25k-50k, 93.0% for AGIs $50k-75k, 93.2% for AGIs $75k-100k, 93.5% for AGIs $100k-200k, 93.5% for AGIs over 200k)
Averages for the 2012 tax year for zip code 10552, filed in 2013:
Average Adjusted Gross Income (AGI) in 2012: $70,921 (Individual Income Tax Returns)
Here:
$70,921
State:
$77,088
Salary/wage: $66,810 (reported on 81.7% of returns)
Here:
$66,810
State:
$60,593
(% of AGI for various income ranges: 63.6% for AGIs below $25k, 81.9% for AGIs $25k-50k, 82.4% for AGIs $50k-75k, 80.6% for AGIs $75k-100k, 79.9% for AGIs $100k-200k, 69.2% for AGIs over 200k)
Taxable interest for individuals: $1,333 (reported on 38.1% of returns)
This zip code:
$1,333
New York:
$3,125
(% of AGI for various income ranges: 1.5% for AGIs below $25k, 0.6% for AGIs $25k-50k, 0.5% for AGIs $50k-75k, 0.6% for AGIs $75k-100k, 0.5% for AGIs $100k-200k, 1.0% for AGIs over 200k)
Ordinary dividends: $4,364 (reported on 21.6% of returns)
Here:
$4,364
State:
$10,299
(% of AGI for various income ranges: 1.8% for AGIs below $25k, 0.9% for AGIs $25k-50k, 1.0% for AGIs $50k-75k, 1.0% for AGIs $75k-100k, 1.3% for AGIs $100k-200k, 1.8% for AGIs over 200k)
Net capital gain/loss in AGI: +$7,291 (reported on 14.9% of returns)
Here:
+$7,291
State:
+$42,474
(% of AGI for various income ranges: 0.2% for AGIs $50k-75k, 0.7% for AGIs $100k-200k, 5.1% for AGIs over 200k)
Profit/loss from business: +$13,098 (reported on 16.7% of returns)
Here:
+$13,098
State:
+$16,168
(% of AGI for various income ranges: 14.8% for AGIs below $25k, 3.2% for AGIs $25k-50k, 1.3% for AGIs $50k-75k, 1.3% for AGIs $75k-100k, 1.5% for AGIs $100k-200k, 4.4% for AGIs over 200k)
Taxable individual retirement arrangement distribution: $17,185 (reported on 9.3% of returns)
10552:
$17,185
New York:
$17,621
(% of AGI for various income ranges: 2.8% for AGIs below $25k, 1.5% for AGIs $25k-50k, 1.6% for AGIs $50k-75k, 2.0% for AGIs $75k-100k, 2.6% for AGIs $100k-200k, 2.6% for AGIs over 200k)
Self-employment retirement plans: $28,783 (reported on 0.6% of returns)
10552:
$28,783
New York:
$27,330
Total itemized deductions: $27,239 (24% of AGI, reported on 47.6% of returns)
Here:
$27,239
State:
$34,985
Here:
24.2% of AGI
State:
21.3% of AGI
(% of AGI for various income ranges: 13.7% for AGIs below $25k, 16.1% for AGIs $25k-50k, 17.2% for AGIs $50k-75k, 19.6% for AGIs $75k-100k, 20.8% for AGIs $100k-200k, 17.5% for AGIs over 200k)
Charity contributions: $3,597 (reported on 42.1% of returns)
Here:
$3,597
State:
$5,572
(% of AGI for various income ranges: 1.0% for AGIs below $25k, 2.0% for AGIs $25k-50k, 2.3% for AGIs $50k-75k, 2.5% for AGIs $75k-100k, 2.5% for AGIs $100k-200k, 1.7% for AGIs over 200k)
Taxes paid: $13,438 (reported on 47.4% of returns)
10552:
$13,438
State:
$18,656
(% of AGI for various income ranges: 5.2% for AGIs below $25k, 5.3% for AGIs $25k-50k, 6.8% for AGIs $50k-75k, 8.8% for AGIs $75k-100k, 10.6% for AGIs $100k-200k, 11.0% for AGIs over 200k)
Earned income credit: $1,847 (reported on 12.3% of returns)
Here:
$1,847
State:
$2,230
(% of AGI for various income ranges: 4.9% for AGIs below $25k, 0.6% for AGIs $25k-50k)
Percentage of individuals using paid preparers for their 2012 taxes: 68.3%
Here:
68%
State:
66%
(% for various income ranges: 64.7% for AGIs below $25k, 68.3% for AGIs $25k-50k, 66.7% for AGIs $50k-75k, 71.3% for AGIs $75k-100k, 71.8% for AGIs $100k-200k, 78.2% for AGIs over 200k)
Averages for the 2004 tax year for zip code 10552, filed in 2005:
Average Adjusted Gross Income (AGI) in 2004: $60,063 (Individual Income Tax Returns)
Here:
$60,063
State:
$59,519
Salary/wage: $57,414 (reported on 82.1% of returns)
Here:
$57,414
State:
$50,673
(% of AGI for various income ranges: 84.4% for AGIs below $10k, 67.5% for AGIs $10k-25k, 84.9% for AGIs $25k-50k, 86.1% for AGIs $50k-75k, 83.6% for AGIs $75k-100k, 72.8% for AGIs over 100k)
Taxable interest for individuals: $1,440 (reported on 57.2% of returns)
This zip code:
$1,440
New York:
$2,377
(% of AGI for various income ranges: 8.0% for AGIs below $10k, 3.1% for AGIs $10k-25k, 1.4% for AGIs $25k-50k, 1.1% for AGIs $50k-75k, 1.3% for AGIs $75k-100k, 1.2% for AGIs over 100k)
Taxable dividends: $2,809 (reported on 30.2% of returns)
Here:
$2,809
State:
$5,394
(% of AGI for various income ranges: 7.0% for AGIs below $10k, 2.5% for AGIs $10k-25k, 1.0% for AGIs $25k-50k, 1.1% for AGIs $50k-75k, 1.0% for AGIs $75k-100k, 1.6% for AGIs over 100k)
Net capital gain/loss: +$6,502 (reported on 22.6% of returns)
Here:
+$6,502
State:
+$23,581
(% of AGI for various income ranges: -4.6% for AGIs below $10k, -0.8% for AGIs $10k-25k, 0.3% for AGIs $25k-50k, 0.4% for AGIs $50k-75k, 1.3% for AGIs $75k-100k, 4.9% for AGIs over 100k)
Profit/loss from business: +$13,821 (reported on 15.1% of returns)
Here:
+$13,821
State:
+$13,809
(% of AGI for various income ranges: 23.7% for AGIs below $10k, 8.8% for AGIs $10k-25k, 2.3% for AGIs $25k-50k, 1.0% for AGIs $50k-75k, 2.2% for AGIs $75k-100k, 4.3% for AGIs over 100k)
IRA payment deduction: $2,846 (reported on 2.8% of returns)
10552:
$2,846
New York:
$3,115
(% of AGI for various income ranges: 0.4% for AGIs below $10k, 0.3% for AGIs $10k-25k, 0.3% for AGIs $25k-50k, 0.1% for AGIs $50k-75k, 0.1% for AGIs $75k-100k, 0.1% for AGIs over 100k)
Self-employed pension: $16,865 (reported on 1.3% of returns)
Here:
$16,865
New York:
$19,016
(% of AGI for various income ranges: 0.1% for AGIs $10k-25k, 0.1% for AGIs $25k-50k, 0.0% for AGIs $50k-75k, 0.3% for AGIs $75k-100k, 0.6% for AGIs over 100k)
Total itemized deductions: $22,418 (25% of AGI, reported on 51.2% of returns)
Here:
$22,418
State:
$25,864
Here:
24.6% of AGI
State:
21.9% of AGI
(% of AGI for various income ranges: 22.4% for AGIs below $10k, 15.9% for AGIs $10k-25k, 18.5% for AGIs $25k-50k, 20.4% for AGIs $50k-75k, 21.7% for AGIs $75k-100k, 18.3% for AGIs over 100k)
Charity contributions deductions: $3,479 (4% of AGI, reported on 48.3% of returns)
Here:
$3,479
State:
$4,439
Here:
3.7% of AGI
State:
3.6% of AGI
(% of AGI for various income ranges: 1.4% for AGIs below $10k, 1.7% for AGIs $10k-25k, 3.1% for AGIs $25k-50k, 3.4% for AGIs $50k-75k, 3.5% for AGIs $75k-100k, 2.4% for AGIs over 100k)
Total tax: $9,707 (reported on 82.5% of returns)
10552:
$9,707
State:
$11,730
(% of AGI for various income ranges: 5.1% for AGIs below $10k, 4.5% for AGIs $10k-25k, 7.5% for AGIs $25k-50k, 10.6% for AGIs $50k-75k, 11.8% for AGIs $75k-100k, 18.1% for AGIs over 100k)
Earned income credit: $1,440 (reported on 9.0% of returns)
Here:
$1,440
State:
$1,757
Percentage of individuals using paid preparers for their 2004 taxes: 68.0%
Here:
68%
State:
67%
(% for various income ranges: 60.9% for AGIs below $10k, 67.3% for AGIs $10k-25k, 67.1% for AGIs $25k-50k, 68.9% for AGIs $50k-75k, 72.0% for AGIs $75k-100k, 73.9% for AGIs over 100k)
Likely homosexual households (counted as self-reported same-sex unmarried-partner households)
Lesbian couples: 0.1% of all households
Gay men: 0.1% of all households
Household received Food Stamps/SNAP in the past 12 months: 1,012 Household did not receive Food Stamps/SNAP in the past 12 months: 8,564
Women who had a birth in the past 12 months: 134 (121 now married, 11 unmarried) Women who did not have a birth in the past 12 months: 5,147 (1,598 now married, 3,562 unmarried)
Housing units in zip code 10552 with a mortgage: 3,602 (188 second mortgage, 15 home equity loan, 175 both second mortgage and home equity loan) Houses without a mortgage: 57
Median monthly owner costs for units with a mortgage: $3,010 Median monthly owner costs for units without a mortgage: $1,358
Residents with income below the poverty level in 2022:
This zip code:
7.1%
Whole state:
14.3%
Residents with income below 50% of the poverty level in 2022:
This zip code:
2.6%
Whole state:
6.8%
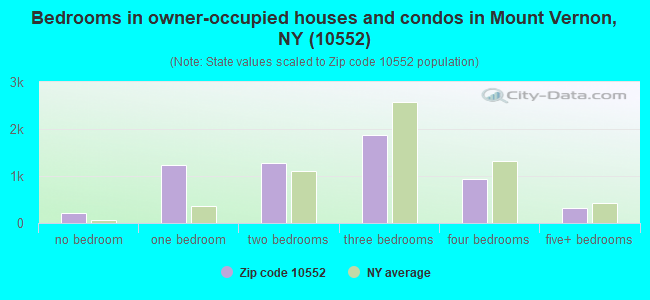
Median number of rooms in houses and condos:
Here:
5.4
State:
6.3
Median number of rooms in apartments:
Here:
3.8
State:
3.8
Notable locations in this zip code not listed on our city pages
Notable locations in zip code 10552: Bronxville Field Club (A), Meadowview at the Wartburg Adult Care Facility (B), The Wartburg Home (C). Display/hide their locations on the map
Churches in zip code 10552 include: Saints Peter and Paul Roman Catholic Church (A), Immanuel Evangelical Lutheran Church (B), Greek Orthodox Church of Saint George (C), Sinai Free Synagogue (D), Westchester Muslim Center (E), United Lutheran Church (F), Friendship Unified Free Will Church (G), First United Methodist Church (H), Community Church at the Circle (I). Display/hide their locations on the map
In group quarters: 428 (-1 institutionalized population)
Size of family households: 2,822 2-persons, 1,332 3-persons, 794 4-persons, 540 5-persons, 183 6-persons, 19 7-or-more-persons
Size of nonfamily households: 3,327 1-person, 617 2-persons, 32 3-persons
2,005 married couples with children.
970 single-parent households (142 men, 828 women).
74.8% of residents of 10552 zip code speak English at home.
12.3% of residents speak Spanish at home (71% very well, 10% well, 14% not well, 5% not at all).
9.3% of residents speak other Indo-European language at home (56% very well, 35% well, 8% not well, 1% not at all).
2.2% of residents speak Asian or Pacific Island language at home (54% very well, 25% well, 14% not well, 7% not at all).
1.3% of residents speak other language at home (76% very well, 22% well, 3% not at all).
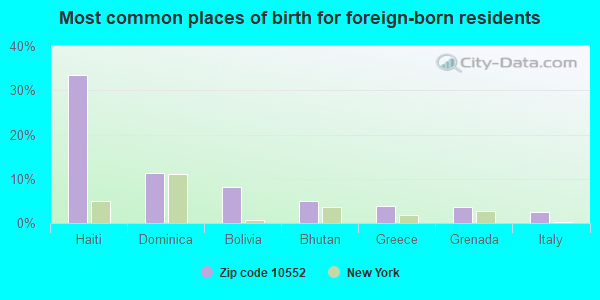
Foreign born population: 5,968 (27.4%) (76.6% of them are naturalized citizens)
This zip code:
27.4%
Whole state:
22.7%
33%Haiti
11%Dominica
8%Bolivia
5%Bhutan
4%Greece
4%Grenada
3%Italy
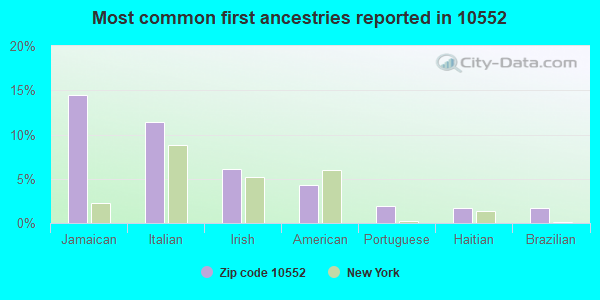
14%Jamaican
11%Italian
6%Irish
4%American
2%Portuguese
2%Haitian
2%Brazilian
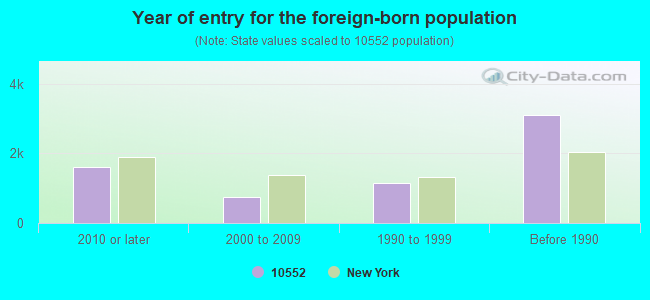
Year of entry for the foreign-born population
1,6092010 or later
7552000 to 2009
1,1511990 to 1999
3,099Before 1990
Private high school in in this zip code not listed on the city page:
Facilities with environmental interests located in this zip code:
J & K DRY CLEANERS (698 LOCUST STREET in MT. VERNON, NY)
AIR MINOR (AIRS/AFS) STATE MASTER (New York facility tracking) - AIR PROGRAM Conditionally Exempt Small Quantity Generators, less than 100 kg/month of hazardous waste (Resource Conservation and Recovery Act (tracking hazardous waste)) - notification TRANSPORTER (Resource Conservation and Recovery Act (tracking hazardous waste)) - notification Business SIC classification: DRYCLEANING PLANTS, EXCEPT RUG CLEANING Business NAICS classification: DRYCLEANING AND LAUNDRY SERVICES (EXCEPT COIN-OPERATED). Organizations: RALPH ZAPPETTI (CONTACT/OWNER)
Alternative names: RALPH S DRY CLEANERS, RALPHS CLEANERS, RALPH'S DRY CLEANERS
19 WILLIAM ST OWNERS CORP (19 WILLIAM ST in MOUNT VERNON, NY)
STATE MASTER (New York facility tracking) - AIR PROGRAM Conditionally Exempt Small Quantity Generators, less than 100 kg/month of hazardous waste (Resource Conservation and Recovery Act (tracking hazardous waste)) Business SIC classification: OPERATORS OF APARTMENT BUILDINGS Business NAICS classification: LESSORS OF RESIDENTIAL BUILDINGS AND DWELLINGS. Organizations: ANKER MANAGEMENT CORP (CONTACT/OPERATOR)
, 19 WILLIAM STREET OWNERS CORP (CONTACT/OWNER)
Alternative names: 19 WILLIAM STREET OWNERS CORP
55 EHRBAR TENANTS CO (55 EHRBAR AVE in MT VERNON, NY)
STATE MASTER (New York facility tracking) - AIR PROGRAM Small Quantity Generators, between 100 kg and 1000 kg of hazardous waste/month (Resource Conservation and Recovery Act (tracking hazardous waste)) - notification Business SIC classification: OPERATORS OF APARTMENT BUILDINGS Business NAICS classification: LESSORS OF RESIDENTIAL BUILDINGS AND DWELLINGS. Organizations: 55 EHRBAR TENANTS CORP (CONTACT/OWNER)
ALFRED M. FRANKO MS ( in MOUNT VERNON, NY)
(National Center for Education Statistics) - STATE ID-660900010023 Organizations: MT VERNON CITY SD (SCHOOL DISTRICT)
CON EDISON - TM 3040 (GRANATEN AVE & CEDAR ST in MOUNT VERNON, NY)
Large Quantity Generators, more that 1000 kg of hazardous waste/month (Resource Conservation and Recovery Act (tracking hazardous waste)) Organizations: CONSOLIDATED EDISON COMPANY OF NY, INC. (CONTACT/OPERATOR)
CON ED - FLEETWOOD AVE & GRAMATAN AVE (FLEETWOOD AVE & GRAMATAN AVE in MT VERNON, NY)
HAZARDOUS WASTE BIENNIAL REPORTER (Resource Conservation and Recovery Act (tracking hazardous waste)) (Resource Conservation and Recovery Act (tracking hazardous waste))
AFS DESIGNS & CONSTRUCTION INC (60 W BROAD ST in MOUNT VERNON, NY)
Conditionally Exempt Small Quantity Generators, less than 100 kg/month of hazardous waste (Resource Conservation and Recovery Act (tracking hazardous waste)) Organizations: AUGUST F SATRIALE (CONTACT/OPERATOR)
, 60 WEST BROAD STREET INC (CONTACT/OWNER)
GETTY PETROLEUM CORP (681 E LINCOLN AVE in MOUNT VERNON, NY)
(Resource Conservation and Recovery Act (tracking hazardous waste))
Housing units lacking complete plumbing facilities: 0.5% Housing units lacking complete kitchen facilities: 2.7%
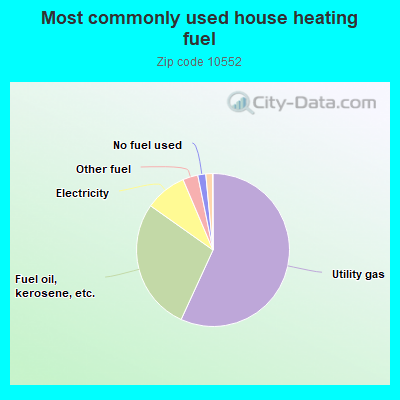
56.9%Utility gas
28.0%Fuel oil, kerosene, etc.
8.8%Electricity
3.2%Other fuel
1.7%No fuel used
1.4%Bottled, tank, or LP gas
Population in 1990: 18,167. Population change in the 1990s: +1,781 (+9.8%).
Place of birth for U.S.-born residents:
This state: 12,898
Northeast: 1,001
Midwest: 292
South: 700
West: 175
63% of the 10552 zip code residents lived in the same house 5 years ago. Out of people who lived in different houses, 58% lived in this county. Out of people who lived in different counties, 50% lived in New York.
93% of the 10552 zip code residents lived in the same house 1 year ago. Out of people who lived in different houses, 40% moved from this county. Out of people who lived in different houses, 44% moved from different county within same state. Out of people who lived in different houses, 15% moved from different state. Out of people who lived in different houses, 1% moved from abroad.
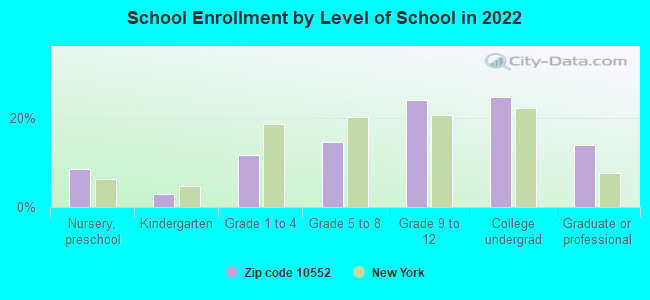
Private vs. public school enrollment:
Students in private schools in grades 1 to 8 (elementary and middle school): 323
Here:
26.7%
New York:
15.6%
Students in private schools in grades 9 to 12 (high school): 429
Here:
38.3%
New York:
15.0%
Students in private undergraduate colleges: 446
Here:
39.2%
New York:
39.2%
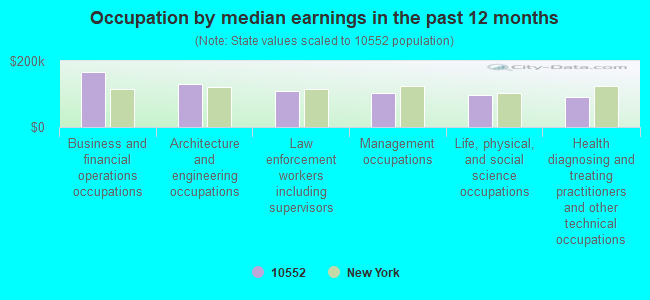
Occupation by median earnings in the past 12 months ($)
166,786Business and financial operations occupations
130,763Architecture and engineering occupations
110,572Law enforcement workers including supervisors
102,912Management occupations
96,369Life, physical, and social science occupations
91,608Health diagnosing and treating practitioners and other technical occupations
Companies with federal contracts located in this zip code:
REAL TIME SYSTEMS INC (24 CLINTON ST in MOUNT VERNON, NY; small business) : $35,030 in 2 contractsfrom 2003 to 2005
$27,000 with Navy for Miscellaneous Communication Equipment. Signed on 2003-06-30. Completion date: 2003-12-01.
$8,030 with Air Force for Electrical and Electronic Properties Measuring and Testing Instruments. Taking place in FL. Signed on 2005-04-01. Completion date: 2005-05-01.
Top industries in this zip code by the number of employees in 2005:
Health Care and Social Assistance: Nursing Care Facilities (500-999 employees: 1 establishment)
Health Care and Social Assistance: Offices of Physicians (except Mental Health Specialists) (10-19: 1, 5-9: 4, 1-4: 11)
Educational Services: Elementary and Secondary Schools (20-49: 1, 10-19: 2)
Other Services (except Public Administration): Other Similar Organizations (except Business, Professional, Labor, and Political Organizations) (10-19: 1, 5-9: 2, 1-4: 15)
Finance and Insurance: Commercial Banking (10-19: 3, 5-9: 1)
2002 - 2018 National Fire Incident Reporting System (NFIRS) incidents
According to the data from the years 2002 - 2018 the average number of fires per year is 28. The highest number of fire incidents - 71 took place in 2004, and the least - 0 in 2005. The data has a declining trend.
When looking into fire subcategories, the most reports belonged to: Structure Fires (68.2%), and Outside Fires (16.0%).
Fire incident types reported to NFIRS in Zip Code 10552


 Nearest zip codes: 10708, 10553, 10550, 10803, 10709, 10707.


 (Students: 825, Location: 2121 CRESCENT ST, Grades: 9-12)
 According to the data from the years 2002 - 2018 the average number of fires per year is 28. The highest number of fire incidents - 71 took place in 2004, and the least - 0 in 2005. The data has a declining trend.
 When looking into fire subcategories, the most reports belonged to: Structure Fires (68.2%), and Outside Fires (16.0%).