Estimated zip code population in 2022: 39,437 Zip code population in 2010: 37,144 Zip code population in 2000: 38,284
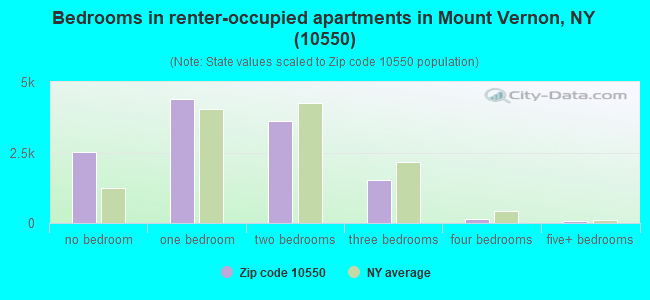
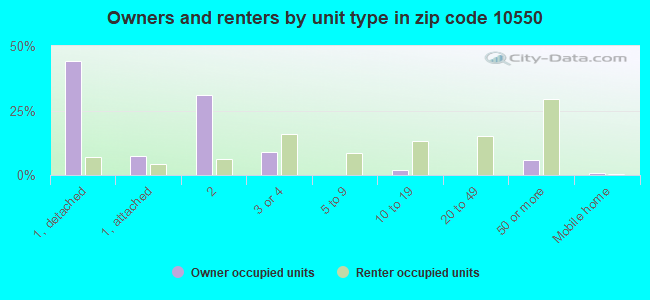
Houses and condos: 16,529 Renter-occupied apartments: 12,077
% of renters here:
75%
State:
46%
March 2022 cost of living index in zip code 10550: 152.0 (very high, U.S. average is 100)
Land area: 2.0 sq. mi. Water area: 0.0 sq. mi.
Population density: 19,850 people per square mile
(very high).
OSM Map
General Map
Google Map
MSN Map
OSM Map
General Map
Google Map
MSN Map
OSM Map
General Map
Google Map
MSN Map
OSM Map
General Map
Google Map
MSN Map
Please wait while loading the map...
Real estate property taxes paid for housing units in 2022:
This zip code:
2.1% ($9,805)
New York:
1.5% ($6,180)
Median real estate property taxes paid for housing units with mortgages in 2022: $9,858 (2.0%) Median real estate property taxes paid for housing units with no mortgage in 2022: $9,457 (2.2%)
Averages for the 2020 tax year for zip code 10550, filed in 2021:
Average Adjusted Gross Income (AGI) in 2020: $44,000 (Individual Income Tax Returns)
Here:
$44,000
State:
$90,930
Salary/wage: $43,972 (reported on 83.6% of returns)
Here:
$43,972
State:
$72,104
(% of AGI for various income ranges: 1056.2% for AGIs below $25k, 3730.9% for AGIs $25k-50k, 7131.6% for AGIs $50k-75k, 10809.4% for AGIs $75k-100k, 17999.1% for AGIs $100k-200k, 82180.0% for AGIs over 200k)
Taxable interest for individuals: $355 (reported on 14.3% of returns)
This zip code:
$355
New York:
$3,075
(% of AGI for various income ranges: 4.3% for AGIs below $25k, 3.1% for AGIs $25k-50k, 7.5% for AGIs $50k-75k, 14.1% for AGIs $75k-100k, 23.0% for AGIs $100k-200k, 217.5% for AGIs over 200k)
Ordinary dividends: $1,502 (reported on 5.0% of returns)
Here:
$1,502
State:
$11,095
(% of AGI for various income ranges: 3.2% for AGIs below $25k, 4.3% for AGIs $25k-50k, 7.9% for AGIs $50k-75k, 17.3% for AGIs $75k-100k, 64.7% for AGIs $100k-200k, 420.0% for AGIs over 200k)
Net capital gain/loss in AGI: +$3,802 (reported on 5.2% of returns)
Here:
+$3,802
State:
+$44,925
(% of AGI for various income ranges: 2.7% for AGIs below $25k, 1.4% for AGIs $25k-50k, 7.1% for AGIs $50k-75k, 13.7% for AGIs $75k-100k, 117.6% for AGIs $100k-200k, 6235.0% for AGIs over 200k)
Profit/loss from business: +$5,256 (reported on 16.7% of returns)
Here:
+$5,256
State:
+$14,940
(% of AGI for various income ranges: 194.0% for AGIs below $25k, 62.9% for AGIs $25k-50k, 56.4% for AGIs $50k-75k, 112.8% for AGIs $75k-100k, 105.6% for AGIs $100k-200k, 1222.5% for AGIs over 200k)
Taxable individual retirement arrangement distribution: $12,690 (reported on 2.0% of returns)
10550:
$12,690
New York:
$19,609
(% of AGI for various income ranges: 12.8% for AGIs below $25k, 15.8% for AGIs $25k-50k, 14.2% for AGIs $50k-75k, 93.0% for AGIs $75k-100k, 269.7% for AGIs $100k-200k)
Total itemized deductions: $25,783 (reported on 6.8% of returns)
Here:
$25,783
State:
$39,326
(% of AGI for various income ranges: 40.7% for AGIs below $25k, 96.7% for AGIs $25k-50k, 272.7% for AGIs $50k-75k, 627.7% for AGIs $75k-100k, 1416.2% for AGIs $100k-200k, 5105.0% for AGIs over 200k)
Charity contributions: $6,976 (reported on 5.1% of returns)
Here:
$6,976
State:
$15,420
(% of AGI for various income ranges: 3.7% for AGIs below $25k, 12.2% for AGIs $25k-50k, 52.3% for AGIs $50k-75k, 130.1% for AGIs $75k-100k, 340.9% for AGIs $100k-200k, 1762.5% for AGIs over 200k)
Taxes paid: $8,836 (reported on 6.7% of returns)
10550:
$8,836
State:
$9,183
(% of AGI for various income ranges: 10.3% for AGIs below $25k, 32.3% for AGIs $25k-50k, 92.3% for AGIs $50k-75k, 225.8% for AGIs $75k-100k, 499.3% for AGIs $100k-200k, 1395.0% for AGIs over 200k)
Earned income credit: $2,167 (reported on 23.2% of returns)
Here:
$2,167
State:
$2,138
(% of AGI for various income ranges: 124.3% for AGIs below $25k, 65.7% for AGIs $25k-50k, 0.6% for AGIs $50k-75k)
Percentage of individuals using paid preparers for their 2020 taxes: 93.5%
Here:
93%
State:
95%
(% for various income ranges: 91.1% for AGIs below $25k, 95.2% for AGIs $25k-50k, 94.8% for AGIs $50k-75k, 94.0% for AGIs $75k-100k, 93.8% for AGIs $100k-200k, 92.3% for AGIs over 200k)
Averages for the 2012 tax year for zip code 10550, filed in 2013:
Average Adjusted Gross Income (AGI) in 2012: $35,618 (Individual Income Tax Returns)
Here:
$35,618
State:
$77,088
Salary/wage: $35,826 (reported on 84.7% of returns)
Here:
$35,826
State:
$60,593
(% of AGI for various income ranges: 72.9% for AGIs below $25k, 91.3% for AGIs $25k-50k, 90.7% for AGIs $50k-75k, 89.8% for AGIs $75k-100k, 84.3% for AGIs $100k-200k, 41.7% for AGIs over 200k)
Taxable interest for individuals: $523 (reported on 15.9% of returns)
This zip code:
$523
New York:
$3,125
(% of AGI for various income ranges: 0.3% for AGIs below $25k, 0.2% for AGIs $25k-50k, 0.2% for AGIs $50k-75k, 0.2% for AGIs $75k-100k, 0.2% for AGIs $100k-200k, 0.7% for AGIs over 200k)
Ordinary dividends: $1,621 (reported on 4.8% of returns)
Here:
$1,621
State:
$10,299
(% of AGI for various income ranges: 0.3% for AGIs below $25k, 0.1% for AGIs $25k-50k, 0.1% for AGIs $50k-75k, 0.2% for AGIs $75k-100k, 0.6% for AGIs $100k-200k)
Net capital gain/loss in AGI: +$3,376 (reported on 2.9% of returns)
Here:
+$3,376
State:
+$42,474
(% of AGI for various income ranges: 9.3% for AGIs over 200k)
Profit/loss from business: +$7,377 (reported on 16.1% of returns)
Here:
+$7,377
State:
+$16,168
(% of AGI for various income ranges: 14.6% for AGIs below $25k, 1.6% for AGIs $25k-50k, 1.0% for AGIs $50k-75k, 0.3% for AGIs $75k-100k, 1.1% for AGIs $100k-200k)
Taxable individual retirement arrangement distribution: $10,153 (reported on 2.9% of returns)
10550:
$10,153
New York:
$17,621
(% of AGI for various income ranges: 0.7% for AGIs below $25k, 0.5% for AGIs $25k-50k, 0.8% for AGIs $50k-75k, 1.1% for AGIs $75k-100k, 1.5% for AGIs $100k-200k)
Total itemized deductions: $20,431 (30% of AGI, reported on 25.2% of returns)
Here:
$20,431
State:
$34,985
Here:
30.4% of AGI
State:
21.3% of AGI
(% of AGI for various income ranges: 6.2% for AGIs below $25k, 11.4% for AGIs $25k-50k, 17.1% for AGIs $50k-75k, 19.3% for AGIs $75k-100k, 20.4% for AGIs $100k-200k, 18.8% for AGIs over 200k)
Charity contributions: $3,752 (reported on 21.1% of returns)
Here:
$3,752
State:
$5,572
(% of AGI for various income ranges: 0.5% for AGIs below $25k, 1.8% for AGIs $25k-50k, 2.9% for AGIs $50k-75k, 3.2% for AGIs $75k-100k, 3.2% for AGIs $100k-200k, 1.5% for AGIs over 200k)
Taxes paid: $7,191 (reported on 25.1% of returns)
10550:
$7,191
State:
$18,656
(% of AGI for various income ranges: 2.1% for AGIs below $25k, 3.2% for AGIs $25k-50k, 5.8% for AGIs $50k-75k, 7.2% for AGIs $75k-100k, 8.4% for AGIs $100k-200k, 8.3% for AGIs over 200k)
Earned income credit: $2,307 (reported on 32.5% of returns)
Here:
$2,307
State:
$2,230
(% of AGI for various income ranges: 10.2% for AGIs below $25k, 1.3% for AGIs $25k-50k)
Percentage of individuals using paid preparers for their 2012 taxes: 70.9%
Here:
71%
State:
66%
(% for various income ranges: 69.5% for AGIs below $25k, 71.8% for AGIs $25k-50k, 71.3% for AGIs $50k-75k, 73.0% for AGIs $75k-100k, 75.3% for AGIs $100k-200k, 80.0% for AGIs over 200k)
Averages for the 2004 tax year for zip code 10550, filed in 2005:
Average Adjusted Gross Income (AGI) in 2004: $31,040 (Individual Income Tax Returns)
Here:
$31,040
State:
$59,519
Salary/wage: $31,997 (reported on 87.8% of returns)
Here:
$31,997
State:
$50,673
(% of AGI for various income ranges: 83.7% for AGIs below $10k, 86.2% for AGIs $10k-25k, 95.5% for AGIs $25k-50k, 92.9% for AGIs $50k-75k, 89.6% for AGIs $75k-100k, 78.3% for AGIs over 100k)
Taxable interest for individuals: $576 (reported on 28.0% of returns)
This zip code:
$576
New York:
$2,377
(% of AGI for various income ranges: 1.5% for AGIs below $10k, 0.6% for AGIs $10k-25k, 0.3% for AGIs $25k-50k, 0.4% for AGIs $50k-75k, 0.7% for AGIs $75k-100k, 0.8% for AGIs over 100k)
Taxable dividends: $1,094 (reported on 7.8% of returns)
Here:
$1,094
State:
$5,394
(% of AGI for various income ranges: 0.7% for AGIs below $10k, 0.2% for AGIs $10k-25k, 0.1% for AGIs $25k-50k, 0.2% for AGIs $50k-75k, 0.4% for AGIs $75k-100k, 0.8% for AGIs over 100k)
Net capital gain/loss: +$5,034 (reported on 4.7% of returns)
Here:
+$5,034
State:
+$23,581
(% of AGI for various income ranges: -0.4% for AGIs below $10k, 0.1% for AGIs $10k-25k, 0.0% for AGIs $25k-50k, 0.1% for AGIs $50k-75k, 0.2% for AGIs $75k-100k, 6.5% for AGIs over 100k)
Profit/loss from business: +$5,290 (reported on 12.8% of returns)
Here:
+$5,290
State:
+$13,809
(% of AGI for various income ranges: 22.2% for AGIs below $10k, 6.0% for AGIs $10k-25k, 0.7% for AGIs $25k-50k, 0.4% for AGIs $50k-75k, 1.5% for AGIs $75k-100k, 0.1% for AGIs over 100k)
IRA payment deduction: $2,300 (reported on 1.3% of returns)
10550:
$2,300
New York:
$3,115
(% of AGI for various income ranges: 0.1% for AGIs $10k-25k, 0.1% for AGIs $25k-50k, 0.1% for AGIs $50k-75k, 0.1% for AGIs over 100k)
Self-employed pension: $7,750 (reported on 0.1% of returns)
Here:
$7,750
New York:
$19,016
Total itemized deductions: $17,865 (34% of AGI, reported on 30.4% of returns)
Here:
$17,865
State:
$25,864
Here:
33.7% of AGI
State:
21.9% of AGI
(% of AGI for various income ranges: 9.5% for AGIs below $10k, 9.4% for AGIs $10k-25k, 17.0% for AGIs $25k-50k, 21.5% for AGIs $50k-75k, 22.3% for AGIs $75k-100k, 20.6% for AGIs over 100k)
Charity contributions deductions: $3,681 (7% of AGI, reported on 28.0% of returns)
Here:
$3,681
State:
$4,439
Here:
6.8% of AGI
State:
3.6% of AGI
(% of AGI for various income ranges: 0.6% for AGIs below $10k, 1.5% for AGIs $10k-25k, 3.4% for AGIs $25k-50k, 4.2% for AGIs $50k-75k, 4.5% for AGIs $75k-100k, 3.6% for AGIs over 100k)
Total tax: $3,476 (reported on 64.8% of returns)
10550:
$3,476
State:
$11,730
(% of AGI for various income ranges: 4.1% for AGIs below $10k, 3.1% for AGIs $10k-25k, 5.3% for AGIs $25k-50k, 8.7% for AGIs $50k-75k, 10.5% for AGIs $75k-100k, 14.6% for AGIs over 100k)
Earned income credit: $1,797 (reported on 29.3% of returns)
Here:
$1,797
State:
$1,757
Percentage of individuals using paid preparers for their 2004 taxes: 71.8%
Here:
72%
State:
67%
(% for various income ranges: 66.5% for AGIs below $10k, 75.3% for AGIs $10k-25k, 71.6% for AGIs $25k-50k, 71.0% for AGIs $50k-75k, 71.6% for AGIs $75k-100k, 81.2% for AGIs over 100k)
Likely homosexual households (counted as self-reported same-sex unmarried-partner households)
Lesbian couples: 0.0% of all households
Gay men: 0.0% of all households
Household received Food Stamps/SNAP in the past 12 months: 5,096 Household did not receive Food Stamps/SNAP in the past 12 months: 11,181
Women who had a birth in the past 12 months: 341 (142 now married, 204 unmarried) Women who did not have a birth in the past 12 months: 9,159 (2,863 now married, 6,317 unmarried)
Housing units in zip code 10550 with a mortgage: 2,921 (285 second mortgage, 34 home equity loan, 196 both second mortgage and home equity loan) Houses without a mortgage: 74
Median monthly owner costs for units with a mortgage: $3,275 Median monthly owner costs for units without a mortgage: $1,312
Residents with income below the poverty level in 2022:
This zip code:
20.6%
Whole state:
14.3%
Residents with income below 50% of the poverty level in 2022:
This zip code:
10.1%
Whole state:
6.8%
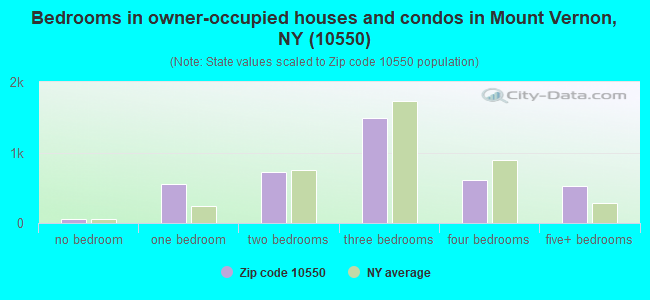
Median number of rooms in houses and condos:
Here:
5.8
State:
6.3
Median number of rooms in apartments:
Here:
3.5
State:
3.8
Notable locations in this zip code not listed on our city pages
Notable locations in zip code 10550: Fleetwood Station (A), Mount Vernon Station (B), Mount Vernon West Station (C), Mount Vernon Public Library (D), Mount Vernon City Hall (E), Police Court Facility of Mount Vernon (F), Mount Vernon Police Station (G), Mount Vernon Fire Department Station 3 (H), Martha Wilson Home for Aged Women (I), Lincoln Building (J), Henry Enoch Kagan Community House (K), Doles Community Center (L), Dillard Home Adult Care Facility (M), Westchester Center for Rehabilitation and Nursing (N), Mount Vernon Fire Department Station 4 (O). Display/hide their locations on the map
Churches in zip code 10550 include: Trinity Episcopal Church (A), Saint Pauls Protestant Episcopal Church (B), Saint Francis Chapel (C), Our Lady of Victory Roman Catholic Church (D), Our Lady of Mount Carmel Roman Catholic Church (E), Mount Zion Christian Church (F), Mount Sinai Church (G), Little Friendship Baptist Church (H), Kingdom Hall of Jehovahs Witnesses (I). Display/hide their locations on the map
Parks in zip code 10550 include: Saint Pauls Church National Historic Site (1), Glover's Field (2), Hartley Park (3), Brush Memorial Park (4), Cohn Park (5), Brom Dyckman Park (6), Farnsworth Park (7), Roosevelt Square (8). Display/hide their locations on the map
2,518 married couples with children.
3,023 single-parent households (282 men, 2,741 women).
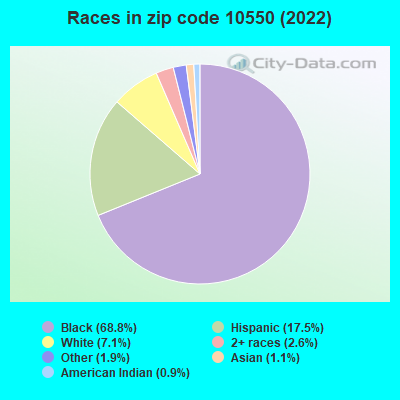
75.1% of residents of 10550 zip code speak English at home.
14.1% of residents speak Spanish at home (59% very well, 21% well, 13% not well, 8% not at all).
5.3% of residents speak other Indo-European language at home (55% very well, 26% well, 20% not well).
0.7% of residents speak Asian or Pacific Island language at home (42% very well, 27% well, 29% not well, 2% not at all).
4.8% of residents speak other language at home (76% very well, 21% well, 1% not well, 2% not at all).
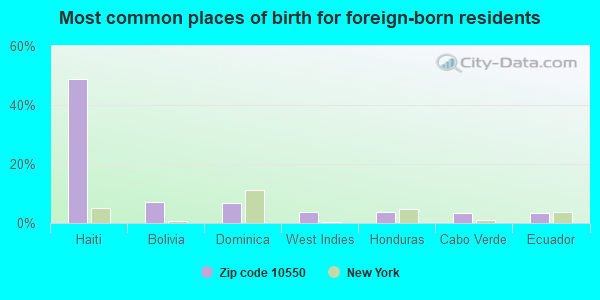
Foreign born population: 13,505 (34.2%) (63.0% of them are naturalized citizens)
Major facilities with environmental interests located in this zip code:
COMMERCIAL DECAL INC (650 SOUTH COLUMBUS AVENUE in MOUNT VERNON, NY)
STATE MASTER (New York facility tracking) - TSD STATE MASTER (New York facility tracking) - AIR PROGRAM, (Integrated Compliance Information System) - ICIS-02-1997-0454, FORMAL ENFORCEMENT ACTION, ICIS-02-1995-0238, ICIS-02-1992-0078, COMPLIANCE ACTIVITY (Tracking inspections of insecticide, fungicide, and rodenticide, and toxic substances) (Resource Conservation and Recovery Act (tracking hazardous waste)) TRI REPORTER (Tracking of toxic chemicals releasing facilities) Business SIC classification: POTTERY PRODUCTS; OPERATORS OF APARTMENT BUILDINGS Business NAICS classification: LESSORS OF RESIDENTIAL BUILDINGS AND DWELLINGS. Organizations: 650 COLUMBUS AVE LLC (CONTACT/OPERATOR)
, TRANSFORMER CONSULTANTS DIV OF S D MYERS (LEGALLY RESPONSIBLE PARTY)
Alternative names: COMMERCIAL DECAL PLANT, FORMER COMMERCIAL DECAL SITE
GERITEX CORPORATION (144 KINGSBRIDGE ROAD in MT VERNON, NY)
(Integrated Compliance Information System) - ICIS-02-2002-3300, FORMAL ENFORCEMENT ACTION (Integrated Compliance Information System) - ICIS-02-2002-3027, FORMAL ENFORCEMENT ACTION COMPLIANCE ACTIVITY (Tracking inspections of insecticide, fungicide, and rodenticide, and toxic substances) National Pollutant Discharge Elimination System NON-MAJOR (Tracking pollutant discharge elimination systems) - permit Business SIC classification: PHARMACEUTICAL PREPARATIONS Alternative names: GERITREX CORP
ALBANO FUEL OIL INC (47 SOUTH 3RD AVENUE in MOUNT VERNON, NY)
(Integrated Compliance Information System) - ICIS-02-2006-7901, ENFORCEMENT/COMPLIANCE ACTIVITY FORMAL ENFORCEMENT ACTION (Integrated Compliance Information System) - ICIS-02-2006-7901, ENFORCEMENT/COMPLIANCE ACTIVITY
ALLTEX LAMINATING CORPORATION (120 EAST SANDFORD BOULEVARD in MOUNT VERNON, NY)
(Integrated Compliance Information System) - ICIS-02-1991-0126, FORMAL ENFORCEMENT ACTION COMPLIANCE ACTIVITY (Tracking inspections of insecticide, fungicide, and rodenticide, and toxic substances) (Resource Conservation and Recovery Act (tracking hazardous waste)) TRI REPORTER (Tracking of toxic chemicals releasing facilities) Business SIC classification: FINISHERS OF BROADWOVEN FABRICS OF MANMADE FIBER AND SILK; FINISHERS OF TEXTILES; COATED FABRICS, NOT RUBBERIZED; INDUSTRIAL LAUNDERERS Alternative names: ALLTEX LAMINATION CORP
CONSUMER PROMOTIONS INTERNATIONAL INC (520 SOUTH FULTON AVENUE in MOUNT VERNON, NY)
STATE MASTER (New York facility tracking) - AIR PROGRAM Conditionally Exempt Small Quantity Generators, less than 100 kg/month of hazardous waste (Resource Conservation and Recovery Act (tracking hazardous waste)) - notification Small Quantity Generators, between 100 kg and 1000 kg of hazardous waste/month (Resource Conservation and Recovery Act (tracking hazardous waste)) - notification Business SIC classification: SIGNS AND ADVERTISING SPECIALTIES Business NAICS classification: SIGN MANUFACTURING. Organizations: RICHARD TEVERE (CONTACT/OWNER)
, MICHAEL DEGENNARO (CONTACT/OWNER)
Alternative names: CONSUMER PROMOTIONS INC
AMPACET CORP (250 S. TERRACE AV in MOUNT VERNON, NY)
STATE MASTER (New York facility tracking) - AIR PROGRAM, (Resource Conservation and Recovery Act (tracking hazardous waste)) TRI REPORTER (Tracking of toxic chemicals releasing facilities) Business SIC classification: PLASTICS MATERIALS, SYNTHETIC RESINS, AND NONVULCANIZABLE ELASTOMERS Business NAICS classification: PLASTICS MATERIAL AND RESIN MANUFACTURING.; PLASTICS MATERIAL AND RESIN MANUFACTURING.; CELLULOSIC ORGANIC FIBER MANUFACTURING. Alternative names: AMPACET CORP. MT. VERNON PLANT
CIRCLE VALET CLEANERS (6 OAKLEY AVE in MOUNT VERNON, NY)
AIR MINOR (AIRS/AFS) STATE MASTER (New York facility tracking) - AIR PROGRAM, HAZARDOUS WASTE PROGRAM Business SIC classification: DRYCLEANING PLANTS, EXCEPT RUG CLEANING Business NAICS classification: DRYCLEANING AND LAUNDRY SERVICES (EXCEPT COIN-OPERATED). Organizations: CIRCLE VALET CLEANERS INC (AIR PERMITTING FACILITY OWNER CONTACT)
APPROVED STORAGE & WASTE HAULING INC (110 EDISON AVE in MOUNT VERNON, NY)
STATE MASTER (New Jersey environmental info) - NJEMS-282066, TRANSPORTER, NJEMS-243243, REFUSE DISPOSAL, NJEMS-NYR000076513, TRANSPORTER TRANSPORTER (Resource Conservation and Recovery Act (tracking hazardous waste)) Organizations: FUTURE HEALTHCARE SYSTEMS INC (CONTACT/OWNER)
J BASS & SON INC (9-11 CARLETON AVENUE in MT VERNON, NY)
AIR MINOR (AIRS/AFS) STATE MASTER (New York facility tracking) - National Pollutant Discharge Elimination System Permit Business SIC classification: MOTOR VEHICLE DEALERS (NEW AND USED)
COLUMBUS SCHOOL ( in MOUNT VERNON, NY)
(Geographic Names Information System) (National Center for Education Statistics) - STATE ID-660900010001 Organizations: MT VERNON CITY SD (SCHOOL DISTRICT)
J & B AUTO BODY INC (8 GROVE ST in MOUNT VERNON, NY)
STATE MASTER (New York facility tracking) - AIR PROGRAM, (Resource Conservation and Recovery Act (tracking hazardous waste))
J & B BODY WORK (19-21 BEACH STREET in MT VERNON, NY)
STATE MASTER (New York facility tracking) - AIR PROGRAM Small Quantity Generators, between 100 kg and 1000 kg of hazardous waste/month (Resource Conservation and Recovery Act (tracking hazardous waste)) - notification Organizations: JOSEPH IZZO (CONTACT/OWNER)
, AUTO BODY BUILDERS INC (LEGALLY RESPONSIBLE PARTY)
Alternative names: AUTO BODY BUILDERS INC DBA J B BODY WORK
HAMILTON SCHOOL ( in MOUNT VERNON, NY)
(Geographic Names Information System) (National Center for Education Statistics) - STATE ID-660900010004 Organizations: MT VERNON CITY SD (SCHOOL DISTRICT)
Housing units lacking complete plumbing facilities: 0.8% Housing units lacking complete kitchen facilities: 1.3%
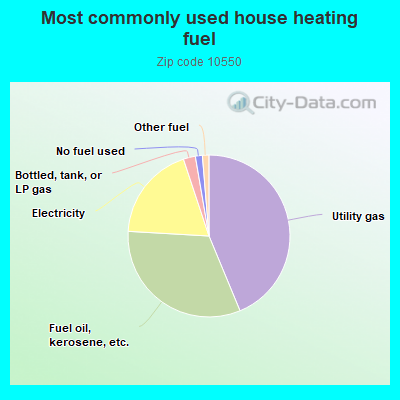
43.8%Utility gas
32.2%Fuel oil, kerosene, etc.
19.0%Electricity
2.4%Bottled, tank, or LP gas
1.4%No fuel used
1.3%Other fuel
Population in 1990: 37,889. Population change in the 1990s: +395 (+1.0%).
Place of birth for U.S.-born residents:
This state: 20,966
Northeast: 755
Midwest: 404
South: 2,756
West: 131
61% of the 10550 zip code residents lived in the same house 5 years ago. Out of people who lived in different houses, 71% lived in this county. Out of people who lived in different counties, 50% lived in New York.
92% of the 10550 zip code residents lived in the same house 1 year ago. Out of people who lived in different houses, 48% moved from this county. Out of people who lived in different houses, 37% moved from different county within same state. Out of people who lived in different houses, 5% moved from different state. Out of people who lived in different houses, 9% moved from abroad.
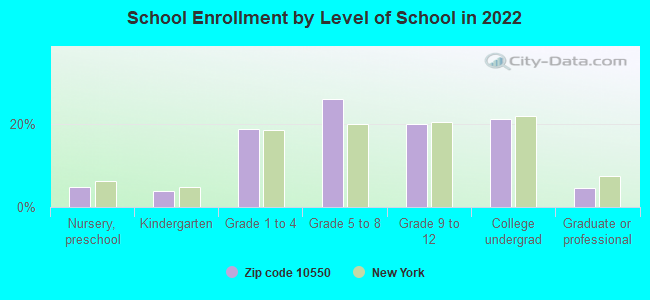
Private vs. public school enrollment:
Students in private schools in grades 1 to 8 (elementary and middle school): 1,042
Here:
24.1%
New York:
15.6%
Students in private schools in grades 9 to 12 (high school): 79
Here:
4.1%
New York:
15.0%
Students in private undergraduate colleges: 674
Here:
32.9%
New York:
39.2%
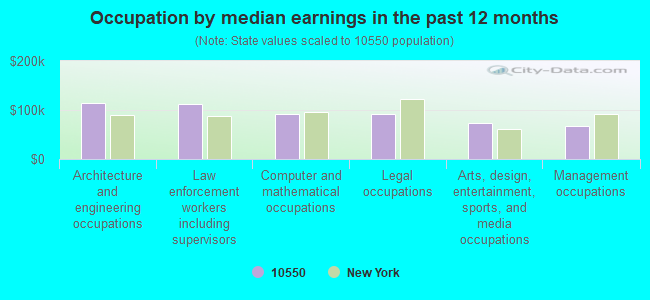
Occupation by median earnings in the past 12 months ($)
113,854Architecture and engineering occupations
113,175Law enforcement workers including supervisors
91,837Computer and mathematical occupations
90,949Legal occupations
73,744Arts, design, entertainment, sports, and media occupations
68,122Management occupations
Companies with biggest federal contracts located in this zip code (MOUNT VERNON, NY):
AMERICAN PARTS INDUSTRIES (156 SOUTH TERRACE AVENUE; small business) 50 employees, $0 revenue. : $663,949 in 14 contractsfrom 1999 to 2004
Contracts for Aircraft Hydraulic, Vacuum, and De-icing System Components, Guns, over 150 mm through 200 mm, Vehicular Power Transmission Components, Vehicular Furniture and Accessories, and moreby Defense Logistics Agency, Army Signed by year:2000: $168,571; 2001: $263,253; 2002: $170,332; 2003: $0; 2004: $14,525; 2005: $0; 2006: $0.
Biggest contracts:
$97,019 with Defense Logistics Agency for Aircraft Hydraulic, Vacuum, and De-icing System Components. Signed on 2002-08-22. Completion date: 2003-02-18.
$84,150 with Army for Guns, over 150 mm through 200 mm. Signed on 2001-02-28. Completion date: 2001-06-29.
$78,540, same as above.Signed on 2001-07-06. Completion date: 2001-12-03.
$72,633 with Defense Logistics Agency for Vehicular Power Transmission Components. Signed on 2001-01-19. Completion date: 2001-07-18.
COVENTRY MANUFACTURING COMPANY (115 E 3RD ST; small business) : $412,364 in 72 contractsfrom 1999 to 2006
Contracts for Guns, over 30 mm up to 75 mm, Pipe, Tube and Rigid Tubing, Fire Fighting Equipment, Vehicular Brake, Steering, Axle, Wheel, and Track Components by Defense Logistics Agency, Navy Signed by year:2000: $0; 2001: $0; 2002: $0; 2003: $0; 2004: $72,293; 2005: $181,316; 2006: $121,091.
Biggest contracts:
$37,664 with Defense Logistics Agency for Guns, over 30 mm up to 75 mm. Signed on 1999-11-02. Completion date: 2000-03-01.
$21,675 with Defense Logistics Agency for Pipe, Tube and Rigid Tubing. Signed on 2005-10-31. Completion date: 2006-01-29.
$11,868, same as above.Signed on 2005-01-04. Completion date: 2005-04-02.
$11,772, same as above.Signed on 2005-08-29. Completion date: 2005-11-27.
SECS, INC (520 HOMESTEAD AVE; small business) : $163,880 in 25 contractsfrom 2000 to 2006
Contracts for Radio and Television Communication Equipment, Except Airborne, Miscellaneous Aircraft Accessories and Components, Torque Converters and Speed Changers, Gears, Pulleys, Sprockets, and Transmission Chain, and moreby Navy, Defense Logistics Agency, Army Signed by year:2000: $32,454; 2001: $0; 2002: $0; 2003: $0; 2004: $49,767; 2005: $72,323; 2006: $9,336.
Biggest contracts:
$32,454 with Navy for Radio and Television Communication Equipment, Except Airborne. Signed on 2000-03-17. Completion date: 2000-05-01.
$14,990 with Navy for Miscellaneous Aircraft Accessories and Components. Signed on 2005-10-27. Completion date: 2006-02-28.
$9,995 with Defense Logistics Agency for Torque Converters and Speed Changers. Signed on 2004-11-15. Completion date: 2005-06-10.
$9,991 with Defense Logistics Agency for Gears, Pulleys, Sprockets, and Transmission Chain. Signed on 2005-04-20. Completion date: 2005-07-21.
TRI STAR LABEL (630 S COLUMBUS AVE; small business) : $144,009 in 26 contractsfrom 2002 to 2006
Contracts for Miscellaneous Printed Matter, Medical and Surgical Instruments, Equipment, and Supplies, Miscellaneous Fabricated Nonmetallic Materials, Plastics Fabricated Materials, and moreby Defense Logistics Agency, Army, Navy Signed by year:2000: $0; 2001: $0; 2002: $21,489; 2003: $0; 2004: $28,538; 2005: $73,654; 2006: $20,328.
Biggest contracts:
$20,700 with Defense Logistics Agency for Miscellaneous Printed Matter. Signed on 2004-10-20. Completion date: 2004-11-19.
$15,451 with Army for Medical and Surgical Instruments, Equipment, and Supplies. Signed on 2002-10-21. Completion date: 2003-09-30.
$11,925 with Defense Logistics Agency for Miscellaneous Fabricated Nonmetallic Materials. Signed on 2005-02-14. Completion date: 2005-03-05.
$9,335, same as above.Signed on 2005-07-13. Completion date: 2005-08-13.
ELECTRICAL INSTRUMENT SERVICE (25 DOCK ST; small business) : $63,864 in 9 contractsfrom 2005 to 2006
Contracts for Electrical and Electronic Properties Measuring and Testing Instruments, Maintenance, Repair and Rebuilding of Equipment -- Instruments and Laboratory Equipment by Navy, Defense Logistics Agency, Air Force, National Oceanic and Atmospheric Administration/Under Secretary for Oceans and Atmosphere, and others Signed by year:2000: $0; 2001: $0; 2002: $0; 2003: $0; 2004: $0; 2005: $60,887; 2006: $2,977.
Biggest contracts:
$20,972 with Navy for Electrical and Electronic Properties Measuring and Testing Instruments. Signed on 2005-11-01. Completion date: 2006-05-30.
$15,770, same as above.Signed on 2005-05-19. Completion date: 2005-09-30.
$10,890, same as above.Signed on 2005-08-18. Completion date: 2005-11-28.
$4,200 with Defense Logistics Agency for Electrical and Electronic Properties Measuring and Testing Instruments. Signed on 2005-02-17. Completion date: 2005-05-03.
CASTOLEUM CORP (240 E 7TH ST) : $53,615 in 2 contractsfrom 2000 to 2004
$53,786 with Defense Logistics Agency for Miscellaneous Chemical Specialties. Signed on 2000-06-30. Completion date: 2000-08-30.
-$171 with Navy for Miscellaneous Chemical Specialties. Signed on 2004-10-04. Completion date: 2003-07-07.
A-1 PARKE HILL LLC (530 SOUTH 4TH AVENUE; small business)
$39,990 with Army for Motor Vehicle Maintenance and Repair Shop Specialized Equipment. Signed on 2004-09-30. Completion date: 2004-10-30.
GAFFCO BALLISTICS INC (6 NORTH STREET; small business)
$34,400 with Navy for Building Components, Prefabricated. Signed on 2003-06-18. Completion date: 2003-08-15.
CHIEF FIRE PREVENTION & MECHAN (52 MOUNT VERNON AVE; small business) : $30,693 in 6 contractsin 2003
Contracts for Quality Control Services -- Fire Control Equipment, Fire Protection Services by Army Signed by year:2000: $0; 2001: $0; 2002: $0; 2003: $30,693; 2004: $0; 2005: $0; 2006: $0.
Biggest contracts:
$12,042 with Army for Quality Control Services -- Fire Control Equipment. Signed on 2003-10-28. Completion date: 2004-09-30.
$10,000, same as above.Signed on 2003-11-12. Completion date: 2004-09-30.
$8,651 with Army for Fire Protection Services. Signed on 2003-10-28. Completion date: 2004-09-30.
$0 with Army for Quality Control Services -- Fire Control Equipment. Signed on 2003-11-12. Completion date: 2004-09-30.
ATLAS VALVE CO. INC. (15 SOUTH STREET; small business)
$28,706 with Navy for Coil, Flat, Leaf, and Wire Springs. Signed on 2000-04-12. Completion date: 2000-04-30.
Top industries in this zip code by the number of employees in 2005:
Health Care and Social Assistance: General Medical and Surgical Hospitals (500-999 employees: 1 establishment)
Health Care and Social Assistance: Home Health Care Services (250-499: 1, 100-249: 2, 1-4: 2)
2002 - 2018 National Fire Incident Reporting System (NFIRS) incidents
According to the data from the years 2002 - 2018 the average number of fires per year is 210. The highest number of fire incidents - 335 took place in 2004, and the least - 0 in 2005. The data has a declining trend.
When looking into fire subcategories, the most reports belonged to: Structure Fires (73.4%), and Outside Fires (15.4%).
Fire incident types reported to NFIRS in Zip Code 10550

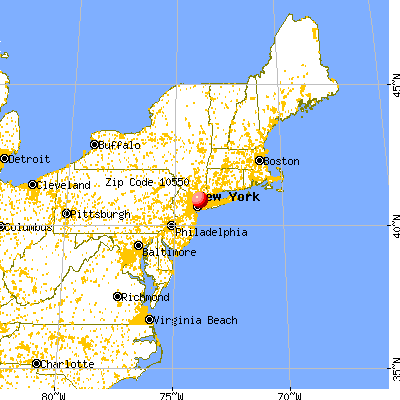


 Nearest zip codes: 10553, 10466, 10552, 10803, 10704, 10475.
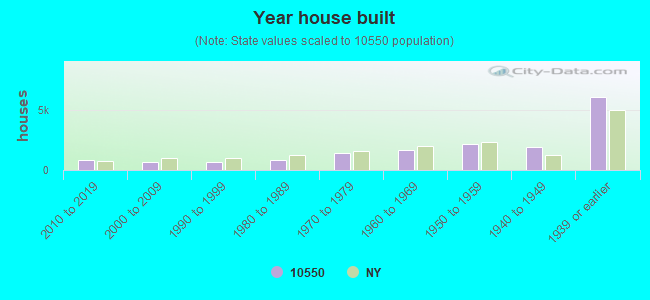


 According to the data from the years 2002 - 2018 the average number of fires per year is 210. The highest number of fire incidents - 335 took place in 2004, and the least - 0 in 2005. The data has a declining trend.
 When looking into fire subcategories, the most reports belonged to: Structure Fires (73.4%), and Outside Fires (15.4%).