Estimated zip code population in 2022: 13,072 Zip code population in 2010: 12,435 Zip code population in 2000: 12,124
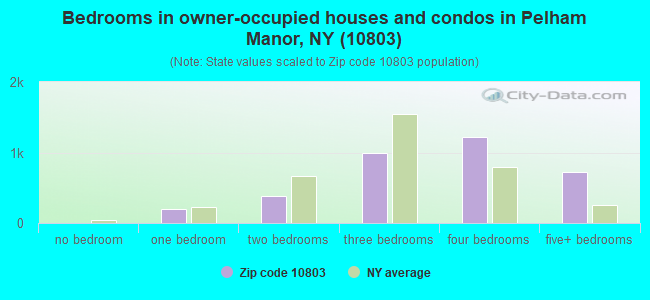
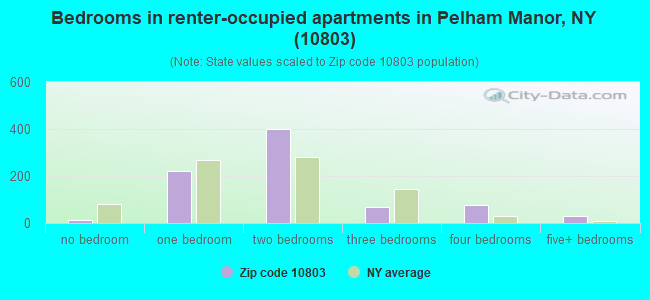
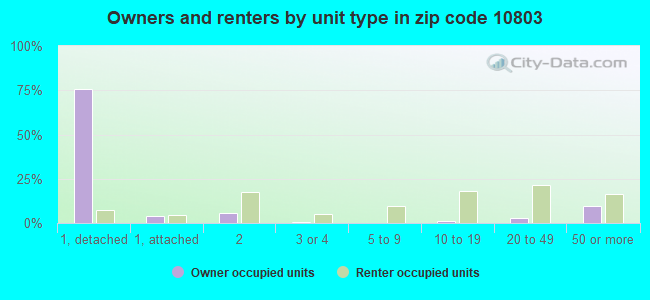
Houses and condos: 4,439 Renter-occupied apartments: 827
% of renters here:
19%
State:
46%
March 2022 cost of living index in zip code 10803: 148.5 (very high, U.S. average is 100)
Land area: 2.2 sq. mi. Water area: 0.0 sq. mi.
Population density: 5,973 people per square mile
(average).
OSM Map
General Map
Google Map
MSN Map
OSM Map
General Map
Google Map
MSN Map
OSM Map
General Map
Google Map
MSN Map
OSM Map
General Map
Google Map
MSN Map
Please wait while loading the map...
Real estate property taxes paid for housing units in 2022:
This zip code:
1.0% ($9,805)
New York:
1.5% ($6,180)
Median real estate property taxes paid for housing units with mortgages in 2022: $9,858 (1.0%) Median real estate property taxes paid for housing units with no mortgage in 2022: $9,755 (1.2%)
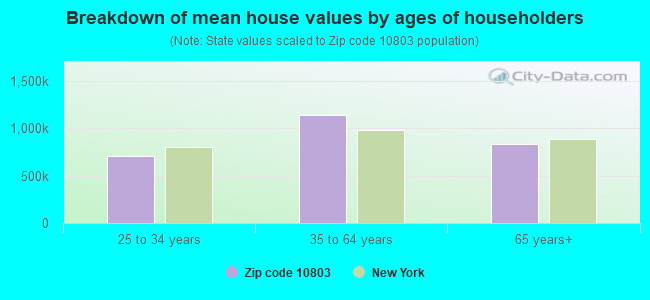
Estimated median house/condo value in 2022: $966,339
10803:
$966,339
New York:
$400,400
According to our research of New York and other state lists, there was 1 registered sex offender living in 10803 zip code as of April 27, 2024. The ratio of all residents to sex offenders in zip code 10803 is 12,740 to 1. The ratio of registered sex offenders to all residents in this zip code is much lower than the state average.
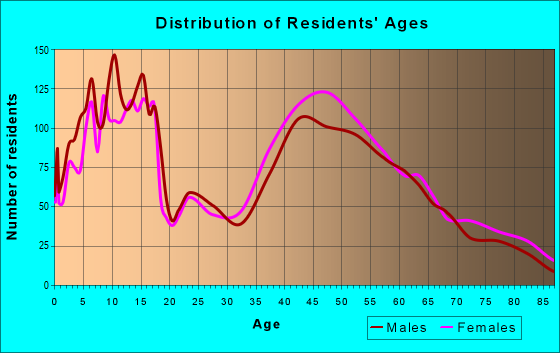
Median resident age:
This zip code:
40.3 years
New York median age:
40.0 years
Average household size:
This zip code:
3.0 people
New York:
2.5 people
Averages for the 2020 tax year for zip code 10803, filed in 2021:
Average Adjusted Gross Income (AGI) in 2020: $282,401 (Individual Income Tax Returns)
Here:
$282,401
State:
$90,930
Salary/wage: $221,891 (reported on 81.1% of returns)
Here:
$221,891
State:
$72,104
(% of AGI for various income ranges: 1207.2% for AGIs below $25k, 3889.3% for AGIs $25k-50k, 6889.0% for AGIs $50k-75k, 10134.6% for AGIs $75k-100k, 19746.1% for AGIs $100k-200k, 163175.7% for AGIs over 200k)
Taxable interest for individuals: $7,055 (reported on 55.9% of returns)
This zip code:
$7,055
New York:
$3,075
(% of AGI for various income ranges: 39.7% for AGIs below $25k, 75.8% for AGIs $25k-50k, 57.2% for AGIs $50k-75k, 156.5% for AGIs $75k-100k, 261.8% for AGIs $100k-200k, 3840.9% for AGIs over 200k)
Ordinary dividends: $18,847 (reported on 47.6% of returns)
Here:
$18,847
State:
$11,095
(% of AGI for various income ranges: 101.7% for AGIs below $25k, 171.6% for AGIs $25k-50k, 227.2% for AGIs $50k-75k, 574.6% for AGIs $75k-100k, 790.5% for AGIs $100k-200k, 8357.8% for AGIs over 200k)
Net capital gain/loss in AGI: +$72,098 (reported on 44.4% of returns)
Here:
+$72,098
State:
+$44,925
(% of AGI for various income ranges: 97.7% for AGIs below $25k, 139.5% for AGIs $25k-50k, 137.4% for AGIs $50k-75k, 255.8% for AGIs $75k-100k, 791.4% for AGIs $100k-200k, 33976.3% for AGIs over 200k)
Profit/loss from business: +$34,255 (reported on 20.4% of returns)
Here:
+$34,255
State:
+$14,940
(% of AGI for various income ranges: 247.4% for AGIs below $25k, 268.1% for AGIs $25k-50k, 293.1% for AGIs $50k-75k, 529.6% for AGIs $75k-100k, 1114.5% for AGIs $100k-200k, 5541.9% for AGIs over 200k)
Taxable individual retirement arrangement distribution: $30,428 (reported on 9.6% of returns)
10803:
$30,428
New York:
$19,609
(% of AGI for various income ranges: 56.0% for AGIs below $25k, 188.1% for AGIs $25k-50k, 246.7% for AGIs $50k-75k, 369.2% for AGIs $75k-100k, 765.4% for AGIs $100k-200k, 1845.0% for AGIs over 200k)
Self-employed (Keogh) retirement plans: $46,668 (reported on 4.2% of returns)
10803:
$46,668
New York:
$32,497
(% of AGI for various income ranges: 107.3% for AGIs $100k-200k, 2049.3% for AGIs over 200k)
Total itemized deductions: $40,475 (reported on 31.1% of returns)
Here:
$40,475
State:
$39,326
(% of AGI for various income ranges: 152.5% for AGIs below $25k, 314.7% for AGIs $25k-50k, 621.0% for AGIs $50k-75k, 1048.1% for AGIs $75k-100k, 1825.7% for AGIs $100k-200k, 10585.9% for AGIs over 200k)
Charity contributions: $11,713 (reported on 27.9% of returns)
Here:
$11,713
State:
$15,420
(% of AGI for various income ranges: 10.2% for AGIs below $25k, 32.6% for AGIs $25k-50k, 59.7% for AGIs $50k-75k, 136.2% for AGIs $75k-100k, 242.3% for AGIs $100k-200k, 3202.4% for AGIs over 200k)
Taxes paid: $9,763 (reported on 31.1% of returns)
10803:
$9,763
State:
$9,183
(% of AGI for various income ranges: 47.4% for AGIs below $25k, 113.5% for AGIs $25k-50k, 172.1% for AGIs $50k-75k, 328.1% for AGIs $75k-100k, 610.0% for AGIs $100k-200k, 2282.6% for AGIs over 200k)
Earned income credit: $1,771 (reported on 5.2% of returns)
Here:
$1,771
State:
$2,138
(% of AGI for various income ranges: 53.1% for AGIs below $25k, 47.4% for AGIs $25k-50k)
Percentage of individuals using paid preparers for their 2020 taxes: 94.4%
Here:
94%
State:
95%
(% for various income ranges: 92.1% for AGIs below $25k, 92.5% for AGIs $25k-50k, 93.2% for AGIs $50k-75k, 93.2% for AGIs $75k-100k, 94.4% for AGIs $100k-200k, 97.4% for AGIs over 200k)
Averages for the 2012 tax year for zip code 10803, filed in 2013:
Average Adjusted Gross Income (AGI) in 2012: $218,264 (Individual Income Tax Returns)
Here:
$218,264
State:
$77,088
Salary/wage: $169,525 (reported on 79.8% of returns)
Here:
$169,525
State:
$60,593
(% of AGI for various income ranges: 62.7% for AGIs below $25k, 73.3% for AGIs $25k-50k, 73.2% for AGIs $50k-75k, 70.5% for AGIs $75k-100k, 71.4% for AGIs $100k-200k, 59.5% for AGIs over 200k)
Taxable interest for individuals: $4,597 (reported on 59.3% of returns)
This zip code:
$4,597
New York:
$3,125
(% of AGI for various income ranges: 3.6% for AGIs below $25k, 1.9% for AGIs $25k-50k, 1.6% for AGIs $50k-75k, 1.1% for AGIs $75k-100k, 1.0% for AGIs $100k-200k, 1.2% for AGIs over 200k)
Ordinary dividends: $13,480 (reported on 45.8% of returns)
Here:
$13,480
State:
$10,299
(% of AGI for various income ranges: 7.2% for AGIs below $25k, 3.8% for AGIs $25k-50k, 2.7% for AGIs $50k-75k, 2.1% for AGIs $75k-100k, 2.7% for AGIs $100k-200k, 2.8% for AGIs over 200k)
Net capital gain/loss in AGI: +$40,519 (reported on 40.6% of returns)
Here:
+$40,519
State:
+$42,474
(% of AGI for various income ranges: 1.6% for AGIs below $25k, 0.6% for AGIs $25k-50k, 0.8% for AGIs $50k-75k, 1.1% for AGIs $75k-100k, 1.7% for AGIs $100k-200k, 9.2% for AGIs over 200k)
Profit/loss from business: +$35,396 (reported on 20.9% of returns)
Here:
+$35,396
State:
+$16,168
(% of AGI for various income ranges: 12.0% for AGIs below $25k, 5.8% for AGIs $25k-50k, 4.0% for AGIs $50k-75k, 2.4% for AGIs $75k-100k, 5.7% for AGIs $100k-200k, 2.9% for AGIs over 200k)
Taxable individual retirement arrangement distribution: $35,801 (reported on 12.6% of returns)
10803:
$35,801
New York:
$17,621
(% of AGI for various income ranges: 3.2% for AGIs below $25k, 3.2% for AGIs $25k-50k, 2.8% for AGIs $50k-75k, 4.0% for AGIs $75k-100k, 3.3% for AGIs $100k-200k, 1.7% for AGIs over 200k)
Self-employment retirement plans: $36,518 (reported on 4.7% of returns)
10803:
$36,518
New York:
$27,330
(% of AGI for various income ranges: 0.4% for AGIs $100k-200k, 0.9% for AGIs over 200k)
Total itemized deductions: $65,352 (19% of AGI, reported on 60.8% of returns)
Here:
$65,352
State:
$34,985
Here:
19.3% of AGI
State:
21.3% of AGI
(% of AGI for various income ranges: 27.7% for AGIs below $25k, 23.8% for AGIs $25k-50k, 20.9% for AGIs $50k-75k, 22.3% for AGIs $75k-100k, 25.4% for AGIs $100k-200k, 16.6% for AGIs over 200k)
Charity contributions: $6,323 (reported on 55.1% of returns)
Here:
$6,323
State:
$5,572
(% of AGI for various income ranges: 1.0% for AGIs below $25k, 1.6% for AGIs $25k-50k, 1.6% for AGIs $50k-75k, 1.8% for AGIs $75k-100k, 2.0% for AGIs $100k-200k, 1.5% for AGIs over 200k)
Taxes paid: $43,799 (reported on 60.6% of returns)
10803:
$43,799
State:
$18,656
(% of AGI for various income ranges: 12.8% for AGIs below $25k, 10.6% for AGIs $25k-50k, 11.1% for AGIs $50k-75k, 12.5% for AGIs $75k-100k, 14.7% for AGIs $100k-200k, 11.9% for AGIs over 200k)
Earned income credit: $1,826 (reported on 5.7% of returns)
Here:
$1,826
State:
$2,230
(% of AGI for various income ranges: 3.1% for AGIs below $25k, 0.5% for AGIs $25k-50k)
Percentage of individuals using paid preparers for their 2012 taxes: 72.9%
Here:
73%
State:
66%
(% for various income ranges: 66.4% for AGIs below $25k, 68.3% for AGIs $25k-50k, 72.6% for AGIs $50k-75k, 70.2% for AGIs $75k-100k, 76.5% for AGIs $100k-200k, 80.5% for AGIs over 200k)
Averages for the 2004 tax year for zip code 10803, filed in 2005:
Average Adjusted Gross Income (AGI) in 2004: $147,292 (Individual Income Tax Returns)
Here:
$147,292
State:
$59,519
Salary/wage: $123,680 (reported on 78.5% of returns)
Here:
$123,680
State:
$50,673
(% of AGI for various income ranges: 93.4% for AGIs below $10k, 67.0% for AGIs $10k-25k, 76.5% for AGIs $25k-50k, 73.8% for AGIs $50k-75k, 73.4% for AGIs $75k-100k, 64.4% for AGIs over 100k)
Taxable interest for individuals: $4,192 (reported on 71.9% of returns)
This zip code:
$4,192
New York:
$2,377
(% of AGI for various income ranges: 15.7% for AGIs below $10k, 5.9% for AGIs $10k-25k, 2.2% for AGIs $25k-50k, 2.6% for AGIs $50k-75k, 1.8% for AGIs $75k-100k, 1.9% for AGIs over 100k)
Taxable dividends: $7,429 (reported on 53.9% of returns)
Here:
$7,429
State:
$5,394
(% of AGI for various income ranges: 20.0% for AGIs below $10k, 5.7% for AGIs $10k-25k, 2.6% for AGIs $25k-50k, 2.6% for AGIs $50k-75k, 2.9% for AGIs $75k-100k, 2.6% for AGIs over 100k)
Net capital gain/loss: +$25,961 (reported on 46.5% of returns)
Here:
+$25,961
State:
+$23,581
(% of AGI for various income ranges: -7.8% for AGIs below $10k, 0.6% for AGIs $10k-25k, 1.3% for AGIs $25k-50k, 0.7% for AGIs $50k-75k, 0.5% for AGIs $75k-100k, 9.5% for AGIs over 100k)
Profit/loss from business: +$32,977 (reported on 19.3% of returns)
Here:
+$32,977
State:
+$13,809
(% of AGI for various income ranges: 10.6% for AGIs below $10k, 8.1% for AGIs $10k-25k, 3.7% for AGIs $25k-50k, 3.0% for AGIs $50k-75k, 4.0% for AGIs $75k-100k, 4.4% for AGIs over 100k)
IRA payment deduction: $3,440 (reported on 3.6% of returns)
10803:
$3,440
New York:
$3,115
(% of AGI for various income ranges: 0.6% for AGIs $10k-25k, 0.4% for AGIs $25k-50k, 0.3% for AGIs $50k-75k, 0.2% for AGIs $75k-100k, 0.0% for AGIs over 100k)
Self-employed pension: $24,790 (reported on 4.9% of returns)
Here:
$24,790
New York:
$19,016
Total itemized deductions: $45,624 (20% of AGI, reported on 59.7% of returns)
Here:
$45,624
State:
$25,864
Here:
19.7% of AGI
State:
21.9% of AGI
(% of AGI for various income ranges: 23.8% for AGIs below $10k, 28.5% for AGIs $10k-25k, 20.3% for AGIs $25k-50k, 26.0% for AGIs $50k-75k, 26.6% for AGIs $75k-100k, 17.4% for AGIs over 100k)
Charity contributions deductions: $6,441 (3% of AGI, reported on 56.4% of returns)
Here:
$6,441
State:
$4,439
Here:
2.7% of AGI
State:
3.6% of AGI
(% of AGI for various income ranges: 0.9% for AGIs below $10k, 2.0% for AGIs $10k-25k, 2.2% for AGIs $25k-50k, 2.8% for AGIs $50k-75k, 2.7% for AGIs $75k-100k, 2.5% for AGIs over 100k)
Total tax: $36,875 (reported on 82.9% of returns)
10803:
$36,875
State:
$11,730
(% of AGI for various income ranges: 5.0% for AGIs below $10k, 5.0% for AGIs $10k-25k, 7.5% for AGIs $25k-50k, 9.4% for AGIs $50k-75k, 10.5% for AGIs $75k-100k, 22.9% for AGIs over 100k)
Earned income credit: $1,281 (reported on 4.4% of returns)
Here:
$1,281
State:
$1,757
Percentage of individuals using paid preparers for their 2004 taxes: 72.6%
Here:
73%
State:
67%
(% for various income ranges: 67.7% for AGIs below $10k, 68.4% for AGIs $10k-25k, 67.0% for AGIs $25k-50k, 73.2% for AGIs $50k-75k, 73.3% for AGIs $75k-100k, 79.0% for AGIs over 100k)
Household received Food Stamps/SNAP in the past 12 months: 101 Household did not receive Food Stamps/SNAP in the past 12 months: 4,224
Women who had a birth in the past 12 months: 110 (108 now married, 0 unmarried) Women who did not have a birth in the past 12 months: 2,734 (1,540 now married, 1,168 unmarried)
Housing units in zip code 10803 with a mortgage: 2,476 (214 second mortgage, 213 both second mortgage and home equity loan) Houses without a mortgage: 57
Median monthly owner costs for units with a mortgage: $3,860 Median monthly owner costs for units without a mortgage: $1,487
Residents with income below the poverty level in 2022:
This zip code:
2.7%
Whole state:
14.3%
Residents with income below 50% of the poverty level in 2022:
This zip code:
0.9%
Whole state:
6.8%
Median number of rooms in houses and condos:
Here:
8.0
State:
6.3
Median number of rooms in apartments:
Here:
4.4
State:
3.8
Notable locations in this zip code not listed on our city pages
Notable locations in zip code 10803: Pelham Station (A), Pelham Country Club (B), New York Athletic Club (C), Pelham Village Hall (D), Pelham Town Hall (E), Pelham Manor Village Hall (F), Town of Pelham Public Library (G), Pelham Town Hall (H), Pelham Fire Department Engine 1 (I), Pelham Manor Fire Department (J). Display/hide their locations on the map
Churches in zip code 10803 include: Saint Catherine's Catholic Church (A), Pelham Jewish Center (B), Our Lady of Perpetual Help Church (C), Korean Presbyterian Church (D), Community Church of the Pelhams (E), Christ the Redeemer Church (F), Huguenot Memorial Church (G). Display/hide their locations on the map
In group quarters: 48 (-1 institutionalized population)
Size of family households: 1,184 2-persons, 661 3-persons, 1,075 4-persons, 266 5-persons, 162 6-persons, 88 7-or-more-persons
Size of nonfamily households: 823 1-person, 58 2-persons, 13 3-persons
3,336 married couples with children.
396 single-parent households (122 men, 274 women).
79.6% of residents of 10803 zip code speak English at home.
5.2% of residents speak Spanish at home (90% very well, 8% well, 2% not well).
10.0% of residents speak other Indo-European language at home (82% very well, 12% well, 5% not well, 2% not at all).
3.2% of residents speak Asian or Pacific Island language at home (67% very well, 16% well, 8% not well, 9% not at all).
1.4% of residents speak other language at home (78% very well, 22% well).
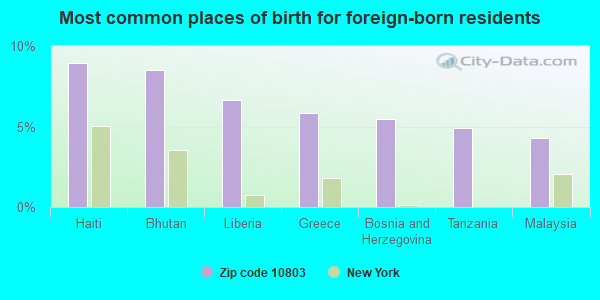
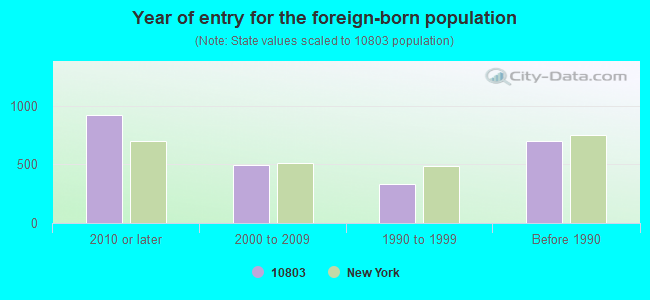
Foreign born population: 2,256 (17.3%) (55.3% of them are naturalized citizens)
This zip code:
17.3%
Whole state:
22.7%
9%Haiti
9%Bhutan
7%Liberia
6%Greece
5%Bosnia and Herzegovina
5%Tanzania
4%Malaysia
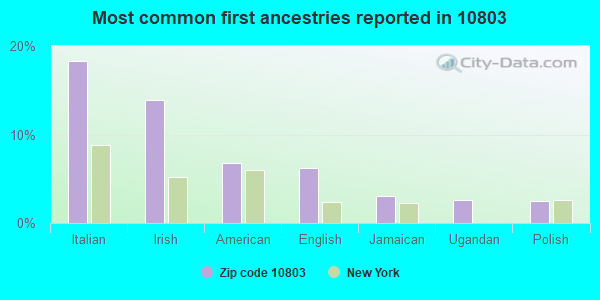
18%Italian
14%Irish
7%American
6%English
3%Jamaican
3%Ugandan
2%Polish
Year of entry for the foreign-born population
9202010 or later
4932000 to 2009
3321990 to 1999
698Before 1990
Major facilities with environmental interests located in this zip code:
GRAND CLEANERS (33 E LINCOLN AVE in PELHAM, NY)
AIR MINOR (AIRS/AFS) STATE MASTER (New York facility tracking) - AIR PROGRAM Conditionally Exempt Small Quantity Generators, less than 100 kg/month of hazardous waste (Resource Conservation and Recovery Act (tracking hazardous waste)) - notification TRANSPORTER (Resource Conservation and Recovery Act (tracking hazardous waste)) - notification Business SIC classification: DRYCLEANING PLANTS, EXCEPT RUG CLEANING Business NAICS classification: DRYCLEANING AND LAUNDRY SERVICES (EXCEPT COIN-OPERATED). Organizations: GRAND CLEANERS INC (AIR PERMITTING FACILITY OWNER CONTACT)
, JIN KIM (CONTACT/OWNER)
CRYSTAL CLEANERS (113 WOLFS LANE in PELHAM, NY)
AIR MINOR (AIRS/AFS) STATE MASTER (New York facility tracking) - AIR PROGRAM, HAZARDOUS WASTE PROGRAM Small Quantity Generators, between 100 kg and 1000 kg of hazardous waste/month (Resource Conservation and Recovery Act (tracking hazardous waste)) Business SIC classification: DRYCLEANING PLANTS, EXCEPT RUG CLEANING Business NAICS classification: DRYCLEANING AND LAUNDRY SERVICES (EXCEPT COIN-OPERATED). Organizations: A & M CRYSTAL CLEANERS LAUNDERERS INC (AIR PERMITTING FACILITY OWNER CONTACT)
Alternative names: H&M CRYSTAL CLEANERS LAUNDERERS INC
GETTY#58535 (4780 BOSTON POST RD in PELHAM MANOR, NY)
STATE MASTER (New York facility tracking) - AIR PROGRAM (Resource Conservation and Recovery Act (tracking hazardous waste)) Business SIC classification: GASOLINE SERVICE STATIONS Organizations: GETTY PETROLEUM MARKETING INC, TIDEWATER OIL COMPANY (LEGALLY RESPONSIBLE PARTY)
Alternative names: GETTY SERVICE STATION, GETTY SERVICE STATION PELHAM MANOR
HUTCHINSON SCHOOL ( in PELHAM, NY)
(Geographic Names Information System) (National Center for Education Statistics) - STATE ID-661601030002 Organizations: PELHAM UFSD (SCHOOL DISTRICT)
AMOCO SERVICE STATION (4391 BOSTON POST ROAD in PELHAM MANOR, NY)
STATE MASTER (New York facility tracking) - AIR PROGRAM Conditionally Exempt Small Quantity Generators, less than 100 kg/month of hazardous waste (Resource Conservation and Recovery Act (tracking hazardous waste)) - notification Organizations: AMOCO OIL CO (CONTACT/OWNER)
Alternative names: AMOCO CORPORATION
COLONIAL SCHOOL ( in PELHAM, NY)
(Geographic Names Information System) (National Center for Education Statistics) - STATE ID-661601030001 Organizations: PELHAM UFSD (SCHOOL DISTRICT)
CON ED PELHAM PARKWAY (PELHAM PARKWAY AND BOSTON POST ROAD in PELHAM MANOR, NY)
HAZARDOUS WASTE BIENNIAL REPORTER (Resource Conservation and Recovery Act (tracking hazardous waste)) (Resource Conservation and Recovery Act (tracking hazardous waste)) Alternative names: CON ED - PELHAM PKWY
GETTY PETROLEUM CORP (185 E LINCOLN AVE in PELHAM, NY)
(Resource Conservation and Recovery Act (tracking hazardous waste))
CON EDISION - MH8990 (BOULEVARD AND CAROL ST BOULEVA in PELHAM MANOR, NY)
HAZARDOUS WASTE BIENNIAL REPORTER (Resource Conservation and Recovery Act (tracking hazardous waste)) Large Quantity Generators, more that 1000 kg of hazardous waste/month (Resource Conservation and Recovery Act (tracking hazardous waste)) Business NAICS classification: ELECTRIC POWER DISTRIBUTION.
629 5TH AVENUE REALTY LLC (629 5TH AVE - NW COR TANK REMOVAL in PELHAM, NY)
Conditionally Exempt Small Quantity Generators, less than 100 kg/month of hazardous waste (Resource Conservation and Recovery Act (tracking hazardous waste))
A G WILLIAMS CO INC (411 FIFTH AVE in PELHAM, NY)
Small Quantity Generators, between 100 kg and 1000 kg of hazardous waste/month (Resource Conservation and Recovery Act (tracking hazardous waste)) - notification TRANSPORTER (Resource Conservation and Recovery Act (tracking hazardous waste)) - notification Organizations: GAW MANAGEMENT CO (CONTACT/OWNER)
ALL MODEL AUTO REPAIR INC (40 SECOR LANE in PELHAM MANOR, NY)
(Resource Conservation and Recovery Act (tracking hazardous waste))
CONSUMER PRODUCTIONS (5 PENN PLACE in PELHAM MANOR, NY)
Small Quantity Generators, between 100 kg and 1000 kg of hazardous waste/month (Resource Conservation and Recovery Act (tracking hazardous waste)) Organizations: CONSUMER PRODUCTSION (CONTACT/OWNER)
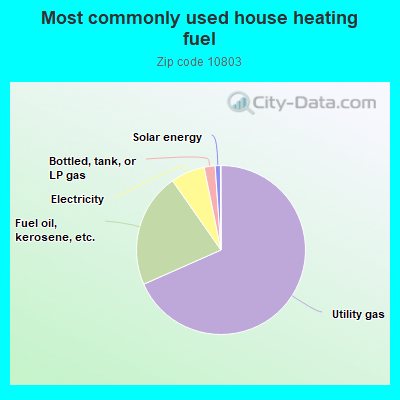
68.3%Utility gas
21.9%Fuel oil, kerosene, etc.
6.5%Electricity
2.1%Bottled, tank, or LP gas
1.0%Solar energy
Population in 1990: 11,997. Population change in the 1990s: +127 (+1.1%).
Place of birth for U.S.-born residents:
This state: 7,268
Northeast: 1,545
Midwest: 814
South: 485
West: 604
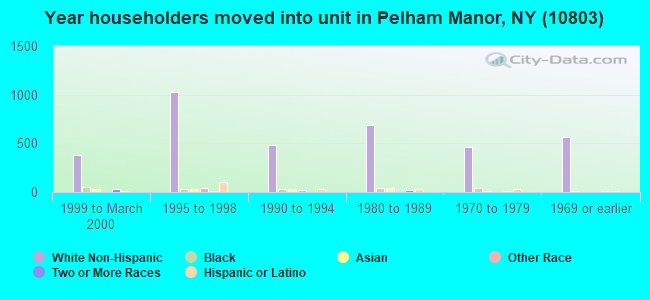
67% of the 10803 zip code residents lived in the same house 5 years ago. Out of people who lived in different houses, 52% lived in this county. Out of people who lived in different counties, 50% lived in New York.
91% of the 10803 zip code residents lived in the same house 1 year ago. Out of people who lived in different houses, 24% moved from this county. Out of people who lived in different houses, 45% moved from different county within same state. Out of people who lived in different houses, 17% moved from different state. Out of people who lived in different houses, 17% moved from abroad.
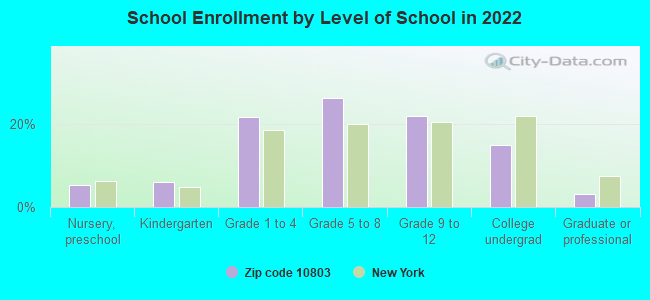
Private vs. public school enrollment:
Students in private schools in grades 1 to 8 (elementary and middle school): 74
Here:
3.5%
New York:
15.6%
Students in private schools in grades 9 to 12 (high school): 67
Here:
7.0%
New York:
15.0%
Students in private undergraduate colleges: 339
Here:
50.6%
New York:
39.2%
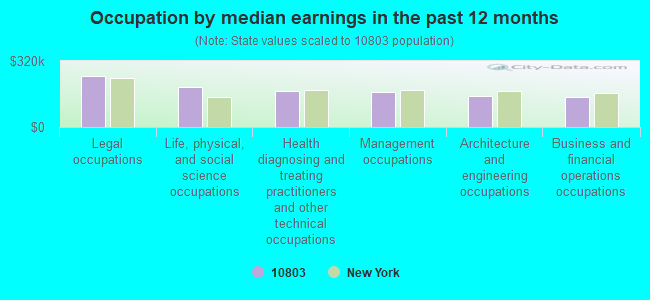
Occupation by median earnings in the past 12 months ($)
247,483Legal occupations
193,300Life, physical, and social science occupations
173,245Health diagnosing and treating practitioners and other technical occupations
167,371Management occupations
148,695Architecture and engineering occupations
146,446Business and financial operations occupations
Companies with federal contracts located in this zip code:
PICO ELECTRONICS, INC (143 SPARKS AVE in PELHAM, NY; small business) : $7,265,990 in 114 contractsfrom 1999 to 2006
Contracts for Coils and Transformers, Wire and Cable, Electrical, Miscellaneous Electrical and Electronic Components, Cable, Cord, and Wire Assemblies: Communications Equipment, and moreby Bureau of Prisoners/Federal Prison System, Navy, Defense Logistics Agency, Army, and others Signed by year:2000: $181,187; 2001: $364,970; 2002: $434,000; 2003: $686,393; 2004: $1,192,143; 2005: $3,435,976; 2006: $956,321.
Biggest contracts:
$1,795,862 with Bureau of Prisoners/Federal Prison System for Coils and Transformers. Signed on 2005-09-21. Completion date: 2005-09-21.
$613,975, same as above.Signed on 2006-01-18. Completion date: 2006-01-18.
$449,250, same as above.Signed on 2005-12-01. Completion date: 2005-12-01.
$299,500, same as above.Signed on 2006-07-18. Completion date: 2010-09-20.
HOSPAC/CALIGOR (846 PELHAM PARKWAY in PELHAM MANOR, NY) : $527,398 in 62 contractsfrom 2000 to 2006
Contracts for Hospital Furniture, Equipment, Utensils, and Supplies, Medical and Surgical Instruments, Equipment, and Supplies, Other Medical -- Basic Research (R&D), Replenishable Field Medical Sets, Kits, and Outfits, and moreby Army, Bureau of Prisoners/Federal Prison System, Department of State, Defense Logistics Agency, and others Signed by year:2000: $78,000; 2001: $0; 2002: $36,000; 2003: $8,171; 2004: $198,300; 2005: $187,725; 2006: $19,202.
Biggest contracts:
$71,257 with Army for Hospital Furniture, Equipment, Utensils, and Supplies. Taking place in SC. Signed on 2004-09-14. Completion date: 2004-10-08.
$42,000 with Bureau of Prisoners/Federal Prison System for Hospital Furniture, Equipment, Utensils, and Supplies. Taking place in PA. Signed on 2000-04-15. Completion date: 2000-05-15.
$36,000 with Department of State for Medical and Surgical Instruments, Equipment, and Supplies. Signed on 2002-09-15. Completion date: 2002-10-15.
$36,000 with Bureau of Prisoners/Federal Prison System for Hospital Furniture, Equipment, Utensils, and Supplies. Taking place in PA. Signed on 2000-05-15. Completion date: 2000-06-15.
DENTSERV MANAGEMENT SERVICE (15 CANAL RD in PELHAM MANOR, NY; small business) : $112,320 in 3 contractsfrom 1999 to 2001
$37,440 with Navy for Optometry Services. Taking place in NC. Signed on 2001-10-01. Completion date: 2002-09-30.
$37,440, same as above.Signed on 2000-10-01. Completion date: 2001-09-30.
$37,440, same as above.Signed on 1999-10-01. Completion date: 2000-09-30.
G & S TOOL , AEROSPACE ENGINEE (111 SIXTH STREET in PELHAM, NY; small business)
$69,408 with Army for Electrical and Electronic Properties Measuring and Testing Instruments. Signed on 2000-08-23. Completion date: 2001-03-30.
Top industries in this zip code by the number of employees in 2005:
2002 - 2018 National Fire Incident Reporting System (NFIRS) incidents
According to the data from the years 2002 - 2018 the average number of fires per year is 33. The highest number of reported fire incidents - 61 took place in 2012, and the least - 0 in 2006. The data has a growing trend.
When looking into fire subcategories, the most incidents belonged to: Structure Fires (60.2%), and Outside Fires (19.3%).
Fire incident types reported to NFIRS in Zip Code 10803
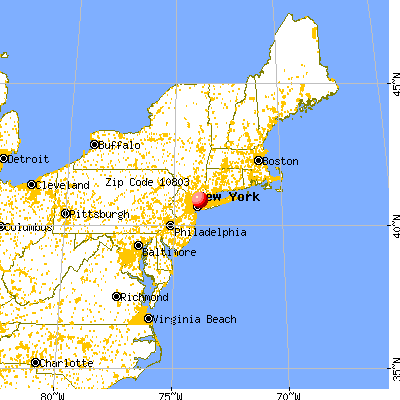


 Nearest zip codes: 10553, 10805, 10801, 10550, 10475, 10552.


 According to the data from the years 2002 - 2018 the average number of fires per year is 33. The highest number of reported fire incidents - 61 took place in 2012, and the least - 0 in 2006. The data has a growing trend.
 When looking into fire subcategories, the most incidents belonged to: Structure Fires (60.2%), and Outside Fires (19.3%).