Estimated zip code population in 2022: 20,407 Zip code population in 2010: 18,414 Zip code population in 2000: 17,957
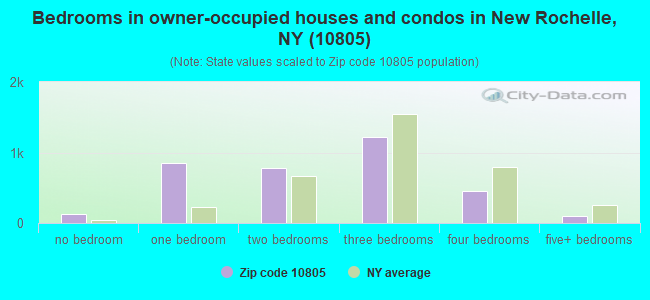
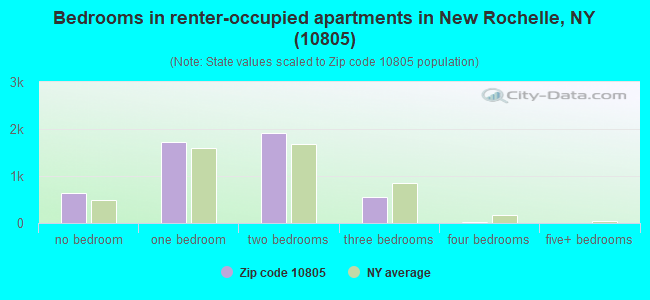
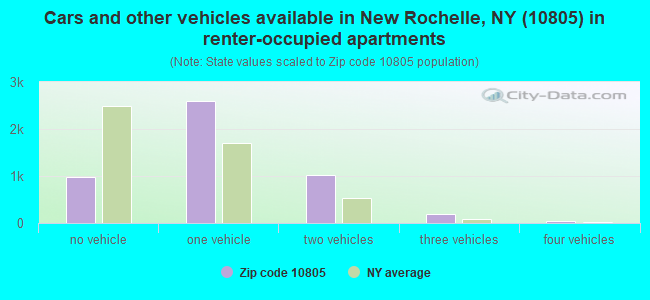
Houses and condos: 8,425 Renter-occupied apartments: 4,836
% of renters here:
58%
State:
46%
March 2022 cost of living index in zip code 10805: 147.2 (very high, U.S. average is 100)
Land area: 1.7 sq. mi. Water area: 0.0 sq. mi.
Population density: 11,827 people per square mile
(high).
OSM Map
General Map
Google Map
MSN Map
OSM Map
General Map
Google Map
MSN Map
OSM Map
General Map
Google Map
MSN Map
OSM Map
General Map
Google Map
MSN Map
Please wait while loading the map...
Real estate property taxes paid for housing units in 2022:
This zip code:
1.9% ($7,113)
New York:
1.5% ($6,180)
Median real estate property taxes paid for housing units with mortgages in 2022: $9,858 (2.4%) Median real estate property taxes paid for housing units with no mortgage in 2022: $6,111 (1.7%)
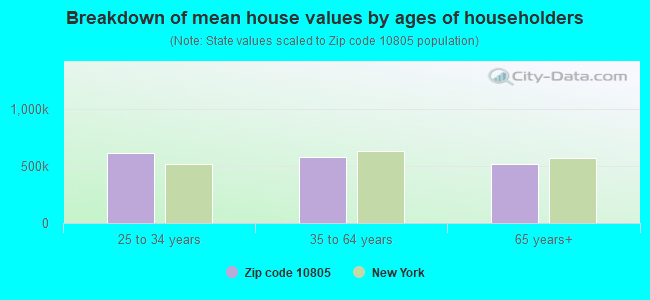
Estimated median house/condo value in 2022: $380,385
10805:
$380,385
New York:
$400,400
According to our research of New York and other state lists, there were 4 registered sex offenders living in 10805 zip code as of April 27, 2024. The ratio of all residents to sex offenders in zip code 10805 is 4,692 to 1. The ratio of registered sex offenders to all residents in this zip code is much lower than the state average.
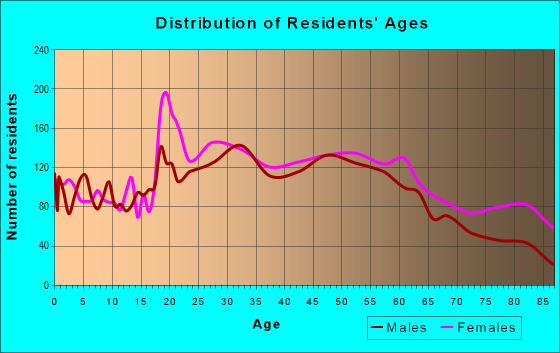
Median resident age:
This zip code:
43.7 years
New York median age:
40.0 years
Average household size:
This zip code:
2.3 people
New York:
2.5 people
Averages for the 2020 tax year for zip code 10805, filed in 2021:
Average Adjusted Gross Income (AGI) in 2020: $76,274 (Individual Income Tax Returns)
Here:
$76,274
State:
$90,930
Salary/wage: $66,298 (reported on 78.8% of returns)
Here:
$66,298
State:
$72,104
(% of AGI for various income ranges: 1092.9% for AGIs below $25k, 3564.3% for AGIs $25k-50k, 6922.4% for AGIs $50k-75k, 10376.8% for AGIs $75k-100k, 17447.5% for AGIs $100k-200k, 91300.8% for AGIs over 200k)
Taxable interest for individuals: $2,305 (reported on 29.3% of returns)
This zip code:
$2,305
New York:
$3,075
(% of AGI for various income ranges: 15.2% for AGIs below $25k, 25.1% for AGIs $25k-50k, 43.5% for AGIs $50k-75k, 98.6% for AGIs $75k-100k, 150.8% for AGIs $100k-200k, 2523.8% for AGIs over 200k)
Ordinary dividends: $7,948 (reported on 18.6% of returns)
Here:
$7,948
State:
$11,095
(% of AGI for various income ranges: 29.5% for AGIs below $25k, 41.2% for AGIs $25k-50k, 93.4% for AGIs $50k-75k, 173.0% for AGIs $75k-100k, 354.3% for AGIs $100k-200k, 5825.4% for AGIs over 200k)
Net capital gain/loss in AGI: +$24,400 (reported on 17.8% of returns)
Here:
+$24,400
State:
+$44,925
(% of AGI for various income ranges: 11.5% for AGIs below $25k, 39.5% for AGIs $25k-50k, 60.7% for AGIs $50k-75k, 95.7% for AGIs $75k-100k, 481.9% for AGIs $100k-200k, 26940.0% for AGIs over 200k)
Profit/loss from business: +$13,545 (reported on 18.2% of returns)
Here:
+$13,545
State:
+$14,940
(% of AGI for various income ranges: 307.8% for AGIs below $25k, 238.0% for AGIs $25k-50k, 182.3% for AGIs $50k-75k, 244.5% for AGIs $75k-100k, 363.5% for AGIs $100k-200k, 5927.7% for AGIs over 200k)
Taxable individual retirement arrangement distribution: $20,701 (reported on 7.0% of returns)
10805:
$20,701
New York:
$19,609
(% of AGI for various income ranges: 59.6% for AGIs below $25k, 78.8% for AGIs $25k-50k, 118.4% for AGIs $50k-75k, 213.0% for AGIs $75k-100k, 528.1% for AGIs $100k-200k, 3155.4% for AGIs over 200k)
Self-employed (Keogh) retirement plans: $27,540 (reported on 0.5% of returns)
10805:
$27,540
New York:
$32,497
(% of AGI for various income ranges: 1059.2% for AGIs over 200k)
Total itemized deductions: $32,150 (reported on 11.0% of returns)
Here:
$32,150
State:
$39,326
(% of AGI for various income ranges: 77.5% for AGIs below $25k, 109.7% for AGIs $25k-50k, 316.4% for AGIs $50k-75k, 537.8% for AGIs $75k-100k, 1163.9% for AGIs $100k-200k, 9976.2% for AGIs over 200k)
Charity contributions: $10,487 (reported on 9.5% of returns)
Here:
$10,487
State:
$15,420
(% of AGI for various income ranges: 5.1% for AGIs below $25k, 9.6% for AGIs $25k-50k, 42.3% for AGIs $50k-75k, 74.1% for AGIs $75k-100k, 217.6% for AGIs $100k-200k, 4893.8% for AGIs over 200k)
Taxes paid: $8,707 (reported on 11.0% of returns)
10805:
$8,707
State:
$9,183
(% of AGI for various income ranges: 15.5% for AGIs below $25k, 24.9% for AGIs $25k-50k, 94.7% for AGIs $50k-75k, 178.1% for AGIs $75k-100k, 411.1% for AGIs $100k-200k, 1916.9% for AGIs over 200k)
Earned income credit: $1,809 (reported on 11.5% of returns)
Here:
$1,809
State:
$2,138
(% of AGI for various income ranges: 76.6% for AGIs below $25k, 46.4% for AGIs $25k-50k)
Percentage of individuals using paid preparers for their 2020 taxes: 92.9%
Here:
93%
State:
95%
(% for various income ranges: 89.1% for AGIs below $25k, 92.7% for AGIs $25k-50k, 95.2% for AGIs $50k-75k, 95.3% for AGIs $75k-100k, 94.7% for AGIs $100k-200k, 96.0% for AGIs over 200k)
Averages for the 2012 tax year for zip code 10805, filed in 2013:
Average Adjusted Gross Income (AGI) in 2012: $63,086 (Individual Income Tax Returns)
Here:
$63,086
State:
$77,088
Salary/wage: $58,050 (reported on 81.2% of returns)
Here:
$58,050
State:
$60,593
(% of AGI for various income ranges: 64.7% for AGIs below $25k, 81.2% for AGIs $25k-50k, 83.2% for AGIs $50k-75k, 83.0% for AGIs $75k-100k, 79.0% for AGIs $100k-200k, 59.1% for AGIs over 200k)
Taxable interest for individuals: $1,570 (reported on 36.1% of returns)
This zip code:
$1,570
New York:
$3,125
(% of AGI for various income ranges: 1.3% for AGIs below $25k, 0.7% for AGIs $25k-50k, 0.5% for AGIs $50k-75k, 0.5% for AGIs $75k-100k, 0.8% for AGIs $100k-200k, 1.4% for AGIs over 200k)
Ordinary dividends: $5,921 (reported on 18.8% of returns)
Here:
$5,921
State:
$10,299
(% of AGI for various income ranges: 1.9% for AGIs below $25k, 0.8% for AGIs $25k-50k, 1.1% for AGIs $50k-75k, 1.0% for AGIs $75k-100k, 1.2% for AGIs $100k-200k, 3.7% for AGIs over 200k)
Net capital gain/loss in AGI: +$10,093 (reported on 13.4% of returns)
Here:
+$10,093
State:
+$42,474
(% of AGI for various income ranges: 0.3% for AGIs $50k-75k, 0.7% for AGIs $100k-200k, 7.9% for AGIs over 200k)
Profit/loss from business: +$11,175 (reported on 17.0% of returns)
Here:
+$11,175
State:
+$16,168
(% of AGI for various income ranges: 15.9% for AGIs below $25k, 3.8% for AGIs $25k-50k, 1.3% for AGIs $50k-75k, 1.2% for AGIs $75k-100k, 2.0% for AGIs $100k-200k, 2.4% for AGIs over 200k)
Taxable individual retirement arrangement distribution: $14,082 (reported on 8.7% of returns)
10805:
$14,082
New York:
$17,621
(% of AGI for various income ranges: 2.9% for AGIs below $25k, 1.8% for AGIs $25k-50k, 1.6% for AGIs $50k-75k, 2.2% for AGIs $75k-100k, 2.4% for AGIs $100k-200k, 1.4% for AGIs over 200k)
Self-employment retirement plans: $22,580 (reported on 0.5% of returns)
10805:
$22,580
New York:
$27,330
Total itemized deductions: $25,828 (23% of AGI, reported on 37.6% of returns)
Here:
$25,828
State:
$34,985
Here:
23.3% of AGI
State:
21.3% of AGI
(% of AGI for various income ranges: 12.6% for AGIs below $25k, 13.0% for AGIs $25k-50k, 13.4% for AGIs $50k-75k, 15.2% for AGIs $75k-100k, 17.2% for AGIs $100k-200k, 17.2% for AGIs over 200k)
Charity contributions: $3,486 (reported on 32.3% of returns)
Here:
$3,486
State:
$5,572
(% of AGI for various income ranges: 0.7% for AGIs below $25k, 1.3% for AGIs $25k-50k, 1.6% for AGIs $50k-75k, 1.9% for AGIs $75k-100k, 1.9% for AGIs $100k-200k, 2.3% for AGIs over 200k)
Taxes paid: $11,861 (reported on 37.4% of returns)
10805:
$11,861
State:
$18,656
(% of AGI for various income ranges: 3.6% for AGIs below $25k, 3.7% for AGIs $25k-50k, 4.8% for AGIs $50k-75k, 6.3% for AGIs $75k-100k, 8.2% for AGIs $100k-200k, 10.7% for AGIs over 200k)
Earned income credit: $1,960 (reported on 13.2% of returns)
Here:
$1,960
State:
$2,230
(% of AGI for various income ranges: 4.9% for AGIs below $25k, 0.7% for AGIs $25k-50k)
Percentage of individuals using paid preparers for their 2012 taxes: 71.1%
Here:
71%
State:
66%
(% for various income ranges: 70.3% for AGIs below $25k, 69.3% for AGIs $25k-50k, 71.1% for AGIs $50k-75k, 71.7% for AGIs $75k-100k, 71.8% for AGIs $100k-200k, 86.2% for AGIs over 200k)
Averages for the 2004 tax year for zip code 10805, filed in 2005:
Average Adjusted Gross Income (AGI) in 2004: $54,065 (Individual Income Tax Returns)
Here:
$54,065
State:
$59,519
Salary/wage: $48,597 (reported on 81.5% of returns)
Here:
$48,597
State:
$50,673
(% of AGI for various income ranges: 115.4% for AGIs below $10k, 71.1% for AGIs $10k-25k, 84.1% for AGIs $25k-50k, 86.0% for AGIs $50k-75k, 83.4% for AGIs $75k-100k, 58.2% for AGIs over 100k)
Taxable interest for individuals: $1,821 (reported on 52.1% of returns)
This zip code:
$1,821
New York:
$2,377
(% of AGI for various income ranges: 8.7% for AGIs below $10k, 2.4% for AGIs $10k-25k, 1.3% for AGIs $25k-50k, 1.2% for AGIs $50k-75k, 1.1% for AGIs $75k-100k, 2.2% for AGIs over 100k)
Taxable dividends: $3,089 (reported on 24.9% of returns)
Here:
$3,089
State:
$5,394
(% of AGI for various income ranges: 9.3% for AGIs below $10k, 1.8% for AGIs $10k-25k, 0.8% for AGIs $25k-50k, 0.8% for AGIs $50k-75k, 1.2% for AGIs $75k-100k, 1.8% for AGIs over 100k)
Net capital gain/loss: +$14,372 (reported on 20.5% of returns)
Here:
+$14,372
State:
+$23,581
(% of AGI for various income ranges: -6.3% for AGIs below $10k, -0.4% for AGIs $10k-25k, 0.1% for AGIs $25k-50k, 0.6% for AGIs $50k-75k, 0.8% for AGIs $75k-100k, 12.9% for AGIs over 100k)
Profit/loss from business: +$11,978 (reported on 15.1% of returns)
Here:
+$11,978
State:
+$13,809
(% of AGI for various income ranges: 28.4% for AGIs below $10k, 8.6% for AGIs $10k-25k, 3.8% for AGIs $25k-50k, 1.6% for AGIs $50k-75k, 1.8% for AGIs $75k-100k, 3.1% for AGIs over 100k)
IRA payment deduction: $3,108 (reported on 3.4% of returns)
10805:
$3,108
New York:
$3,115
(% of AGI for various income ranges: 0.3% for AGIs $10k-25k, 0.3% for AGIs $25k-50k, 0.2% for AGIs $50k-75k, 0.2% for AGIs $75k-100k, 0.1% for AGIs over 100k)
Self-employed pension: $22,000 (reported on 0.6% of returns)
Here:
$22,000
New York:
$19,016
Total itemized deductions: $20,268 (21% of AGI, reported on 38.6% of returns)
Here:
$20,268
State:
$25,864
Here:
21.4% of AGI
State:
21.9% of AGI
(% of AGI for various income ranges: 23.8% for AGIs below $10k, 10.9% for AGIs $10k-25k, 13.2% for AGIs $25k-50k, 15.8% for AGIs $50k-75k, 15.5% for AGIs $75k-100k, 14.4% for AGIs over 100k)
Charity contributions deductions: $3,293 (3% of AGI, reported on 35.9% of returns)
Here:
$3,293
State:
$4,439
Here:
3.4% of AGI
State:
3.6% of AGI
(% of AGI for various income ranges: 1.2% for AGIs below $10k, 1.2% for AGIs $10k-25k, 1.9% for AGIs $25k-50k, 2.6% for AGIs $50k-75k, 2.4% for AGIs $75k-100k, 2.3% for AGIs over 100k)
Total tax: $8,870 (reported on 79.6% of returns)
10805:
$8,870
State:
$11,730
(% of AGI for various income ranges: 6.3% for AGIs below $10k, 4.3% for AGIs $10k-25k, 7.7% for AGIs $25k-50k, 10.9% for AGIs $50k-75k, 12.4% for AGIs $75k-100k, 18.3% for AGIs over 100k)
Earned income credit: $1,490 (reported on 10.8% of returns)
Here:
$1,490
State:
$1,757
Percentage of individuals using paid preparers for their 2004 taxes: 69.6%
Here:
70%
State:
67%
(% for various income ranges: 63.3% for AGIs below $10k, 67.2% for AGIs $10k-25k, 69.3% for AGIs $25k-50k, 70.4% for AGIs $50k-75k, 75.3% for AGIs $75k-100k, 79.6% for AGIs over 100k)
Likely homosexual households (counted as self-reported same-sex unmarried-partner households)
Lesbian couples: 0.0% of all households
Gay men: 0.2% of all households
Household received Food Stamps/SNAP in the past 12 months: 929 Household did not receive Food Stamps/SNAP in the past 12 months: 7,326
Women who had a birth in the past 12 months: 304 (98 now married, 211 unmarried) Women who did not have a birth in the past 12 months: 4,599 (1,562 now married, 3,042 unmarried)
Housing units in zip code 10805 with a mortgage: 1,714 (146 second mortgage, 130 both second mortgage and home equity loan) Houses without a mortgage: 12
Median monthly owner costs for units with a mortgage: $2,464 Median monthly owner costs for units without a mortgage: $1,069
Residents with income below the poverty level in 2022:
This zip code:
9.7%
Whole state:
14.3%
Residents with income below 50% of the poverty level in 2022:
This zip code:
5.4%
Whole state:
6.8%
Median number of rooms in houses and condos:
Here:
5.0
State:
6.3
Median number of rooms in apartments:
Here:
3.9
State:
3.8
Notable locations in this zip code not listed on our city pages
Notable locations in zip code 10805: Mooney Center (A), Gill Library (B), Chidwick Hall (C), Rogick Life Sciences Buliding (D), Maura Hall (E), Brescia Hall (F), Leland Castle (G), Holy Family Chapel (H), Ursula Hall (I), Angela Hall (J), Newman Hall (K), Notre Dame Hall (L), Chelsea Hall (M), Harbor House (N), Milavec Hall (O), Bayberry Nursing Home (P), Dumont Masonic Nursing Home (Q), Glen Island Center for Nursing and Rehabilitation (R). Display/hide their locations on the map
Churches in zip code 10805 include: Kingdom Hall of Jehovahs Witnesses (A), Saint Simon's Episcopal Church (B), Blessed Sacrament Church (C), Ursuline Convent (D). Display/hide their locations on the map
Parks in zip code 10805 include: Aiello Park (1), D'Onofrio Park (2), Leif Erickson Park (3), Maura Lawn (4), Hudson Park (5), Davenport Park (6), Foy Park (7), Neptune Park (8), Titus Mill Pond State Tidal Wetlands (9). Display/hide their locations on the map
In group quarters: 1,006 (-1 institutionalized population)
Size of family households: 2,360 2-persons, 1,390 3-persons, 728 4-persons, 492 5-persons, 198 6-persons, 53 7-or-more-persons
Size of nonfamily households: 2,739 1-person, 323 2-persons, 8 3-persons
2,051 married couples with children.
826 single-parent households (160 men, 666 women).
55.2% of residents of 10805 zip code speak English at home.
31.7% of residents speak Spanish at home (55% very well, 20% well, 23% not well, 3% not at all).
9.4% of residents speak other Indo-European language at home (49% very well, 40% well, 11% not well).
3.0% of residents speak Asian or Pacific Island language at home (46% very well, 38% well, 16% not well, 1% not at all).
0.8% of residents speak other language at home (82% very well, 18% well).
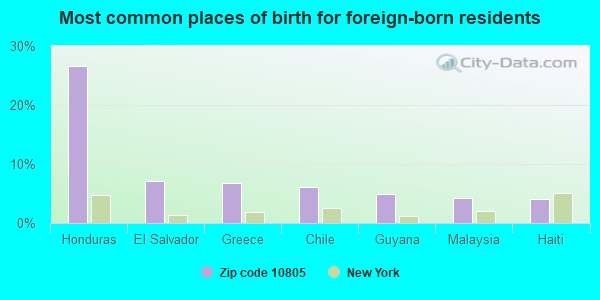
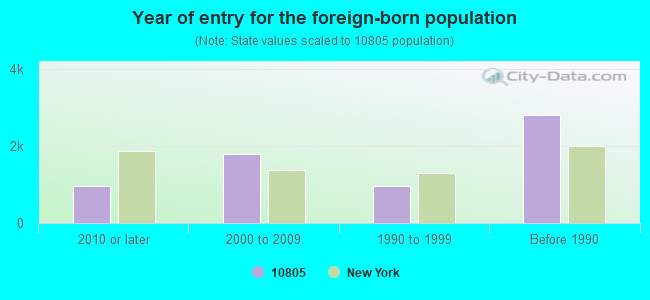
Foreign born population: 6,219 (30.5%) (58.6% of them are naturalized citizens)
Facilities with environmental interests located in this zip code:
ABSOLUTE DRY CLEANERS (376 PELHAM RD in NEW ROCHELLE, NY)
AIR MINOR (AIRS/AFS) STATE MASTER (New York facility tracking) - AIR PROGRAM, HAZARDOUS WASTE PROGRAM Small Quantity Generators, between 100 kg and 1000 kg of hazardous waste/month (Resource Conservation and Recovery Act (tracking hazardous waste)) - notification Business SIC classification: DRYCLEANING PLANTS, EXCEPT RUG CLEANING Business NAICS classification: DRYCLEANING AND LAUNDRY SERVICES (EXCEPT COIN-OPERATED). Organizations: ABSOLUTE DRY CLEANING (CONTACT/OWNER)
GETTY SERVICE STATION (758 PELHAM ROAD in NEW ROCHELLE, NY)
STATE MASTER (New York facility tracking) - AIR PROGRAM (Resource Conservation and Recovery Act (tracking hazardous waste)) Organizations: GETTY PETROLEUM MARKETING INC (LEGALLY RESPONSIBLE PARTY)
Alternative names: GETTY PETROLEUM CORP
ISAAC E. YOUNG MS ( in NEW ROCHELLE, NY)
(National Center for Education Statistics) - STATE ID-661100010014 Organizations: NEW ROCHELLE CITY SD (SCHOOL DISTRICT)
HOME DEPOT THE (45 WEYMAN AVENUE in NEW ROCHELLE, NY)
(Resource Conservation and Recovery Act (tracking hazardous waste))
CON ED - 4-50 TRANSMISSION FDR (BETW DAVID & PEA ISLAND in NEW ROCHELLE, NY)
Large Quantity Generators, more that 1000 kg of hazardous waste/month (Resource Conservation and Recovery Act (tracking hazardous waste)) - notification Organizations: CONSOLIDATED EDISON CO OF NY (CONTACT/OWNER)
CON ED - V129 (PELHAM RD & WHITEWOOD AVE in NEW ROCHELLE, NY)
HAZARDOUS WASTE BIENNIAL REPORTER (Resource Conservation and Recovery Act (tracking hazardous waste)) (Resource Conservation and Recovery Act (tracking hazardous waste))
HOME DEPOT THE (27 WEYMAN AVE in NEW ROCHELLE, NY)
(Resource Conservation and Recovery Act (tracking hazardous waste))
CON EDISON (26 DAVIS AVE in NEW ROCHELLE, NY)
(Resource Conservation and Recovery Act (tracking hazardous waste))
COSTCO WHOLESALE #241 (1 INDUSTRIAL LANE in NEW ROCHELLE, NY)
(Resource Conservation and Recovery Act (tracking hazardous waste))
COLLEGE OF NEW ROCHELLE (29 CASTLE PL in NEW ROCHELLE, NY)
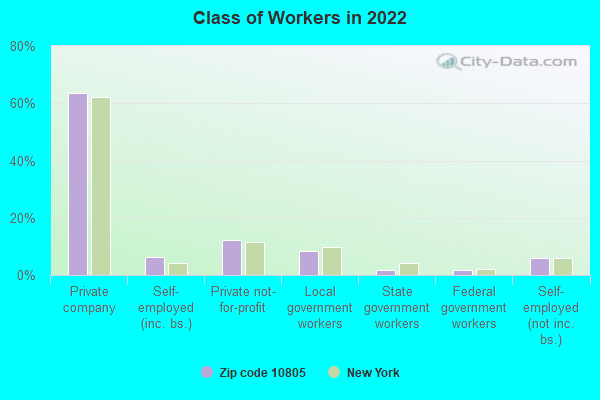
(Resource Conservation and Recovery Act (tracking hazardous waste))
Housing units lacking complete plumbing facilities: 0.6% Housing units lacking complete kitchen facilities: 0.9%
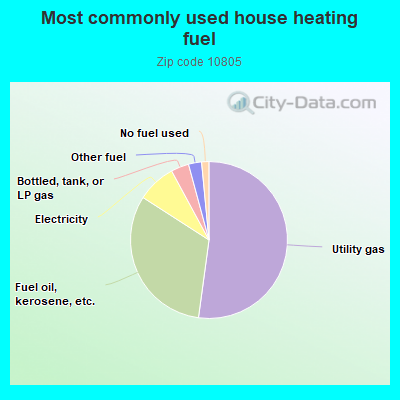
52.2%Utility gas
32.0%Fuel oil, kerosene, etc.
8.0%Electricity
3.7%Bottled, tank, or LP gas
2.7%Other fuel
1.5%No fuel used
Population in 1990: 18,471.
Place of birth for U.S.-born residents:
This state: 11,642
Northeast: 901
Midwest: 424
South: 593
West: 168
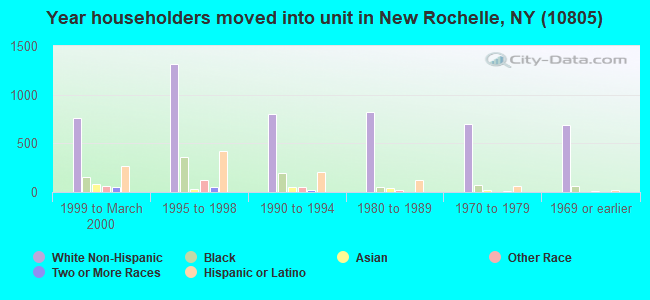
58% of the 10805 zip code residents lived in the same house 5 years ago. Out of people who lived in different houses, 61% lived in this county. Out of people who lived in different counties, 50% lived in New York.
90% of the 10805 zip code residents lived in the same house 1 year ago. Out of people who lived in different houses, 40% moved from this county. Out of people who lived in different houses, 50% moved from different county within same state. Out of people who lived in different houses, 10% moved from different state. Out of people who lived in different houses, 1% moved from abroad.
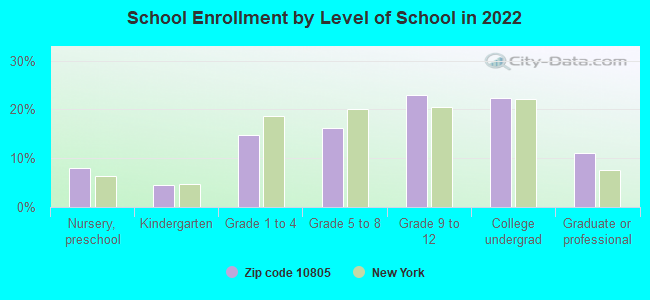
Private vs. public school enrollment:
Students in private schools in grades 1 to 8 (elementary and middle school): 93
Here:
8.8%
New York:
15.6%
Students in private schools in grades 9 to 12 (high school): 92
Here:
11.7%
New York:
15.0%
Students in private undergraduate colleges: 263
Here:
34.0%
New York:
39.2%
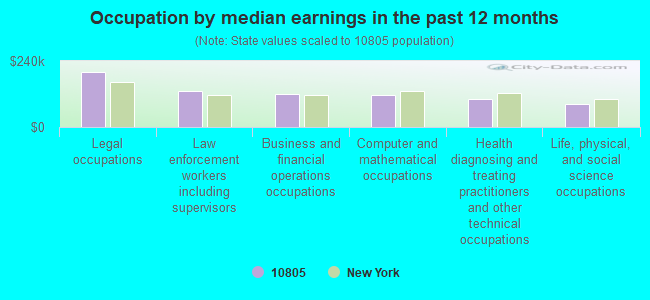
Occupation by median earnings in the past 12 months ($)
199,936Legal occupations
129,995Law enforcement workers including supervisors
119,808Business and financial operations occupations
117,778Computer and mathematical occupations
101,072Health diagnosing and treating practitioners and other technical occupations
82,933Life, physical, and social science occupations
Top industries in this zip code by the number of employees in 2005:
Health Care and Social Assistance: Nursing Care Facilities (250-499 employees: 2 establishments, 100-249 employees: 1 establishment, 50-99 employees: 1 establishment)
Educational Services: Colleges, Universities, and Professional Schools (500-999: 1)
2006 - 2018 National Fire Incident Reporting System (NFIRS) incidents
According to the data from the years 2006 - 2018 the average number of fires per year is 56. The highest number of reported fire incidents - 86 took place in 2017, and the least - 1 in 2011. The data has a growing trend.
When looking into fire subcategories, the most incidents belonged to: Structure Fires (74.4%), and Outside Fires (16.0%).
Fire incident types reported to NFIRS in Zip Code 10805
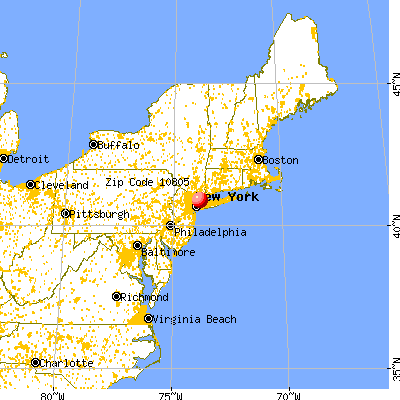


 Nearest zip codes: 10801, 10803, 10464, 10553, 10538, 10804.
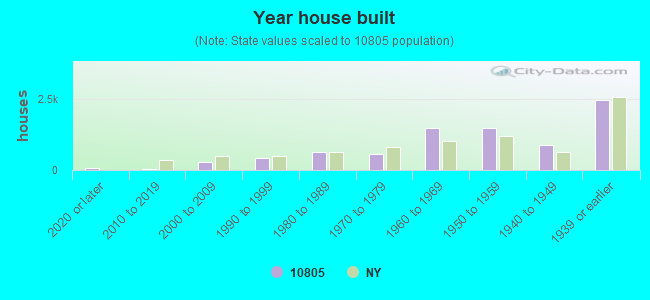


 According to the data from the years 2006 - 2018 the average number of fires per year is 56. The highest number of reported fire incidents - 86 took place in 2017, and the least - 1 in 2011. The data has a growing trend.
 When looking into fire subcategories, the most incidents belonged to: Structure Fires (74.4%), and Outside Fires (16.0%).