Estimated zip code population in 2022: 14,797
Zip code population in 2010: 14,146
Zip code population in 2000: 14,131
Houses and condos: 5,258
Renter-occupied apartments: 269
% of renters here:
5%State:
46%
March 2022 cost of living index in zip code 10804: 147.1
(very high, U.S. average is 100)
Land area: 4.3
sq. mi.
Water area: 0.1
sq. mi.
Population density: 3,414 people per square mile (average).
OSM Map
General Map
Google Map
MSN Map
OSM Map
General Map
Google Map
MSN Map
OSM Map
General Map
Google Map
MSN Map
OSM Map
General Map
Google Map
MSN Map
Please wait while loading the map...
Real estate property taxes paid for housing units in 2022:
This zip code:
1.1% ($9,805)New York:
1.5% ($6,180)
Median real estate property taxes paid for housing units with mortgages in 2022: $9,858 (1.0%)
Median real estate property taxes paid for housing units with no mortgage in 2022: $9,755 (1.1%)
Profiles of local businesses
Business Search - 14 Million verified businesses
Males: 7,696 Females: 7,101
For population 25 years and over in 10804:
High school or higher: 98.7%Bachelor's degree or higher: 79.6%Graduate or professional degree: 48.3%Unemployed: 3.3%Mean travel time to work (commute): 38.8 minutes
For population 15 years and over in 10804:
Never married: 23.3%Now married: 66.8%Separated: 0.2%Widowed: 4.7%Divorced: 5.0%
Zip code 10804 compared to state average:
Median household income significantly above state average. Median house value significantly above state average. Hispanic race population percentage below state average. Median age above state average. Foreign-born population percentage below state average. Renting percentage significantly below state average. Length of stay since moving in above state average. Number of rooms per house significantly above state average. Percentage of population with a bachelor's degree or higher above state average. 10,700 72.3% White 1,604 10.8% Black 1,498 10.1% Hispanic or Latino 646 4.4% Asian 300 2.0% Two or more races 47 0.3% Some other race
Data:
Median household income ($)
Median household income (% change since 2000)
Household income diversity
Ratio of average income to average house value (%)
Ratio of average income to average rent
Median household income ($) - White
Median household income ($) - Black or African American
Median household income ($) - Asian
Median household income ($) - Hispanic or Latino
Median household income ($) - American Indian and Alaska Native
Median household income ($) - Multirace
Median household income ($) - Other Race
Median household income for houses/condos with a mortgage ($)
Median household income for apartments without a mortgage ($)
Races - White alone (%)
Races - White alone (% change since 2000)
Races - Black alone (%)
Races - Black alone (% change since 2000)
Races - American Indian alone (%)
Races - American Indian alone (% change since 2000)
Races - Asian alone (%)
Races - Asian alone (% change since 2000)
Races - Hispanic (%)
Races - Hispanic (% change since 2000)
Races - Native Hawaiian and Other Pacific Islander alone (%)
Races - Native Hawaiian and Other Pacific Islander alone (% change since 2000)
Races - Two or more races (%)
Races - Two or more races (% change since 2000)
Races - Other race alone (%)
Races - Other race alone (% change since 2000)
Racial diversity
Unemployment (%)
Unemployment (% change since 2000)
Unemployment (%) - White
Unemployment (%) - Black or African American
Unemployment (%) - Asian
Unemployment (%) - Hispanic or Latino
Unemployment (%) - American Indian and Alaska Native
Unemployment (%) - Multirace
Unemployment (%) - Other Race
Population density (people per square mile)
Population - Males (%)
Population - Females (%)
Population - Males (%) - White
Population - Males (%) - Black or African American
Population - Males (%) - Asian
Population - Males (%) - Hispanic or Latino
Population - Males (%) - American Indian and Alaska Native
Population - Males (%) - Multirace
Population - Males (%) - Other Race
Population - Females (%) - White
Population - Females (%) - Black or African American
Population - Females (%) - Asian
Population - Females (%) - Hispanic or Latino
Population - Females (%) - American Indian and Alaska Native
Population - Females (%) - Multirace
Population - Females (%) - Other Race
Coronavirus confirmed cases (Apr 27, 2024)
Deaths caused by coronavirus (Apr 27, 2024)
Coronavirus confirmed cases (per 100k population) (Apr 27, 2024)
Deaths caused by coronavirus (per 100k population) (Apr 27, 2024)
Daily increase in number of cases (Apr 27, 2024)
Weekly increase in number of cases (Apr 27, 2024)
Cases doubled (in days) (Apr 27, 2024)
Hospitalized patients (Apr 18, 2022)
Negative test results (Apr 18, 2022)
Total test results (Apr 18, 2022)
COVID Vaccine doses distributed (per 100k population) (Sep 19, 2023)
COVID Vaccine doses administered (per 100k population) (Sep 19, 2023)
COVID Vaccine doses distributed (Sep 19, 2023)
COVID Vaccine doses administered (Sep 19, 2023)
Likely homosexual households (%)
Likely homosexual households (% change since 2000)
Likely homosexual households - Lesbian couples (%)
Likely homosexual households - Lesbian couples (% change since 2000)
Likely homosexual households - Gay men (%)
Likely homosexual households - Gay men (% change since 2000)
Cost of living index
Median gross rent ($)
Median contract rent ($)
Median monthly housing costs ($)
Median house or condo value ($)
Median house or condo value ($ change since 2000)
Mean house or condo value by units in structure - 1, detached ($)
Mean house or condo value by units in structure - 1, attached ($)
Mean house or condo value by units in structure - 2 ($)
Mean house or condo value by units in structure by units in structure - 3 or 4 ($)
Mean house or condo value by units in structure - 5 or more ($)
Mean house or condo value by units in structure - Boat, RV, van, etc. ($)
Mean house or condo value by units in structure - Mobile home ($)
Median house or condo value ($) - White
Median house or condo value ($) - Black or African American
Median house or condo value ($) - Asian
Median house or condo value ($) - Hispanic or Latino
Median house or condo value ($) - American Indian and Alaska Native
Median house or condo value ($) - Multirace
Median house or condo value ($) - Other Race
Median resident age
Resident age diversity
Median resident age - Males
Median resident age - Females
Median resident age - White
Median resident age - Black or African American
Median resident age - Asian
Median resident age - Hispanic or Latino
Median resident age - American Indian and Alaska Native
Median resident age - Multirace
Median resident age - Other Race
Median resident age - Males - White
Median resident age - Males - Black or African American
Median resident age - Males - Asian
Median resident age - Males - Hispanic or Latino
Median resident age - Males - American Indian and Alaska Native
Median resident age - Males - Multirace
Median resident age - Males - Other Race
Median resident age - Females - White
Median resident age - Females - Black or African American
Median resident age - Females - Asian
Median resident age - Females - Hispanic or Latino
Median resident age - Females - American Indian and Alaska Native
Median resident age - Females - Multirace
Median resident age - Females - Other Race
Commute - mean travel time to work (minutes)
Travel time to work - Less than 5 minutes (%)
Travel time to work - Less than 5 minutes (% change since 2000)
Travel time to work - 5 to 9 minutes (%)
Travel time to work - 5 to 9 minutes (% change since 2000)
Travel time to work - 10 to 19 minutes (%)
Travel time to work - 10 to 19 minutes (% change since 2000)
Travel time to work - 20 to 29 minutes (%)
Travel time to work - 20 to 29 minutes (% change since 2000)
Travel time to work - 30 to 39 minutes (%)
Travel time to work - 30 to 39 minutes (% change since 2000)
Travel time to work - 40 to 59 minutes (%)
Travel time to work - 40 to 59 minutes (% change since 2000)
Travel time to work - 60 to 89 minutes (%)
Travel time to work - 60 to 89 minutes (% change since 2000)
Travel time to work - 90 or more minutes (%)
Travel time to work - 90 or more minutes (% change since 2000)
Marital status - Never married (%)
Marital status - Now married (%)
Marital status - Separated (%)
Marital status - Widowed (%)
Marital status - Divorced (%)
Median family income ($)
Median family income (% change since 2000)
Median non-family income ($)
Median non-family income (% change since 2000)
Median per capita income ($)
Median per capita income (% change since 2000)
Median family income ($) - White
Median family income ($) - Black or African American
Median family income ($) - Asian
Median family income ($) - Hispanic or Latino
Median family income ($) - American Indian and Alaska Native
Median family income ($) - Multirace
Median family income ($) - Other Race
Median year house/condo built
Median year apartment built
Year house built - Built 2005 or later (%)
Year house built - Built 2000 to 2004 (%)
Year house built - Built 1990 to 1999 (%)
Year house built - Built 1980 to 1989 (%)
Year house built - Built 1970 to 1979 (%)
Year house built - Built 1960 to 1969 (%)
Year house built - Built 1950 to 1959 (%)
Year house built - Built 1940 to 1949 (%)
Year house built - Built 1939 or earlier (%)
Average household size
Household density (households per square mile)
Average household size - White
Average household size - Black or African American
Average household size - Asian
Average household size - Hispanic or Latino
Average household size - American Indian and Alaska Native
Average household size - Multirace
Average household size - Other Race
Occupied housing units (%)
Vacant housing units (%)
Owner occupied housing units (%)
Renter occupied housing units (%)
Vacancy status - For rent (%)
Vacancy status - For sale only (%)
Vacancy status - Rented or sold, not occupied (%)
Vacancy status - For seasonal, recreational, or occasional use (%)
Vacancy status - For migrant workers (%)
Vacancy status - Other vacant (%)
Residents with income below the poverty level (%)
Residents with income below 50% of the poverty level (%)
Children below poverty level (%)
Poor families by family type - Married-couple family (%)
Poor families by family type - Male, no wife present (%)
Poor families by family type - Female, no husband present (%)
Poverty status for native-born residents (%)
Poverty status for foreign-born residents (%)
Poverty among high school graduates not in families (%)
Poverty among people who did not graduate high school not in families (%)
Residents with income below the poverty level (%) - White
Residents with income below the poverty level (%) - Black or African American
Residents with income below the poverty level (%) - Asian
Residents with income below the poverty level (%) - Hispanic or Latino
Residents with income below the poverty level (%) - American Indian and Alaska Native
Residents with income below the poverty level (%) - Multirace
Residents with income below the poverty level (%) - Other Race
Air pollution - Air Quality Index (AQI)
Air pollution - CO
Air pollution - NO2
Air pollution - SO2
Air pollution - Ozone
Air pollution - PM10
Air pollution - PM25
Air pollution - Pb
Crime - Murders per 100,000 population
Crime - Rapes per 100,000 population
Crime - Robberies per 100,000 population
Crime - Assaults per 100,000 population
Crime - Burglaries per 100,000 population
Crime - Thefts per 100,000 population
Crime - Auto thefts per 100,000 population
Crime - Arson per 100,000 population
Crime - City-data.com crime index
Crime - Violent crime index
Crime - Property crime index
Crime - Murders per 100,000 population (5 year average)
Crime - Rapes per 100,000 population (5 year average)
Crime - Robberies per 100,000 population (5 year average)
Crime - Assaults per 100,000 population (5 year average)
Crime - Burglaries per 100,000 population (5 year average)
Crime - Thefts per 100,000 population (5 year average)
Crime - Auto thefts per 100,000 population (5 year average)
Crime - Arson per 100,000 population (5 year average)
Crime - City-data.com crime index (5 year average)
Crime - Violent crime index (5 year average)
Crime - Property crime index (5 year average)
1996 Presidential Elections Results (%) - Democratic Party (Clinton)
1996 Presidential Elections Results (%) - Republican Party (Dole)
1996 Presidential Elections Results (%) - Other
2000 Presidential Elections Results (%) - Democratic Party (Gore)
2000 Presidential Elections Results (%) - Republican Party (Bush)
2000 Presidential Elections Results (%) - Other
2004 Presidential Elections Results (%) - Democratic Party (Kerry)
2004 Presidential Elections Results (%) - Republican Party (Bush)
2004 Presidential Elections Results (%) - Other
2008 Presidential Elections Results (%) - Democratic Party (Obama)
2008 Presidential Elections Results (%) - Republican Party (McCain)
2008 Presidential Elections Results (%) - Other
2012 Presidential Elections Results (%) - Democratic Party (Obama)
2012 Presidential Elections Results (%) - Republican Party (Romney)
2012 Presidential Elections Results (%) - Other
2016 Presidential Elections Results (%) - Democratic Party (Clinton)
2016 Presidential Elections Results (%) - Republican Party (Trump)
2016 Presidential Elections Results (%) - Other
2020 Presidential Elections Results (%) - Democratic Party (Biden)
2020 Presidential Elections Results (%) - Republican Party (Trump)
2020 Presidential Elections Results (%) - Other
Ancestries Reported - Arab (%)
Ancestries Reported - Czech (%)
Ancestries Reported - Danish (%)
Ancestries Reported - Dutch (%)
Ancestries Reported - English (%)
Ancestries Reported - French (%)
Ancestries Reported - French Canadian (%)
Ancestries Reported - German (%)
Ancestries Reported - Greek (%)
Ancestries Reported - Hungarian (%)
Ancestries Reported - Irish (%)
Ancestries Reported - Italian (%)
Ancestries Reported - Lithuanian (%)
Ancestries Reported - Norwegian (%)
Ancestries Reported - Polish (%)
Ancestries Reported - Portuguese (%)
Ancestries Reported - Russian (%)
Ancestries Reported - Scotch-Irish (%)
Ancestries Reported - Scottish (%)
Ancestries Reported - Slovak (%)
Ancestries Reported - Subsaharan African (%)
Ancestries Reported - Swedish (%)
Ancestries Reported - Swiss (%)
Ancestries Reported - Ukrainian (%)
Ancestries Reported - United States (%)
Ancestries Reported - Welsh (%)
Ancestries Reported - West Indian (%)
Ancestries Reported - Other (%)
Educational Attainment - No schooling completed (%)
Educational Attainment - Less than high school (%)
Educational Attainment - High school or equivalent (%)
Educational Attainment - Less than 1 year of college (%)
Educational Attainment - 1 or more years of college (%)
Educational Attainment - Associate degree (%)
Educational Attainment - Bachelor's degree (%)
Educational Attainment - Master's degree (%)
Educational Attainment - Professional school degree (%)
Educational Attainment - Doctorate degree (%)
School Enrollment - Nursery, preschool (%)
School Enrollment - Kindergarten (%)
School Enrollment - Grade 1 to 4 (%)
School Enrollment - Grade 5 to 8 (%)
School Enrollment - Grade 9 to 12 (%)
School Enrollment - College undergrad (%)
School Enrollment - Graduate or professional (%)
School Enrollment - Not enrolled in school (%)
School enrollment - Public schools (%)
School enrollment - Private schools (%)
School enrollment - Not enrolled (%)
Median number of rooms in houses and condos
Median number of rooms in apartments
Housing units lacking complete plumbing facilities (%)
Housing units lacking complete kitchen facilities (%)
Density of houses
Urban houses (%)
Rural houses (%)
Households with people 60 years and over (%)
Households with people 65 years and over (%)
Households with people 75 years and over (%)
Households with one or more nonrelatives (%)
Households with no nonrelatives (%)
Population in households (%)
Family households (%)
Nonfamily households (%)
Population in families (%)
Family households with own children (%)
Median number of bedrooms in owner occupied houses
Mean number of bedrooms in owner occupied houses
Median number of bedrooms in renter occupied houses
Mean number of bedrooms in renter occupied houses
Median number of vehichles in owner occupied houses
Mean number of vehichles in owner occupied houses
Median number of vehichles in renter occupied houses
Mean number of vehichles in renter occupied houses
Mortgage status - with mortgage (%)
Mortgage status - with second mortgage (%)
Mortgage status - with home equity loan (%)
Mortgage status - with both second mortgage and home equity loan (%)
Mortgage status - without a mortgage (%)
Average family size
Average family size - White
Average family size - Black or African American
Average family size - Asian
Average family size - Hispanic or Latino
Average family size - American Indian and Alaska Native
Average family size - Multirace
Average family size - Other Race
Geographical mobility - Same house 1 year ago (%)
Geographical mobility - Moved within same county (%)
Geographical mobility - Moved from different county within same state (%)
Geographical mobility - Moved from different state (%)
Geographical mobility - Moved from abroad (%)
Place of birth - Born in state of residence (%)
Place of birth - Born in other state (%)
Place of birth - Native, outside of US (%)
Place of birth - Foreign born (%)
Housing units in structures - 1, detached (%)
Housing units in structures - 1, attached (%)
Housing units in structures - 2 (%)
Housing units in structures - 3 or 4 (%)
Housing units in structures - 5 to 9 (%)
Housing units in structures - 10 to 19 (%)
Housing units in structures - 20 to 49 (%)
Housing units in structures - 50 or more (%)
Housing units in structures - Mobile home (%)
Housing units in structures - Boat, RV, van, etc. (%)
House/condo owner moved in on average (years ago)
Renter moved in on average (years ago)
Year householder moved into unit - Moved in 1999 to March 2000 (%)
Year householder moved into unit - Moved in 1995 to 1998 (%)
Year householder moved into unit - Moved in 1990 to 1994 (%)
Year householder moved into unit - Moved in 1980 to 1989 (%)
Year householder moved into unit - Moved in 1970 to 1979 (%)
Year householder moved into unit - Moved in 1969 or earlier (%)
Means of transportation to work - Drove car alone (%)
Means of transportation to work - Carpooled (%)
Means of transportation to work - Public transportation (%)
Means of transportation to work - Bus or trolley bus (%)
Means of transportation to work - Streetcar or trolley car (%)
Means of transportation to work - Subway or elevated (%)
Means of transportation to work - Railroad (%)
Means of transportation to work - Ferryboat (%)
Means of transportation to work - Taxicab (%)
Means of transportation to work - Motorcycle (%)
Means of transportation to work - Bicycle (%)
Means of transportation to work - Walked (%)
Means of transportation to work - Other means (%)
Working at home (%)
Industry diversity
Most Common Industries - Agriculture, forestry, fishing and hunting, and mining (%)
Most Common Industries - Agriculture, forestry, fishing and hunting (%)
Most Common Industries - Mining, quarrying, and oil and gas extraction (%)
Most Common Industries - Construction (%)
Most Common Industries - Manufacturing (%)
Most Common Industries - Wholesale trade (%)
Most Common Industries - Retail trade (%)
Most Common Industries - Transportation and warehousing, and utilities (%)
Most Common Industries - Transportation and warehousing (%)
Most Common Industries - Utilities (%)
Most Common Industries - Information (%)
Most Common Industries - Finance and insurance, and real estate and rental and leasing (%)
Most Common Industries - Finance and insurance (%)
Most Common Industries - Real estate and rental and leasing (%)
Most Common Industries - Professional, scientific, and management, and administrative and waste management services (%)
Most Common Industries - Professional, scientific, and technical services (%)
Most Common Industries - Management of companies and enterprises (%)
Most Common Industries - Administrative and support and waste management services (%)
Most Common Industries - Educational services, and health care and social assistance (%)
Most Common Industries - Educational services (%)
Most Common Industries - Health care and social assistance (%)
Most Common Industries - Arts, entertainment, and recreation, and accommodation and food services (%)
Most Common Industries - Arts, entertainment, and recreation (%)
Most Common Industries - Accommodation and food services (%)
Most Common Industries - Other services, except public administration (%)
Most Common Industries - Public administration (%)
Occupation diversity
Most Common Occupations - Management, business, science, and arts occupations (%)
Most Common Occupations - Management, business, and financial occupations (%)
Most Common Occupations - Management occupations (%)
Most Common Occupations - Business and financial operations occupations (%)
Most Common Occupations - Computer, engineering, and science occupations (%)
Most Common Occupations - Computer and mathematical occupations (%)
Most Common Occupations - Architecture and engineering occupations (%)
Most Common Occupations - Life, physical, and social science occupations (%)
Most Common Occupations - Education, legal, community service, arts, and media occupations (%)
Most Common Occupations - Community and social service occupations (%)
Most Common Occupations - Legal occupations (%)
Most Common Occupations - Education, training, and library occupations (%)
Most Common Occupations - Arts, design, entertainment, sports, and media occupations (%)
Most Common Occupations - Healthcare practitioners and technical occupations (%)
Most Common Occupations - Health diagnosing and treating practitioners and other technical occupations (%)
Most Common Occupations - Health technologists and technicians (%)
Most Common Occupations - Service occupations (%)
Most Common Occupations - Healthcare support occupations (%)
Most Common Occupations - Protective service occupations (%)
Most Common Occupations - Fire fighting and prevention, and other protective service workers including supervisors (%)
Most Common Occupations - Law enforcement workers including supervisors (%)
Most Common Occupations - Food preparation and serving related occupations (%)
Most Common Occupations - Building and grounds cleaning and maintenance occupations (%)
Most Common Occupations - Personal care and service occupations (%)
Most Common Occupations - Sales and office occupations (%)
Most Common Occupations - Sales and related occupations (%)
Most Common Occupations - Office and administrative support occupations (%)
Most Common Occupations - Natural resources, construction, and maintenance occupations (%)
Most Common Occupations - Farming, fishing, and forestry occupations (%)
Most Common Occupations - Construction and extraction occupations (%)
Most Common Occupations - Installation, maintenance, and repair occupations (%)
Most Common Occupations - Production, transportation, and material moving occupations (%)
Most Common Occupations - Production occupations (%)
Most Common Occupations - Transportation occupations (%)
Most Common Occupations - Material moving occupations (%)
People in Group quarters - Institutionalized population (%)
People in Group quarters - Correctional institutions (%)
People in Group quarters - Federal prisons and detention centers (%)
People in Group quarters - Halfway houses (%)
People in Group quarters - Local jails and other confinement facilities (including police lockups) (%)
People in Group quarters - Military disciplinary barracks (%)
People in Group quarters - State prisons (%)
People in Group quarters - Other types of correctional institutions (%)
People in Group quarters - Nursing homes (%)
People in Group quarters - Hospitals/wards, hospices, and schools for the handicapped (%)
People in Group quarters - Hospitals/wards and hospices for chronically ill (%)
People in Group quarters - Hospices or homes for chronically ill (%)
People in Group quarters - Military hospitals or wards for chronically ill (%)
People in Group quarters - Other hospitals or wards for chronically ill (%)
People in Group quarters - Hospitals or wards for drug/alcohol abuse (%)
People in Group quarters - Mental (Psychiatric) hospitals or wards (%)
People in Group quarters - Schools, hospitals, or wards for the mentally retarded (%)
People in Group quarters - Schools, hospitals, or wards for the physically handicapped (%)
People in Group quarters - Institutions for the deaf (%)
People in Group quarters - Institutions for the blind (%)
People in Group quarters - Orthopedic wards and institutions for the physically handicapped (%)
People in Group quarters - Wards in general hospitals for patients who have no usual home elsewhere (%)
People in Group quarters - Wards in military hospitals for patients who have no usual home elsewhere (%)
People in Group quarters - Juvenile institutions (%)
People in Group quarters - Long-term care (%)
People in Group quarters - Homes for abused, dependent, and neglected children (%)
People in Group quarters - Residential treatment centers for emotionally disturbed children (%)
People in Group quarters - Training schools for juvenile delinquents (%)
People in Group quarters - Short-term care, detention or diagnostic centers for delinquent children (%)
People in Group quarters - Type of juvenile institution unknown (%)
People in Group quarters - Noninstitutionalized population (%)
People in Group quarters - College dormitories (includes college quarters off campus) (%)
People in Group quarters - Military quarters (%)
People in Group quarters - On base (%)
People in Group quarters - Barracks, unaccompanied personnel housing (UPH), (Enlisted/Officer), ;and similar group living quarters for military personnel (%)
People in Group quarters - Transient quarters for temporary residents (%)
People in Group quarters - Military ships (%)
People in Group quarters - Group homes (%)
People in Group quarters - Homes or halfway houses for drug/alcohol abuse (%)
People in Group quarters - Homes for the mentally ill (%)
People in Group quarters - Homes for the mentally retarded (%)
People in Group quarters - Homes for the physically handicapped (%)
People in Group quarters - Other group homes (%)
People in Group quarters - Religious group quarters (%)
People in Group quarters - Dormitories (%)
People in Group quarters - Agriculture workers' dormitories on farms (%)
People in Group quarters - Job Corps and vocational training facilities (%)
People in Group quarters - Other workers' dormitories (%)
People in Group quarters - Crews of maritime vessels (%)
People in Group quarters - Other nonhousehold living situations (%)
People in Group quarters - Other noninstitutional group quarters (%)
Residents speaking English at home (%)
Residents speaking English at home - Born in the United States (%)
Residents speaking English at home - Native, born elsewhere (%)
Residents speaking English at home - Foreign born (%)
Residents speaking Spanish at home (%)
Residents speaking Spanish at home - Born in the United States (%)
Residents speaking Spanish at home - Native, born elsewhere (%)
Residents speaking Spanish at home - Foreign born (%)
Residents speaking other language at home (%)
Residents speaking other language at home - Born in the United States (%)
Residents speaking other language at home - Native, born elsewhere (%)
Residents speaking other language at home - Foreign born (%)
Class of Workers - Employee of private company (%)
Class of Workers - Self-employed in own incorporated business (%)
Class of Workers - Private not-for-profit wage and salary workers (%)
Class of Workers - Local government workers (%)
Class of Workers - State government workers (%)
Class of Workers - Federal government workers (%)
Class of Workers - Self-employed workers in own not incorporated business and Unpaid family workers (%)
House heating fuel used in houses and condos - Utility gas (%)
House heating fuel used in houses and condos - Bottled, tank, or LP gas (%)
House heating fuel used in houses and condos - Electricity (%)
House heating fuel used in houses and condos - Fuel oil, kerosene, etc. (%)
House heating fuel used in houses and condos - Coal or coke (%)
House heating fuel used in houses and condos - Wood (%)
House heating fuel used in houses and condos - Solar energy (%)
House heating fuel used in houses and condos - Other fuel (%)
House heating fuel used in houses and condos - No fuel used (%)
House heating fuel used in apartments - Utility gas (%)
House heating fuel used in apartments - Bottled, tank, or LP gas (%)
House heating fuel used in apartments - Electricity (%)
House heating fuel used in apartments - Fuel oil, kerosene, etc. (%)
House heating fuel used in apartments - Coal or coke (%)
House heating fuel used in apartments - Wood (%)
House heating fuel used in apartments - Solar energy (%)
House heating fuel used in apartments - Other fuel (%)
House heating fuel used in apartments - No fuel used (%)
Armed forces status - In Armed Forces (%)
Armed forces status - Civilian (%)
Armed forces status - Civilian - Veteran (%)
Armed forces status - Civilian - Nonveteran (%)
Fatal accidents locations in years 2005-2021
Fatal accidents locations in 2005
Fatal accidents locations in 2006
Fatal accidents locations in 2007
Fatal accidents locations in 2008
Fatal accidents locations in 2009
Fatal accidents locations in 2010
Fatal accidents locations in 2011
Fatal accidents locations in 2012
Fatal accidents locations in 2013
Fatal accidents locations in 2014
Fatal accidents locations in 2015
Fatal accidents locations in 2016
Fatal accidents locations in 2017
Fatal accidents locations in 2018
Fatal accidents locations in 2019
Fatal accidents locations in 2020
Fatal accidents locations in 2021
Alcohol use - People drinking some alcohol every month (%)
Alcohol use - People not drinking at all (%)
Alcohol use - Average days/month drinking alcohol
Alcohol use - Average drinks/week
Alcohol use - Average days/year people drink much
Audiometry - Average condition of hearing (%)
Audiometry - People that can hear a whisper from across a quiet room (%)
Audiometry - People that can hear normal voice from across a quiet room (%)
Audiometry - Ears ringing, roaring, buzzing (%)
Audiometry - Had a job exposure to loud noise (%)
Audiometry - Had off-work exposure to loud noise (%)
Blood Pressure & Cholesterol - Has high blood pressure (%)
Blood Pressure & Cholesterol - Checking blood pressure at home (%)
Blood Pressure & Cholesterol - Frequently checking blood cholesterol (%)
Blood Pressure & Cholesterol - Has high cholesterol level (%)
Consumer Behavior - Money monthly spent on food at supermarket/grocery store
Consumer Behavior - Money monthly spent on food at other stores
Consumer Behavior - Money monthly spent on eating out
Consumer Behavior - Money monthly spent on carryout/delivered foods
Consumer Behavior - Income spent on food at supermarket/grocery store (%)
Consumer Behavior - Income spent on food at other stores (%)
Consumer Behavior - Income spent on eating out (%)
Consumer Behavior - Income spent on carryout/delivered foods (%)
Current Health Status - General health condition (%)
Current Health Status - Blood donors (%)
Current Health Status - Has blood ever tested for HIV virus (%)
Current Health Status - Left-handed people (%)
Dermatology - People using sunscreen (%)
Diabetes - Diabetics (%)
Diabetes - Had a blood test for high blood sugar (%)
Diabetes - People taking insulin (%)
Diet Behavior & Nutrition - Diet health (%)
Diet Behavior & Nutrition - Milk product consumption (# of products/month)
Diet Behavior & Nutrition - Meals not home prepared (#/week)
Diet Behavior & Nutrition - Meals from fast food or pizza place (#/week)
Diet Behavior & Nutrition - Ready-to-eat foods (#/month)
Diet Behavior & Nutrition - Frozen meals/pizza (#/month)
Drug Use - People that ever used marijuana or hashish (%)
Drug Use - Ever used hard drugs (%)
Drug Use - Ever used any form of cocaine (%)
Drug Use - Ever used heroin (%)
Drug Use - Ever used methamphetamine (%)
Health Insurance - People covered by health insurance (%)
Kidney Conditions-Urology - Avg. # of times urinating at night
Medical Conditions - People with asthma (%)
Medical Conditions - People with anemia (%)
Medical Conditions - People with psoriasis (%)
Medical Conditions - People with overweight (%)
Medical Conditions - Elderly people having difficulties in thinking or remembering (%)
Medical Conditions - People who ever received blood transfusion (%)
Medical Conditions - People having trouble seeing even with glass/contacts (%)
Medical Conditions - People with arthritis (%)
Medical Conditions - People with gout (%)
Medical Conditions - People with congestive heart failure (%)
Medical Conditions - People with coronary heart disease (%)
Medical Conditions - People with angina pectoris (%)
Medical Conditions - People who ever had heart attack (%)
Medical Conditions - People who ever had stroke (%)
Medical Conditions - People with emphysema (%)
Medical Conditions - People with thyroid problem (%)
Medical Conditions - People with chronic bronchitis (%)
Medical Conditions - People with any liver condition (%)
Medical Conditions - People who ever had cancer or malignancy (%)
Mental Health - People who have little interest in doing things (%)
Mental Health - People feeling down, depressed, or hopeless (%)
Mental Health - People who have trouble sleeping or sleeping too much (%)
Mental Health - People feeling tired or having little energy (%)
Mental Health - People with poor appetite or overeating (%)
Mental Health - People feeling bad about themself (%)
Mental Health - People who have trouble concentrating on things (%)
Mental Health - People moving or speaking slowly or too fast (%)
Mental Health - People having thoughts they would be better off dead (%)
Oral Health - Average years since last visit a dentist
Oral Health - People embarrassed because of mouth (%)
Oral Health - People with gum disease (%)
Oral Health - General health of teeth and gums (%)
Oral Health - Average days a week using dental floss/device
Oral Health - Average days a week using mouthwash for dental problem
Oral Health - Average number of teeth
Pesticide Use - Households using pesticides to control insects (%)
Pesticide Use - Households using pesticides to kill weeds (%)
Physical Activity - People doing vigorous-intensity work activities (%)
Physical Activity - People doing moderate-intensity work activities (%)
Physical Activity - People walking or bicycling (%)
Physical Activity - People doing vigorous-intensity recreational activities (%)
Physical Activity - People doing moderate-intensity recreational activities (%)
Physical Activity - Average hours a day doing sedentary activities
Physical Activity - Average hours a day watching TV or videos
Physical Activity - Average hours a day using computer
Physical Functioning - People having limitations keeping them from working (%)
Physical Functioning - People limited in amount of work they can do (%)
Physical Functioning - People that need special equipment to walk (%)
Physical Functioning - People experiencing confusion/memory problems (%)
Physical Functioning - People requiring special healthcare equipment (%)
Prescription Medications - Average number of prescription medicines taking
Preventive Aspirin Use - Adults 40+ taking low-dose aspirin (%)
Reproductive Health - Vaginal deliveries (%)
Reproductive Health - Cesarean deliveries (%)
Reproductive Health - Deliveries resulted in a live birth (%)
Reproductive Health - Pregnancies resulted in a delivery (%)
Reproductive Health - Women breastfeeding newborns (%)
Reproductive Health - Women that had a hysterectomy (%)
Reproductive Health - Women that had both ovaries removed (%)
Reproductive Health - Women that have ever taken birth control pills (%)
Reproductive Health - Women taking birth control pills (%)
Reproductive Health - Women that have ever used Depo-Provera or injectables (%)
Reproductive Health - Women that have ever used female hormones (%)
Sexual Behavior - People 18+ that ever had sex (vaginal, anal, or oral) (%)
Sexual Behavior - Males 18+ that ever had vaginal sex with a woman (%)
Sexual Behavior - Males 18+ that ever performed oral sex on a woman (%)
Sexual Behavior - Males 18+ that ever had anal sex with a woman (%)
Sexual Behavior - Males 18+ that ever had any sex with a man (%)
Sexual Behavior - Females 18+ that ever had vaginal sex with a man (%)
Sexual Behavior - Females 18+ that ever performed oral sex on a man (%)
Sexual Behavior - Females 18+ that ever had anal sex with a man (%)
Sexual Behavior - Females 18+ that ever had any kind of sex with a woman (%)
Sexual Behavior - Average age people first had sex
Sexual Behavior - Average number of female sex partners in lifetime (males 18+)
Sexual Behavior - Average number of female vaginal sex partners in lifetime (males 18+)
Sexual Behavior - Average age people first performed oral sex on a woman (18+)
Sexual Behavior - Average number of woman performed oral sex on in lifetime (18+)
Sexual Behavior - Average number of male sex partners in lifetime (males 18+)
Sexual Behavior - Average number of male anal sex partners in lifetime (males 18+)
Sexual Behavior - Average age people first performed oral sex on a man (18+)
Sexual Behavior - Average number of male oral sex partners in lifetime (18+)
Sexual Behavior - People using protection when performing oral sex (%)
Sexual Behavior - Average number of times people have vaginal or anal sex a year
Sexual Behavior - People having sex without condom (%)
Sexual Behavior - Average number of male sex partners in lifetime (females 18+)
Sexual Behavior - Average number of male vaginal sex partners in lifetime (females 18+)
Sexual Behavior - Average number of female sex partners in lifetime (females 18+)
Sexual Behavior - Circumcised males 18+ (%)
Sleep Disorders - Average hours sleeping at night
Sleep Disorders - People that has trouble sleeping (%)
Smoking-Cigarette Use - People smoking cigarettes (%)
Taste & Smell - People 40+ having problems with smell (%)
Taste & Smell - People 40+ having problems with taste (%)
Taste & Smell - People 40+ that ever had wisdom teeth removed (%)
Taste & Smell - People 40+ that ever had tonsils teeth removed (%)
Taste & Smell - People 40+ that ever had a loss of consciousness because of a head injury (%)
Taste & Smell - People 40+ that ever had a broken nose or other serious injury to face or skull (%)
Taste & Smell - People 40+ that ever had two or more sinus infections (%)
Weight - Average height (inches)
Weight - Average weight (pounds)
Weight - Average BMI
Weight - People that are obese (%)
Weight - People that ever were obese (%)
Weight - People trying to lose weight (%)
100%
urban population.
Estimated median house/condo value in 2022: $907,650
10804:
$907,650New York:
$400,400
According to our research of New York and other state lists, there was 1 registered sex offender living in 10804 zip code as of April 27, 2024 . The ratio of all residents to sex offenders in zip code 10804 is 14,843 to 1.The ratio of registered sex offenders to all residents in this zip code is much lower than the state average.
Median resident age: This zip code:
45.5 yearsNew York median age:
40.0 years
Average household size: This zip code:
2.8 peopleNew York:
2.5 people
Averages for the 2020 tax year for zip code 10804, filed in 2021:
Average Adjusted Gross Income (AGI) in 2020: $257,190 (Individual Income Tax Returns) Here:
$257,190State:
$90,930
Salary/wage: $199,843 (reported on 75.0% of returns )Here:
$199,843State:
$72,104
(% of AGI for various income ranges: 1109.5% for AGIs below $25k , 3890.0% for AGIs $25k-50k , 7100.6% for AGIs $50k-75k , 10667.9% for AGIs $75k-100k , 19710.2% for AGIs $100k-200k , 135602.5% for AGIs over 200k ) Taxable interest for individuals: $5,097 (reported on 64.0% of returns )This zip code:
$5,097New York:
$3,075
(% of AGI for various income ranges: 52.0% for AGIs below $25k , 103.4% for AGIs $25k-50k , 171.7% for AGIs $50k-75k , 266.7% for AGIs $75k-100k , 437.8% for AGIs $100k-200k , 2883.0% for AGIs over 200k ) Ordinary dividends: $15,521 (reported on 58.8% of returns )Here:
$15,521State:
$11,095
(% of AGI for various income ranges: 184.6% for AGIs below $25k , 358.7% for AGIs $25k-50k , 477.5% for AGIs $50k-75k , 813.7% for AGIs $75k-100k , 1672.8% for AGIs $100k-200k , 7514.2% for AGIs over 200k ) Net capital gain/loss in AGI: +$55,296 (reported on 54.1% of returns )Here:
+$55,296State:
+$44,925
(% of AGI for various income ranges: 155.5% for AGIs below $25k , 233.2% for AGIs $25k-50k , 458.3% for AGIs $50k-75k , 561.2% for AGIs $75k-100k , 1557.8% for AGIs $100k-200k , 30941.6% for AGIs over 200k ) Profit/loss from business: +$45,519 (reported on 23.5% of returns )Here:
+$45,519State:
+$14,940
(% of AGI for various income ranges: 193.5% for AGIs below $25k , 430.8% for AGIs $25k-50k , 589.7% for AGIs $50k-75k , 560.8% for AGIs $75k-100k , 1780.2% for AGIs $100k-200k , 9103.1% for AGIs over 200k ) Taxable individual retirement arrangement distribution: $38,074 (reported on 14.5% of returns )10804:
$38,074New York:
$19,609
(% of AGI for various income ranges: 61.5% for AGIs below $25k , 238.7% for AGIs $25k-50k , 477.2% for AGIs $50k-75k , 925.4% for AGIs $75k-100k , 1766.7% for AGIs $100k-200k , 3541.1% for AGIs over 200k ) Self-employed (Keogh) retirement plans: $41,624 (reported on 5.3% of returns )10804:
$41,624New York:
$32,497
(% of AGI for various income ranges: 198.3% for AGIs $100k-200k , 2273.1% for AGIs over 200k ) Total itemized deductions: $42,870 (reported on 36.0% of returns )Here:
$42,870State:
$39,326
(% of AGI for various income ranges: 232.6% for AGIs below $25k , 822.1% for AGIs $25k-50k , 1191.7% for AGIs $50k-75k , 1537.9% for AGIs $75k-100k , 3117.2% for AGIs $100k-200k , 12059.5% for AGIs over 200k ) Charity contributions: $14,582 (reported on 32.7% of returns )Here:
$14,582State:
$15,420
(% of AGI for various income ranges: 14.6% for AGIs below $25k , 85.0% for AGIs $25k-50k , 151.1% for AGIs $50k-75k , 239.6% for AGIs $75k-100k , 478.6% for AGIs $100k-200k , 4590.0% for AGIs over 200k ) Taxes paid: $9,624 (reported on 36.0% of returns )(% of AGI for various income ranges: 57.2% for AGIs below $25k , 232.6% for AGIs $25k-50k , 293.3% for AGIs $50k-75k , 479.2% for AGIs $75k-100k , 942.3% for AGIs $100k-200k , 2366.4% for AGIs over 200k ) Earned income credit: $1,482 (reported on 3.1% of returns )(% of AGI for various income ranges: 32.5% for AGIs below $25k , 30.3% for AGIs $25k-50k ) Percentage of individuals using paid preparers for their 2020 taxes: 94.9%(% for various income ranges: 93.0% for AGIs below $25k , 93.8% for AGIs $25k-50k , 95.3% for AGIs $50k-75k , 95.8% for AGIs $75k-100k , 95.3% for AGIs $100k-200k , 95.9% for AGIs over 200k )
Averages for the 2012 tax year for zip code 10804, filed in 2013:
Average Adjusted Gross Income (AGI) in 2012: $226,798 (Individual Income Tax Returns) Here:
$226,798State:
$77,088
Salary/wage: $172,347 (reported on 76.0% of returns )Here:
$172,347State:
$60,593
(% of AGI for various income ranges: 61.5% for AGIs below $25k , 67.9% for AGIs $25k-50k , 63.5% for AGIs $50k-75k , 56.2% for AGIs $75k-100k , 63.2% for AGIs $100k-200k , 56.5% for AGIs over 200k ) Taxable interest for individuals: $6,640 (reported on 68.9% of returns )This zip code:
$6,640New York:
$3,125
(% of AGI for various income ranges: 6.2% for AGIs below $25k , 2.4% for AGIs $25k-50k , 2.3% for AGIs $50k-75k , 2.3% for AGIs $75k-100k , 1.7% for AGIs $100k-200k , 2.0% for AGIs over 200k ) Ordinary dividends: $13,647 (reported on 58.8% of returns )Here:
$13,647State:
$10,299
(% of AGI for various income ranges: 11.4% for AGIs below $25k , 5.4% for AGIs $25k-50k , 5.0% for AGIs $50k-75k , 4.9% for AGIs $75k-100k , 3.6% for AGIs $100k-200k , 3.3% for AGIs over 200k ) Net capital gain/loss in AGI: +$34,332 (reported on 52.2% of returns )Here:
+$34,332State:
+$42,474
(% of AGI for various income ranges: 1.5% for AGIs below $25k , 1.2% for AGIs $25k-50k , 1.3% for AGIs $50k-75k , 1.9% for AGIs $75k-100k , 1.3% for AGIs $100k-200k , 9.7% for AGIs over 200k ) Profit/loss from business: +$43,096 (reported on 23.3% of returns )Here:
+$43,096State:
+$16,168
(% of AGI for various income ranges: 10.4% for AGIs below $25k , 11.3% for AGIs $25k-50k , 5.2% for AGIs $50k-75k , 5.5% for AGIs $75k-100k , 6.7% for AGIs $100k-200k , 3.7% for AGIs over 200k ) Taxable individual retirement arrangement distribution: $39,456 (reported on 18.7% of returns )10804:
$39,456New York:
$17,621
(% of AGI for various income ranges: 3.7% for AGIs below $25k , 4.4% for AGIs $25k-50k , 5.7% for AGIs $50k-75k , 6.6% for AGIs $75k-100k , 5.1% for AGIs $100k-200k , 2.7% for AGIs over 200k ) Self-employment retirement plans: $36,814 (reported on 5.9% of returns )10804:
$36,814New York:
$27,330
(% of AGI for various income ranges: 1.0% for AGIs $75k-100k , 0.8% for AGIs $100k-200k , 1.0% for AGIs over 200k ) Total itemized deductions: $66,188 (21% of AGI, reported on 68.4% of returns )Here:
$66,188State:
$34,985
Here:
20.8% of AGIState:
21.3% of AGI
(% of AGI for various income ranges: 34.1% for AGIs below $25k , 30.5% for AGIs $25k-50k , 25.8% for AGIs $50k-75k , 28.8% for AGIs $75k-100k , 26.8% for AGIs $100k-200k , 17.9% for AGIs over 200k ) Charity contributions: $10,480 (reported on 63.0% of returns )(% of AGI for various income ranges: 1.5% for AGIs below $25k , 2.5% for AGIs $25k-50k , 2.1% for AGIs $50k-75k , 2.9% for AGIs $75k-100k , 2.6% for AGIs $100k-200k , 3.0% for AGIs over 200k ) Taxes paid: $38,791 (reported on 68.3% of returns )10804:
$38,791State:
$18,656
(% of AGI for various income ranges: 15.3% for AGIs below $25k , 13.6% for AGIs $25k-50k , 11.6% for AGIs $50k-75k , 14.3% for AGIs $75k-100k , 14.7% for AGIs $100k-200k , 11.0% for AGIs over 200k ) Earned income credit: $1,563 (reported on 2.7% of returns )(% of AGI for various income ranges: 1.5% for AGIs below $25k , 0.2% for AGIs $25k-50k ) Percentage of individuals using paid preparers for their 2012 taxes: 77.0%(% for various income ranges: 72.3% for AGIs below $25k , 71.1% for AGIs $25k-50k , 73.3% for AGIs $50k-75k , 79.7% for AGIs $75k-100k , 80.0% for AGIs $100k-200k , 81.2% for AGIs over 200k )
Averages for the 2004 tax year for zip code 10804, filed in 2005:
Average Adjusted Gross Income (AGI) in 2004: $164,590 (Individual Income Tax Returns) Here:
$164,590State:
$59,519
Salary/wage: $136,727 (reported on 72.0% of returns )Here:
$136,727State:
$50,673
(% of AGI for various income ranges: 52.5% for AGIs $10k-25k , 64.2% for AGIs $25k-50k , 57.2% for AGIs $50k-75k , 56.5% for AGIs $75k-100k , 59.1% for AGIs over 100k ) Taxable interest for individuals: $5,037 (reported on 80.5% of returns )This zip code:
$5,037New York:
$2,377
(% of AGI for various income ranges: 8.1% for AGIs $10k-25k , 4.3% for AGIs $25k-50k , 3.3% for AGIs $50k-75k , 3.6% for AGIs $75k-100k , 2.1% for AGIs over 100k ) Taxable dividends: $8,444 (reported on 66.4% of returns )(% of AGI for various income ranges: 8.8% for AGIs $10k-25k , 5.3% for AGIs $25k-50k , 4.9% for AGIs $50k-75k , 4.3% for AGIs $75k-100k , 3.1% for AGIs over 100k ) Net capital gain/loss: +$20,164 (reported on 59.2% of returns )Here:
+$20,164State:
+$23,581
(% of AGI for various income ranges: 0.0% for AGIs $10k-25k , 1.3% for AGIs $25k-50k , 0.7% for AGIs $50k-75k , 2.7% for AGIs $75k-100k , 7.9% for AGIs over 100k ) Profit/loss from business: +$46,388 (reported on 21.8% of returns )Here:
+$46,388State:
+$13,809
(% of AGI for various income ranges: 10.8% for AGIs $10k-25k , 7.0% for AGIs $25k-50k , 7.5% for AGIs $50k-75k , 8.4% for AGIs $75k-100k , 5.9% for AGIs over 100k ) IRA payment deduction: $3,951 (reported on 4.3% of returns )10804:
$3,951New York:
$3,115
(% of AGI for various income ranges: 0.3% for AGIs $10k-25k , 0.6% for AGIs $25k-50k , 0.3% for AGIs $50k-75k , 0.3% for AGIs $75k-100k , 0.1% for AGIs over 100k ) Self-employed pension: $27,172 (reported on 7.2% of returns )Here:
$27,172New York:
$19,016
(% of AGI for various income ranges: 0.3% for AGIs $25k-50k , 0.4% for AGIs $50k-75k , 0.9% for AGIs $75k-100k , 1.3% for AGIs over 100k ) Total itemized deductions: $47,687 (19% of AGI, reported on 65.6% of returns )Here:
$47,687State:
$25,864
Here:
19.5% of AGIState:
21.9% of AGI
(% of AGI for various income ranges: 37.5% for AGIs $10k-25k , 27.5% for AGIs $25k-50k , 31.0% for AGIs $50k-75k , 29.8% for AGIs $75k-100k , 17.4% for AGIs over 100k ) Charity contributions deductions: $8,934 (4% of AGI, reported on 62.5% of returns )Here:
3.5% of AGIState:
3.6% of AGI
(% of AGI for various income ranges: 2.7% for AGIs $10k-25k , 2.7% for AGIs $25k-50k , 3.6% for AGIs $50k-75k , 3.6% for AGIs $75k-100k , 3.4% for AGIs over 100k ) Total tax: $43,285 (reported on 82.9% of returns )10804:
$43,285State:
$11,730
(% of AGI for various income ranges: 5.2% for AGIs $10k-25k , 8.0% for AGIs $25k-50k , 9.7% for AGIs $50k-75k , 10.9% for AGIs $75k-100k , 23.1% for AGIs over 100k ) Earned income credit: $1,189 (reported on 2.1% of returns )Percentage of individuals using paid preparers for their 2004 taxes: 77.8%(% for various income ranges: 75.8% for AGIs below $10k , 70.9% for AGIs $10k-25k , 74.5% for AGIs $25k-50k , 78.5% for AGIs $50k-75k , 77.6% for AGIs $75k-100k , 81.0% for AGIs over 100k )
Estimated median household income in 2022: This zip code:
$220,449New York:
$79,557
Nearest zip codes: 10709 ,
10801 ,
10538 ,
10707 ,
10583 ,
10708 .
New Rochelle Zip Code Map
Percentage of family households: This zip code:
50.4%New York:
41.3%
Percentage of households with unmarried partners: This zip code:
2.5%New York:
42.3%
Likely homosexual households (counted as self-reported same-sex unmarried-partner households)
Lesbian couples: 0.5% of all households Gay men: 0.0% of all households
Household received Food Stamps/SNAP in the past 12 months: 27Household did not receive Food Stamps/SNAP in the past 12 months: 5,076
Women who had a birth in the past 12 months: 73 (62 now married , 10 unmarried) Women who did not have a birth in the past 12 months: 2,764 (1,539 now married , 1,199 unmarried)
Housing units in zip code 10804 with a mortgage: 2,815 (565
second mortgage , 461
both second mortgage and home equity loan )
Houses without a mortgage: 62
Median monthly owner costs for units with a mortgage: $3,860
Median monthly owner costs for units without a mortgage: $1,487
Residents with income below the poverty level in 2022:
This zip code:
3.5%Whole state:
14.3%
Residents with income below 50% of the poverty level in 2022:
This zip code:
2.1%Whole state:
6.8%
Median number of rooms in houses and condos: Median number of rooms in apartments: Notable locations in this zip code not listed on our city pages
Click to draw/clear zip code borders Notable locations in zip code 10804: (A) , Cherry Lawn Golf Range (B) , Coopers Corners (C) , Thomas Paine Cottage and Memorial (D) , Thomas Paine National Historic Museum (E) , Rice Hall (F) , Montgomery House (G) , Advancement House (H) , Campaign House (I) . Display/hide their locations on the map
Shopping Center: (1) . Display/hide its location on the map
Churches in zip code 10804 include: (A) , Holy Trinity Greek Orthodox (B) , Christ United Methodist Church (C) , Kingdom Hall of Jehovahs Witnesses (D) . Display/hide their locations on the map
Cemetery: (1) . Display/hide its location on the map
Lakes and reservoirs: (A) , Sheldrake Lake (B) , Reservoir Number Two (C) , Beechmont Lake (D) . Display/hide their locations on the map
Streams, rivers, and creeks: (A) . Display/hide its location on the map
Parks in zip code 10804 include: (1) , Beechmont Oval (2) , Lester Park (3) . Display/hide their locations on the map
Year house built (houses)
18 2020 or later12 2010 to 2019149 2000 to 200953 1990 to 1999202 1980 to 1989234 1970 to 1979490 1960 to 19691,566 1950 to 1959550 1940 to 19491,885 1939 or earlier
Zip code 10804 household income distribution in 2022 128 Less than $10,00063 $10,000 to $14,99917 $15,000 to $19,99918 $20,000 to $24,99951 $25,000 to $29,99929 $30,000 to $34,99949 $35,000 to $39,99929 $40,000 to $44,99960 $45,000 to $49,999207 $50,000 to $59,999138 $60,000 to $74,999440 $75,000 to $99,999206 $100,000 to $124,999328 $125,000 to $149,999663 $150,000 to $199,9992,703 $200,000 or moreEstimate of home value of owner-occupied houses/condos in 2022 in zip code 10804 12 $50,000 to $59,99951 $60,000 to $69,99918 $70,000 to $79,99913 $90,000 to $99,99924 $100,000 to $124,99918 $125,000 to $149,99937 $150,000 to $174,9997 $175,000 to $199,99982 $200,000 to $249,999114 $250,000 to $299,9993 $300,000 to $399,999106 $400,000 to $499,9991,013 $500,000 to $749,9992,308 $750,000 to $999,999857 $1,000,000 to $1,499,999293 $1,500,000 to $1,999,999164 $2,000,000 or moreRent paid by renters in 2022 in zip code 10804 14 Less than $10018 $1,000 to $1,2499 $1,250 to $1,49977 $1,500 to $1,99951 $2,000 to $2,4998 $3,000 to $3,49931 $3,500 or more62 No cash rent
Median gross rent in 2022: $2,006.
Median price asked for vacant for-sale houses and condos in 2022: $3,141,428.
Estimated median house (or condo) value in 2022 for: White Non-Hispanic householders: $940,089Black or African American householders: $803,364Asian householders: $825,571Some other race householders: $598,713Two or more races householders: $1,254,903Hispanic or Latino householders: $918,535Estimated median house or condo value in 2022: $907,650
10804:
$907,650New York:
$400,400
Lower value quartile - upper value quartile: $742,007 - $1,070,663
Mean price in 2022: Detached houses: $1,252,750Here:
$1,252,750State:
$476,719
Townhouses or other attached units: $2,190,482Here:
$2,190,482State:
$699,270
In 5-or-more-unit structures: $450,224Here:
$450,224State:
$912,009
Housing units in structures:
One, detached: 4,401One, attached: 61Two: 193 or 4: 95 to 9: 2310 to 19: 2920 to 49: 29150 or more: 375Boats, RVs, vans, etc.: 16Unemployment : 3.3%
Means of transportation to work in zip code 10804 47.2% 3,379 Drove a car alone4.7% 337 Carpooled0.9% 68 Bus or trolley bus0.8% 57 Streetcar or trolley car14.5% 1,040 Subway or elevated0.2% 16 Railroad1.5% 106 Walked1.3% 90 Other means29.8% 2,137 Worked at homeTravel time to work (commute) in zip code 10804 120 Less than 5 minutes147 5 to 9 minutes456 10 to 14 minutes731 15 to 19 minutes669 20 to 24 minutes283 25 to 29 minutes515 30 to 34 minutes220 35 to 39 minutes124 40 to 44 minutes515 45 to 59 minutes1,045 60 to 89 minutes442 90 or more minutes
Percentage of zip code residents living and working in this county: 58.9%
Household type by relationship:
Households: 14,797
Male householders: 2,829 (307 living alone ), Female householders: 2,362 (517 living alone )3,756 spouses (3,756 opposite-sex spouses ), 140 unmarried partners , (140 opposite-sex unmarried partners ), 5,094 children (4,831 natural , 161 adopted , 100 stepchildren ), 97 grandchildren , 38 brothers or sisters , 102 parents , 0 foster children , 142 other relatives , 100 non-relatives In group quarters: 120 (-1 institutionalized population )
Size of family households: 1,485 2-persons , 852 3-persons , 1,268 4-persons , 500 5-persons , 61 6-persons , 15 7-or-more-persons
Size of nonfamily households: 823 1-person , 101 2-persons , 9 5-persons
3,291 married couples with children. single-parent households (179 men , 284 women ).
81.6% of residents of 10804 zip code speak English at home. of residents speak Spanish at home (78% very well, 22% well, 1% not well ).of residents speak other Indo-European language at home (85% very well, 10% well, 5% not well ).of residents speak Asian or Pacific Island language at home (79% very well, 12% well, 9% not well ).of residents speak other language at home (95% very well, 5% well ).
Foreign born population: 2,129 (14.4%)
(74.9%
of them are naturalized citizens )
This zip code:
14.4%Whole state:
22.7%
10% Haiti 8% Nepal 6% Bhutan 6% Belgium 5% Greece 4% Bolivia 3% France 19% Italian 12% American 5% Eastern European 4% European 3% Jamaican 3% Irish 2% Polish
Year of entry for the foreign-born population
564 2010 or later 346 2000 to 2009 509 1990 to 1999 821 Before 1990
Facilities with environmental interests located in this zip code:
ALBERT LEONARD MS (25 GERADA LN in NEW ROCHELLE, NY)
(National Center for Education Statistics) - STATE ID-661100010013 Organizations: NEW ROCHELLE CITY SD (SCHOOL DISTRICT)
GEORGE M. DAVIS ES ( in NEW ROCHELLE, NY)
(National Center for Education Statistics) - STATE ID-661100010003 Organizations: NEW ROCHELLE CITY SD (SCHOOL DISTRICT)
CON EDISON - P 1909 (18 LESTER PLACE in NEW ROCHELLE, NY)
Large Quantity Generators, more that 1000 kg of hazardous waste/month (Resource Conservation and Recovery Act (tracking hazardous waste)) Organizations: CONSOLIDATED EDISON COMPANY OF NY, INC. (CONTACT/OPERATOR)
GETTY PETROLEUM CORP (67 QUAKER RIDGE in NEW ROCHELLE, NY)
(Resource Conservation and Recovery Act (tracking hazardous waste))
BETHEL SYNAGOGUE CENTER (NORTHFIELD RD AT NORTH AVE in NEW ROCHELLE, NY)
(Resource Conservation and Recovery Act (tracking hazardous waste))
Housing units lacking complete plumbing facilities: 1.1%
Housing units lacking complete kitchen facilities: 1.3%
79.8% Utility gas 15.5% Fuel oil, kerosene, etc. 2.7% Electricity 1.1% No fuel used 0.5% Bottled, tank, or LP gas
Population in 1990: 14,359.
Place of birth for U.S.-born residents:
This state: 9,901Northeast: 1,443Midwest: 269South: 651West: 258
73% of the 10804 zip code residents lived in the same house 5 years ago.
Out of people who lived in different houses, 51% lived in this county.
Out of people who lived in different counties, 50% lived in New York.
94% of the 10804 zip code residents lived in the same house 1 year ago.
Out of people who lived in different houses, 51% moved from this county.
Out of people who lived in different houses, 24% moved from different county within same state.
Out of people who lived in different houses, 23% moved from different state.
Out of people who lived in different houses, 2% moved from abroad.
Private vs. public school enrollment:
Students in private schools in grades 1 to 8 (elementary and middle school): 824
Students in private schools in grades 9 to 12 (high school): 257
Students in private undergraduate colleges: 364
Occupation by median earnings in the past 12 months ($)
252,767 Health technologists and technicians 244,754 Arts, design, entertainment, sports, and media occupations 201,461 Legal occupations 169,522 Management occupations 158,033 Health diagnosing and treating practitioners and other technical occupations 145,388 Installation, maintenance, and repair occupations
Companies with federal contracts located in this zip code:
HUDSON RESEARCH, INC (461 PINEBROOK BLVD in NEW ROCHELLE, NY)
$99,694 with Army for Defense Missile and Space Systems -- Advanced Development (R&D). Signed on 2004-05-12. Completion date: 2004-11-12.
Top industries in this zip code by the number of employees in 2005:
Accommodation and Food Services: Caterers (250-499 employees: 1 establishment, 1-4 employees: 1 establishment)Educational Services: Elementary and Secondary Schools (100-249: 1, 50-99: 1, 20-49: 2, 10-19: 2, 5-9: 1, 1-4: 1)Other Services (except Public Administration): Religious Organizations (50-99: 2, 20-49: 1, 10-19: 5, 5-9: 2)Arts, Entertainment, and Recreation: Golf Courses and Country Clubs (50-99: 1)Health Care and Social Assistance: Residential Mental Retardation Facilities (20-49: 2)Health Care and Social Assistance: Offices of Physicians (except Mental Health Specialists) (5-9: 3, 1-4: 22)Health Care and Social Assistance: Offices of Dentists (10-19: 1, 5-9: 3, 1-4: 9)Accommodation and Food Services: Limited-Service Restaurants (20-49: 1, 10-19: 1, 1-4: 1)Other Services (except Public Administration): Coin-Operated Laundries and Drycleaners (20-49: 1, 1-4: 4)
People in group quarters in 2010:
40 people in group homes intended for adults
21 people in other noninstitutional facilities
9 people in workers' group living quarters and job corps centers
8 people in college/university student housing
People in group quarters in 2000:
25 people in nursing homes
9 people in homes or halfway houses for drug/alcohol abuse
9 people in other noninstitutional group quarters
8 people in homes for the physically handicapped
2 people in other nonhousehold living situations
Fatal accident statistics in 2013:
Fatal accident count: 1Vehicles involved in fatal accidents: 1Fatal accidents caused by drunken drivers: 1Fatalities: 1Persons involved in fatal accidents: 2Pedestrians involved in fatal accidents: 0
Home Mortgage Disclosure Act Aggregated Statistics For Year 2009(Based on 4 full and 4 partial tracts) A) FHA, FSA/RHS & VA B) Conventional C) Refinancings D) Home Improvement Loans F) Non-occupant Loans on G) Loans On Manufactured Number Average Value Number Average Value Number Average Value Number Average Value Number Average Value Number Average Value
LOANS ORIGINATED 33 $576,680 233 $486,567 472 $380,280 12 $308,777 1 $231,560 0 $0 APPLICATIONS APPROVED, NOT ACCEPTED 6 $516,553 54 $502,081 94 $440,581 8 $203,254 4 $271,200 0 $0 APPLICATIONS DENIED 6 $494,675 52 $371,295 234 $471,090 24 $152,390 5 $380,642 1 $4,020 APPLICATIONS WITHDRAWN 6 $596,395 30 $537,463 141 $465,338 9 $232,808 0 $0 0 $0 FILES CLOSED FOR INCOMPLETENESS 0 $0 7 $479,691 50 $352,301 1 $30,110 0 $0 0 $0
Aggregated Statistics For Year 2008(Based on 4 full and 4 partial tracts) A) FHA, FSA/RHS & VA B) Conventional C) Refinancings D) Home Improvement Loans E) Loans on Dwellings For 5+ Families F) Non-occupant Loans on Number Average Value Number Average Value Number Average Value Number Average Value Number Average Value Number Average Value
LOANS ORIGINATED 6 $496,443 280 $486,848 153 $414,198 36 $191,163 2 $7,977,600 10 $482,486 APPLICATIONS APPROVED, NOT ACCEPTED 0 $0 66 $495,532 72 $422,795 14 $70,644 0 $0 1 $353,700 APPLICATIONS DENIED 0 $0 76 $428,786 139 $462,511 35 $286,955 0 $0 2 $122,640 APPLICATIONS WITHDRAWN 2 $435,870 34 $435,660 60 $421,174 9 $418,379 0 $0 7 $391,980 FILES CLOSED FOR INCOMPLETENESS 0 $0 5 $497,788 13 $339,083 2 $305,145 0 $0 0 $0
Aggregated Statistics For Year 2007(Based on 4 full and 4 partial tracts) B) Conventional C) Refinancings D) Home Improvement Loans E) Loans on Dwellings For 5+ Families F) Non-occupant Loans on Number Average Value Number Average Value Number Average Value Number Average Value Number Average Value
LOANS ORIGINATED 408 $497,855 239 $411,823 64 $232,787 1 $1,887,240 16 $474,446 APPLICATIONS APPROVED, NOT ACCEPTED 88 $440,425 98 $380,282 20 $131,230 0 $0 3 $307,567 APPLICATIONS DENIED 105 $524,015 189 $435,414 46 $122,116 0 $0 7 $227,990 APPLICATIONS WITHDRAWN 45 $452,609 91 $391,172 8 $95,519 1 $390,170 4 $379,130 FILES CLOSED FOR INCOMPLETENESS 15 $400,299 34 $494,565 2 $52,165 0 $0 1 $353,700
Aggregated Statistics For Year 2006(Based on 4 full and 4 partial tracts) B) Conventional C) Refinancings D) Home Improvement Loans E) Loans on Dwellings For 5+ Families F) Non-occupant Loans on G) Loans On Manufactured Number Average Value Number Average Value Number Average Value Number Average Value Number Average Value Number Average Value
LOANS ORIGINATED 400 $473,050 352 $382,528 75 $196,979 3 $1,915,517 19 $565,396 0 $0 APPLICATIONS APPROVED, NOT ACCEPTED 37 $523,488 87 $414,452 19 $218,317 0 $0 4 $739,200 1 $184,060 APPLICATIONS DENIED 67 $372,153 181 $478,807 29 $219,153 0 $0 6 $581,523 0 $0 APPLICATIONS WITHDRAWN 51 $435,459 135 $361,450 10 $325,841 0 $0 4 $173,512 0 $0 FILES CLOSED FOR INCOMPLETENESS 32 $349,363 31 $424,354 4 $363,518 0 $0 0 $0 0 $0
Aggregated Statistics For Year 2005(Based on 4 full and 4 partial tracts) B) Conventional C) Refinancings D) Home Improvement Loans E) Loans on Dwellings For 5+ Families F) Non-occupant Loans on Number Average Value Number Average Value Number Average Value Number Average Value Number Average Value
LOANS ORIGINATED 539 $487,572 424 $398,722 71 $211,874 0 $0 36 $431,639 APPLICATIONS APPROVED, NOT ACCEPTED 73 $444,364 99 $335,277 22 $107,416 0 $0 9 $355,150 APPLICATIONS DENIED 81 $485,962 190 $433,988 40 $176,909 0 $0 10 $327,431 APPLICATIONS WITHDRAWN 68 $474,371 257 $438,899 20 $320,002 1 $169,640 8 $343,644 FILES CLOSED FOR INCOMPLETENESS 11 $581,640 43 $491,013 2 $249,600 0 $0 0 $0
Aggregated Statistics For Year 2004(Based on 4 full and 4 partial tracts) B) Conventional C) Refinancings D) Home Improvement Loans E) Loans on Dwellings For 5+ Families F) Non-occupant Loans on G) Loans On Manufactured Number Average Value Number Average Value Number Average Value Number Average Value Number Average Value Number Average Value
LOANS ORIGINATED 545 $447,348 487 $337,138 48 $224,296 4 $3,606,182 39 $363,139 1 $65,310 APPLICATIONS APPROVED, NOT ACCEPTED 97 $499,393 90 $363,027 26 $112,734 0 $0 3 $473,300 0 $0 APPLICATIONS DENIED 61 $435,585 167 $406,931 33 $171,197 0 $0 7 $211,151 1 $100,380 APPLICATIONS WITHDRAWN 70 $523,604 184 $346,540 13 $104,185 1 $401,520 3 $160,203 0 $0 FILES CLOSED FOR INCOMPLETENESS 16 $253,885 54 $377,442 5 $85,118 0 $0 8 $286,595 0 $0
Aggregated Statistics For Year 2003(Based on 4 full and 4 partial tracts) A) FHA, FSA/RHS & VA B) Conventional C) Refinancings D) Home Improvement Loans F) Non-occupant Loans on Number Average Value Number Average Value Number Average Value Number Average Value Number Average Value
LOANS ORIGINATED 0 $0 447 $428,250 1,624 $302,809 42 $108,799 39 $333,581 APPLICATIONS APPROVED, NOT ACCEPTED 0 $0 58 $473,759 329 $279,005 23 $64,558 1 $101,780 APPLICATIONS DENIED 1 $323,160 58 $471,403 331 $708,661 28 $87,878 17 $452,807 APPLICATIONS WITHDRAWN 0 $0 39 $415,797 288 $305,252 10 $94,567 9 $319,531 FILES CLOSED FOR INCOMPLETENESS 0 $0 21 $448,592 90 $359,490 5 $80,882 4 $288,468
Aggregated Statistics For Year 2002(Based on 4 full and 4 partial tracts) B) Conventional C) Refinancings D) Home Improvement Loans E) Loans on Dwellings For 5+ Families F) Non-occupant Loans on Number Average Value Number Average Value Number Average Value Number Average Value Number Average Value
LOANS ORIGINATED 427 $502,363 1,038 $290,647 68 $92,668 2 $7,578,720 12 $145,753 APPLICATIONS APPROVED, NOT ACCEPTED 73 $377,860 279 $297,587 24 $79,034 0 $0 1 $12,720 APPLICATIONS DENIED 42 $422,793 238 $315,774 62 $110,636 0 $0 7 $282,991 APPLICATIONS WITHDRAWN 39 $350,406 244 $304,925 19 $86,304 0 $0 3 $234,790 FILES CLOSED FOR INCOMPLETENESS 15 $373,969 58 $306,836 5 $123,682 0 $0 3 $153,037
Aggregated Statistics For Year 2001(Based on 4 full and 4 partial tracts) B) Conventional C) Refinancings D) Home Improvement Loans F) Non-occupant Loans on Number Average Value Number Average Value Number Average Value Number Average Value
LOANS ORIGINATED 473 $318,731 562 $271,766 77 $82,006 15 $228,377 APPLICATIONS APPROVED, NOT ACCEPTED 72 $304,836 134 $213,762 35 $75,451 2 $310,130 APPLICATIONS DENIED 36 $309,466 211 $285,164 41 $84,111 10 $326,038 APPLICATIONS WITHDRAWN 46 $360,131 195 $266,841 37 $87,619 12 $485,320 FILES CLOSED FOR INCOMPLETENESS 9 $468,307 56 $260,169 10 $72,136 0 $0
Aggregated Statistics For Year 2000(Based on 4 full and 4 partial tracts) A) FHA, FSA/RHS & VA B) Conventional C) Refinancings D) Home Improvement Loans E) Loans on Dwellings For 5+ Families F) Non-occupant Loans on Number Average Value Number Average Value Number Average Value Number Average Value Number Average Value Number Average Value
LOANS ORIGINATED 1 $238,340 474 $298,567 179 $215,128 96 $91,651 5 $3,242,740 12 $325,026 APPLICATIONS APPROVED, NOT ACCEPTED 0 $0 61 $289,673 72 $226,820 29 $63,449 0 $0 4 $126,240 APPLICATIONS DENIED 0 $0 58 $252,446 140 $207,723 43 $65,646 0 $0 2 $320,640 APPLICATIONS WITHDRAWN 0 $0 47 $272,101 127 $172,993 19 $131,843 2 $7,479,000 7 $235,100 FILES CLOSED FOR INCOMPLETENESS 0 $0 9 $264,742 38 $189,989 7 $16,781 0 $0 0 $0
Aggregated Statistics For Year 1999(Based on 2 full and 2 partial tracts) A) FHA, FSA/RHS & VA B) Conventional C) Refinancings D) Home Improvement Loans F) Non-occupant Loans on Number Average Value Number Average Value Number Average Value Number Average Value Number Average Value
LOANS ORIGINATED 1 $193,580 227 $267,731 229 $231,113 36 $62,186 8 $217,712 APPLICATIONS APPROVED, NOT ACCEPTED 0 $0 29 $255,267 65 $202,333 10 $49,698 2 $311,370 APPLICATIONS DENIED 1 $113,690 25 $210,551 74 $189,172 21 $70,196 4 $63,742 APPLICATIONS WITHDRAWN 0 $0 16 $193,862 66 $164,570 12 $144,109 1 $192,940 FILES CLOSED FOR INCOMPLETENESS 0 $0 8 $205,985 30 $224,318 3 $129,197 2 $248,635
Detailed HMDA statistics for the following Tracts:
0066.00
,
0067.00 ,
0068.01 ,
0068.02
Private Mortgage Insurance Companies Aggregated Statistics For Year 2009(Based on 4 full and 4 partial tracts) A) Conventional B) Refinancings Number Average Value Number Average Value
LOANS ORIGINATED 17 $477,901 9 $413,420 APPLICATIONS APPROVED, NOT ACCEPTED 9 $411,913 2 $540,480 APPLICATIONS DENIED 11 $405,827 2 $540,480 APPLICATIONS WITHDRAWN 2 $588,350 4 $540,482 FILES CLOSED FOR INCOMPLETENESS 0 $0 0 $0
Aggregated Statistics For Year 2008(Based on 4 full and 4 partial tracts) A) Conventional B) Refinancings Number Average Value Number Average Value
LOANS ORIGINATED 17 $445,649 6 $481,933 APPLICATIONS APPROVED, NOT ACCEPTED 8 $376,746 6 $412,413 APPLICATIONS DENIED 4 $451,330 4 $413,110 APPLICATIONS WITHDRAWN 2 $185,480 1 $722,740 FILES CLOSED FOR INCOMPLETENESS 0 $0 0 $0
Aggregated Statistics For Year 2007(Based on 4 full and 2 partial tracts) A) Conventional B) Refinancings Number Average Value Number Average Value
LOANS ORIGINATED 11 $407,961 6 $429,852 APPLICATIONS APPROVED, NOT ACCEPTED 9 $398,470 1 $419,860 APPLICATIONS DENIED 1 $353,700 0 $0 APPLICATIONS WITHDRAWN 0 $0 0 $0 FILES CLOSED FOR INCOMPLETENESS 0 $0 0 $0
Aggregated Statistics For Year 2006(Based on 2 full and 4 partial tracts) A) Conventional B) Refinancings Number Average Value Number Average Value
LOANS ORIGINATED 17 $219,936 1 $405,440 APPLICATIONS APPROVED, NOT ACCEPTED 4 $260,692 0 $0 APPLICATIONS DENIED 1 $93,300 0 $0 APPLICATIONS WITHDRAWN 0 $0 0 $0 FILES CLOSED FOR INCOMPLETENESS 0 $0 0 $0
Aggregated Statistics For Year 2005(Based on 2 full and 4 partial tracts) A) Conventional B) Refinancings Number Average Value Number Average Value
LOANS ORIGINATED 11 $210,323 2 $76,785 APPLICATIONS APPROVED, NOT ACCEPTED 9 $544,150 0 $0 APPLICATIONS DENIED 1 $141,650 0 $0 APPLICATIONS WITHDRAWN 0 $0 0 $0 FILES CLOSED FOR INCOMPLETENESS 0 $0 0 $0
Aggregated Statistics For Year 2004(Based on 4 full and 4 partial tracts) A) Conventional B) Refinancings Number Average Value Number Average Value
LOANS ORIGINATED 20 $356,572 2 $190,465 APPLICATIONS APPROVED, NOT ACCEPTED 8 $232,774 1 $406,540 APPLICATIONS DENIED 0 $0 2 $89,750 APPLICATIONS WITHDRAWN 3 $223,113 1 $262,940 FILES CLOSED FOR INCOMPLETENESS 0 $0 0 $0
Aggregated Statistics For Year 2003(Based on 4 full and 4 partial tracts) A) Conventional B) Refinancings Number Average Value Number Average Value
LOANS ORIGINATED 29 $318,859 8 $343,870 APPLICATIONS APPROVED, NOT ACCEPTED 13 $379,000 2 $177,275 APPLICATIONS DENIED 1 $86,520 0 $0 APPLICATIONS WITHDRAWN 0 $0 0 $0 FILES CLOSED FOR INCOMPLETENESS 0 $0 0 $0
Aggregated Statistics For Year 2002(Based on 4 full and 4 partial tracts) A) Conventional B) Refinancings Number Average Value Number Average Value
LOANS ORIGINATED 43 $318,643 4 $276,478 APPLICATIONS APPROVED, NOT ACCEPTED 23 $323,155 5 $207,100 APPLICATIONS DENIED 1 $265,490 0 $0 APPLICATIONS WITHDRAWN 3 $498,870 0 $0 FILES CLOSED FOR INCOMPLETENESS 1 $351,330 0 $0
Aggregated Statistics For Year 2001(Based on 4 full and 4 partial tracts) A) Conventional B) Refinancings Number Average Value Number Average Value
LOANS ORIGINATED 43 $242,648 10 $190,235 APPLICATIONS APPROVED, NOT ACCEPTED 11 $239,334 6 $196,448 APPLICATIONS DENIED 3 $120,727 0 $0 APPLICATIONS WITHDRAWN 0 $0 2 $359,040 FILES CLOSED FOR INCOMPLETENESS 0 $0 1 $230,710
Aggregated Statistics For Year 2000(Based on 4 full and 4 partial tracts) A) Conventional B) Refinancings C) Non-occupant Loans on Number Average Value Number Average Value Number Average Value
LOANS ORIGINATED 61 $190,702 7 $334,024 2 $189,575 APPLICATIONS APPROVED, NOT ACCEPTED 15 $291,516 2 $332,070 2 $189,575 APPLICATIONS DENIED 2 $141,225 0 $0 0 $0 APPLICATIONS WITHDRAWN 2 $210,780 0 $0 0 $0 FILES CLOSED FOR INCOMPLETENESS 1 $209,510 0 $0 0 $0
Aggregated Statistics For Year 1999(Based on 2 full and 2 partial tracts) A) Conventional B) Refinancings Number Average Value Number Average Value
LOANS ORIGINATED 28 $265,058 10 $300,143 APPLICATIONS APPROVED, NOT ACCEPTED 4 $231,330 2 $282,755 APPLICATIONS DENIED 2 $206,465 0 $0 APPLICATIONS WITHDRAWN 0 $0 1 $412,890 FILES CLOSED FOR INCOMPLETENESS 0 $0 0 $0
Detailed PMIC statistics for the following Tracts:
0066.00
,
0067.00 ,
0068.01 ,
0068.02
2006 - 2018 National Fire Incident Reporting System (NFIRS) incidents See full 2006 National Fire Incident Reporting System statistics for zip code 10804, New York
Most common first names in zip code 10804 among deceased individuals Name Count Lived (average)
William 72 75.8 years Joseph 66 75.7 years John 63 76.1 years Mary 57 82.5 years Charles 47 76.6 years George 46 78.9 years Anna 45 82.8 years Rose 42 81.9 years Helen 42 78.1 years Louis 41 80.9 years
Most common last names in zip code 10804 among deceased individuals Last name Count Lived (average)
Schwartz 22 74.1 years Miller 19 82.0 years Levine 17 80.9 years Weiss 15 79.6 years Cohen 14 81.1 years Greenberg 12 71.2 years Kaplan 11 78.8 years Berger 11 80.9 years Gordon 11 77.7 years Stern 11 76.3 years
Businesses in zip code 10804
Name Count Name Count
A&P 1 Harmon Face Values 1 CVS 1 Jones New York 1 Curves 1 Nike 1 FedEx 2 Starbucks 1 H&R Block 1 UPS 1

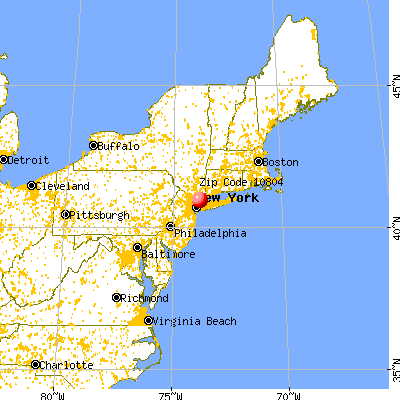


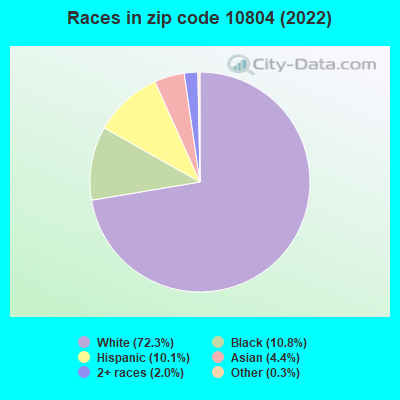


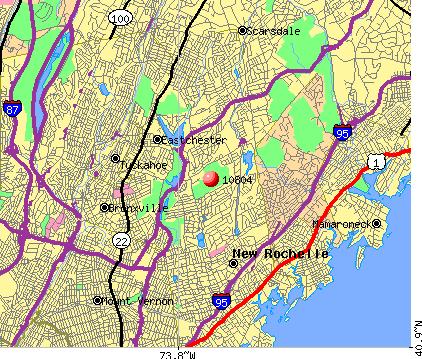 Nearest zip codes: 10709, 10801, 10538, 10707, 10583, 10708.
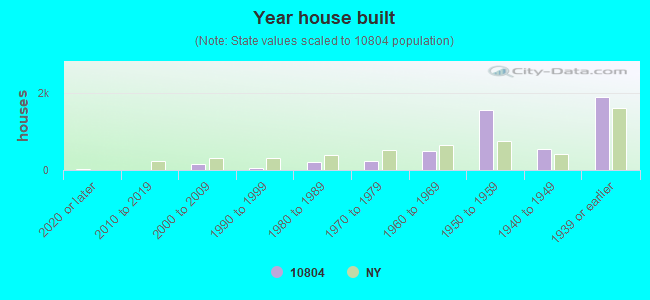


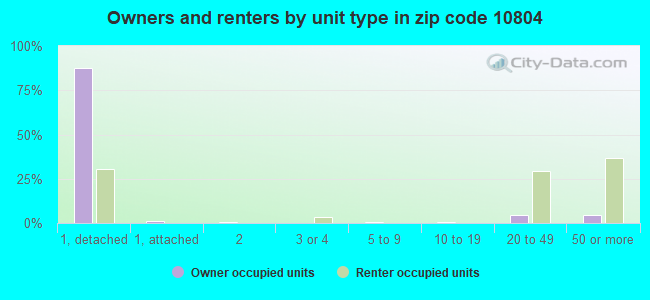
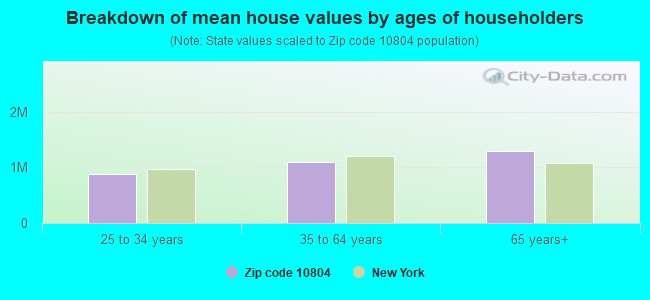


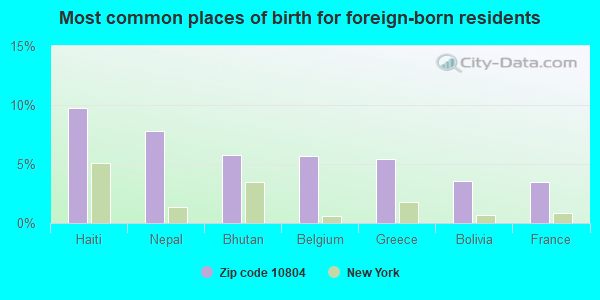

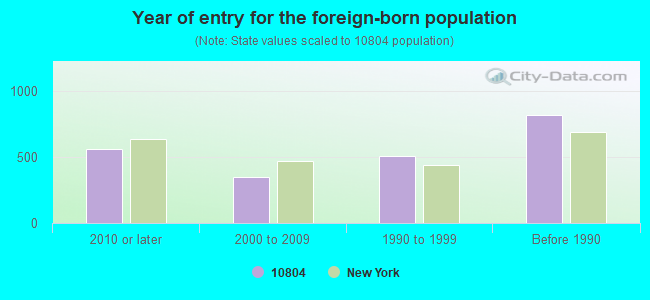

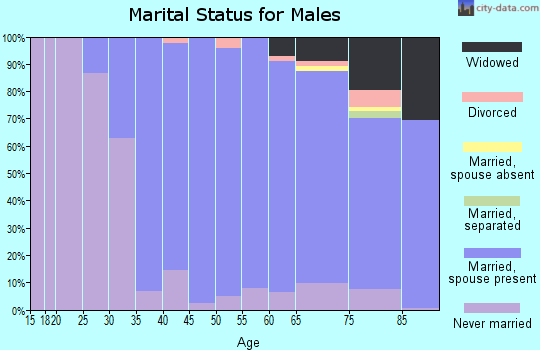
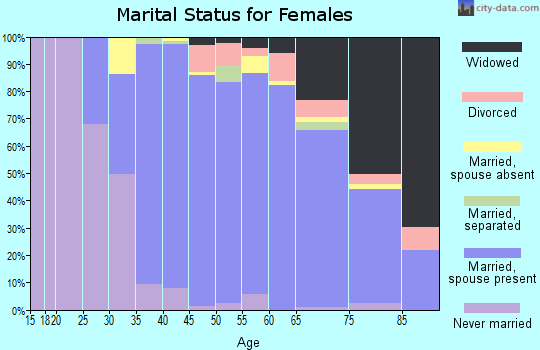
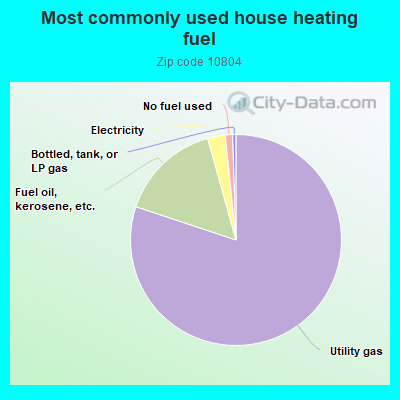
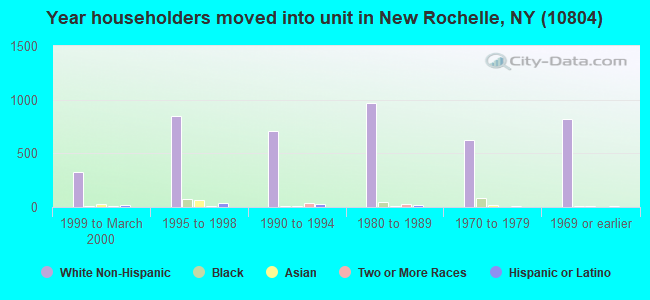
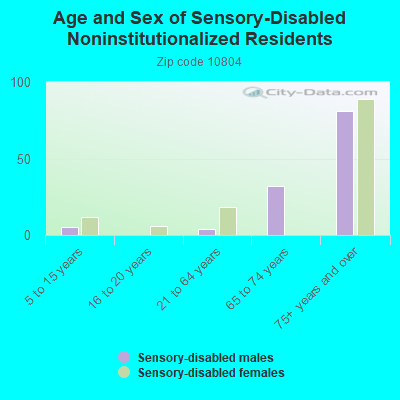
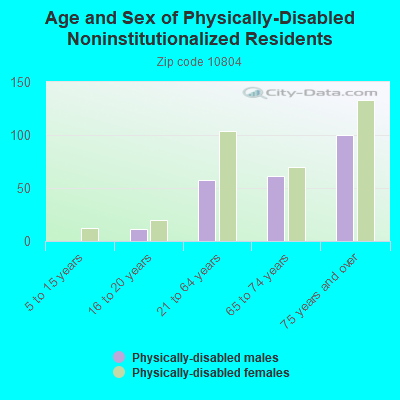
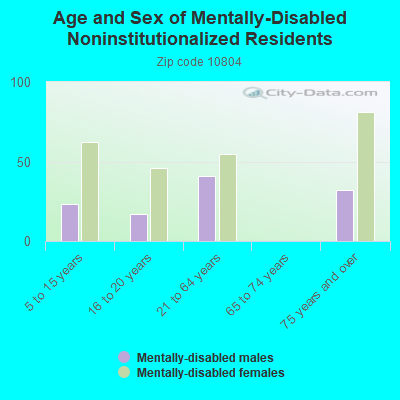
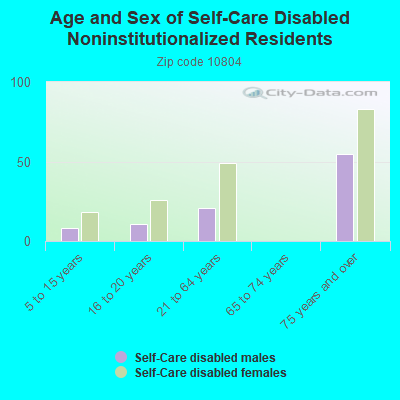
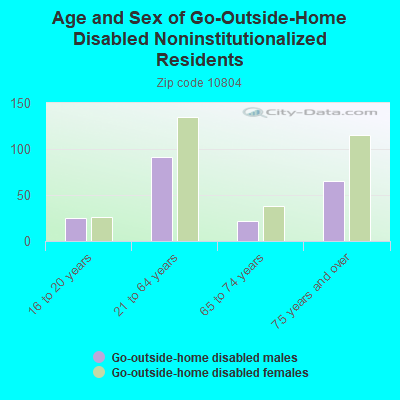
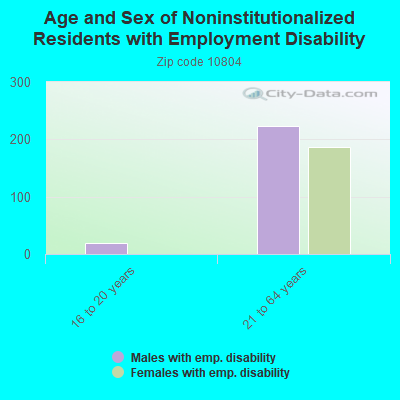
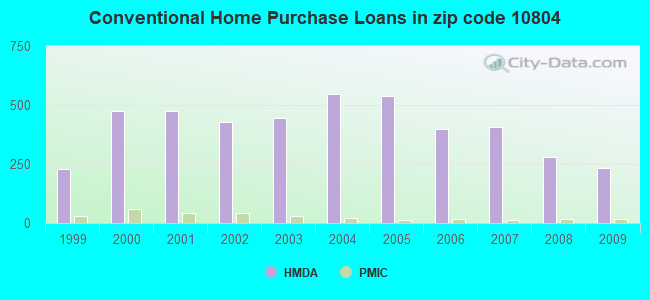
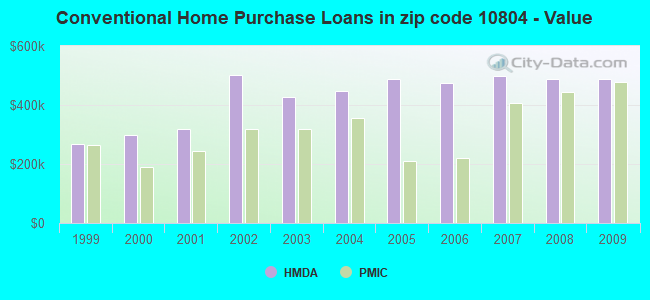
 According to the data from the years 2006 - 2018 the average number of fires per year is 98. The highest number of reported fire incidents - 215 took place in 2017, and the least - 0 in 2011. The data has a growing trend.
 When looking into fire subcategories, the most incidents belonged to: Structure Fires (87.4%), and Outside Fires (7.5%).