Estimated zip code population in 2022: 40,454 Zip code population in 2010: 38,982 Zip code population in 2000: 39,091
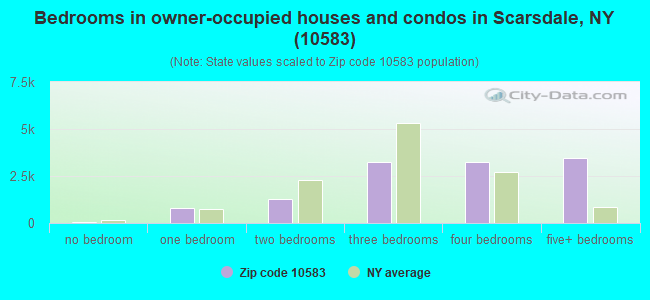
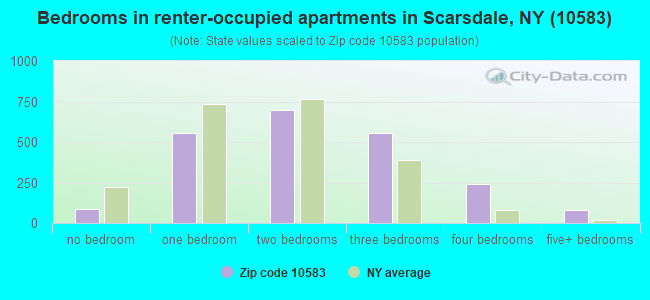
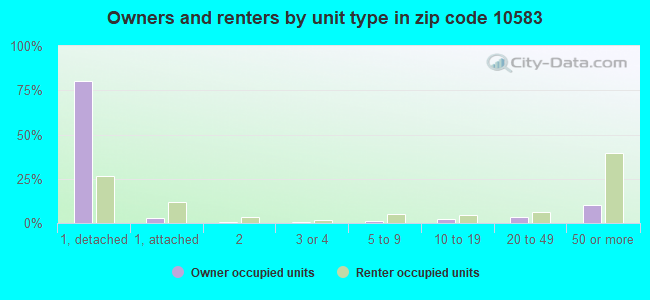
Houses and condos: 15,308 Renter-occupied apartments: 2,241
% of renters here:
16%
State:
46%
March 2022 cost of living index in zip code 10583: 149.8 (very high, U.S. average is 100)
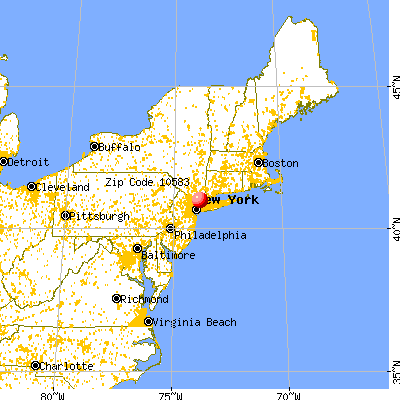
Land area: 12.4 sq. mi. Water area: 0.0 sq. mi.
Population density: 3,272 people per square mile
(average).
OSM Map
General Map
Google Map
MSN Map
OSM Map
General Map
Google Map
MSN Map
OSM Map
General Map
Google Map
MSN Map
OSM Map
General Map
Google Map
MSN Map
Please wait while loading the map...
Real estate property taxes paid for housing units in 2022:
This zip code:
0.8% ($9,805)
New York:
1.5% ($6,180)
Median real estate property taxes paid for housing units with mortgages in 2022: $9,858 (0.8%) Median real estate property taxes paid for housing units with no mortgage in 2022: $9,755 (1.0%)
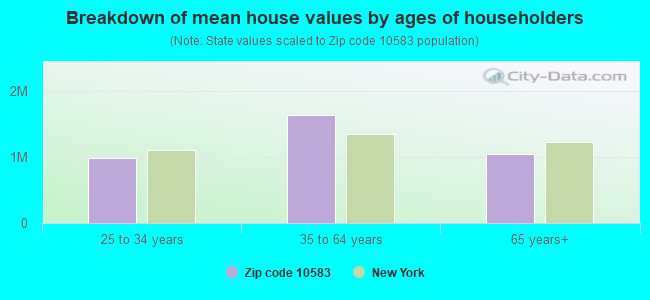
Estimated median house/condo value in 2022: $1,171,491
10583:
$1,171,491
New York:
$400,400
According to our research of New York and other state lists, there were 3 registered sex offenders living in 10583 zip code as of April 27, 2024. The ratio of all residents to sex offenders in zip code 10583 is 13,543 to 1. The ratio of registered sex offenders to all residents in this zip code is much lower than the state average.
Median resident age:
This zip code:
43.9 years
New York median age:
40.0 years
Average household size:
This zip code:
2.8 people
New York:
2.5 people
Averages for the 2020 tax year for zip code 10583, filed in 2021:
Average Adjusted Gross Income (AGI) in 2020: $499,469 (Individual Income Tax Returns)
Here:
$499,469
State:
$90,930
Salary/wage: $315,857 (reported on 75.7% of returns)
Here:
$315,857
State:
$72,104
(% of AGI for various income ranges: 1213.9% for AGIs below $25k, 3793.5% for AGIs $25k-50k, 7247.2% for AGIs $50k-75k, 10643.2% for AGIs $75k-100k, 19827.1% for AGIs $100k-200k, 238510.2% for AGIs over 200k)
Taxable interest for individuals: $20,319 (reported on 67.3% of returns)
This zip code:
$20,319
New York:
$3,075
(% of AGI for various income ranges: 86.6% for AGIs below $25k, 144.7% for AGIs $25k-50k, 185.7% for AGIs $50k-75k, 333.6% for AGIs $75k-100k, 528.6% for AGIs $100k-200k, 14428.9% for AGIs over 200k)
Ordinary dividends: $43,703 (reported on 62.5% of returns)
Here:
$43,703
State:
$11,095
(% of AGI for various income ranges: 278.7% for AGIs below $25k, 458.0% for AGIs $25k-50k, 530.0% for AGIs $50k-75k, 1020.7% for AGIs $75k-100k, 1585.2% for AGIs $100k-200k, 27963.2% for AGIs over 200k)
Net capital gain/loss in AGI: +$141,320 (reported on 58.5% of returns)
Here:
+$141,320
State:
+$44,925
(% of AGI for various income ranges: 180.3% for AGIs below $25k, 324.8% for AGIs $25k-50k, 400.1% for AGIs $50k-75k, 1014.0% for AGIs $75k-100k, 1531.1% for AGIs $100k-200k, 90134.3% for AGIs over 200k)
Profit/loss from business: +$60,612 (reported on 20.4% of returns)
Here:
+$60,612
State:
+$14,940
(% of AGI for various income ranges: 173.6% for AGIs below $25k, 373.7% for AGIs $25k-50k, 305.7% for AGIs $50k-75k, 705.3% for AGIs $75k-100k, 1186.8% for AGIs $100k-200k, 11976.9% for AGIs over 200k)
Taxable individual retirement arrangement distribution: $46,474 (reported on 11.8% of returns)
10583:
$46,474
New York:
$19,609
(% of AGI for various income ranges: 86.5% for AGIs below $25k, 293.5% for AGIs $25k-50k, 330.4% for AGIs $50k-75k, 564.2% for AGIs $75k-100k, 1276.1% for AGIs $100k-200k, 4365.4% for AGIs over 200k)
Self-employed (Keogh) retirement plans: $48,668 (reported on 6.4% of returns)
10583:
$48,668
New York:
$32,497
(% of AGI for various income ranges: 45.3% for AGIs $25k-50k, 64.1% for AGIs $75k-100k, 160.6% for AGIs $100k-200k, 3296.6% for AGIs over 200k)
Total itemized deductions: $72,418 (reported on 35.2% of returns)
Here:
$72,418
State:
$39,326
(% of AGI for various income ranges: 280.7% for AGIs below $25k, 676.9% for AGIs $25k-50k, 751.9% for AGIs $50k-75k, 1268.1% for AGIs $75k-100k, 2483.4% for AGIs $100k-200k, 24801.1% for AGIs over 200k)
Charity contributions: $25,246 (reported on 31.3% of returns)
Here:
$25,246
State:
$15,420
(% of AGI for various income ranges: 12.6% for AGIs below $25k, 54.8% for AGIs $25k-50k, 72.1% for AGIs $50k-75k, 206.2% for AGIs $75k-100k, 367.0% for AGIs $100k-200k, 8349.5% for AGIs over 200k)
Taxes paid: $9,849 (reported on 35.2% of returns)
10583:
$9,849
State:
$9,183
(% of AGI for various income ranges: 71.6% for AGIs below $25k, 176.0% for AGIs $25k-50k, 211.6% for AGIs $50k-75k, 386.0% for AGIs $75k-100k, 740.4% for AGIs $100k-200k, 2791.3% for AGIs over 200k)
Earned income credit: $1,624 (reported on 2.4% of returns)
Here:
$1,624
State:
$2,138
(% of AGI for various income ranges: 31.0% for AGIs below $25k, 28.7% for AGIs $25k-50k)
Percentage of individuals using paid preparers for their 2020 taxes: 94.0%
Here:
94%
State:
95%
(% for various income ranges: 92.7% for AGIs below $25k, 92.3% for AGIs $25k-50k, 93.5% for AGIs $50k-75k, 93.5% for AGIs $75k-100k, 93.4% for AGIs $100k-200k, 95.4% for AGIs over 200k)
Averages for the 2012 tax year for zip code 10583, filed in 2013:
Average Adjusted Gross Income (AGI) in 2012: $392,132 (Individual Income Tax Returns)
Here:
$392,132
State:
$77,088
Salary/wage: $239,345 (reported on 74.5% of returns)
Here:
$239,345
State:
$60,593
(% of AGI for various income ranges: 60.1% for AGIs below $25k, 64.2% for AGIs $25k-50k, 64.6% for AGIs $50k-75k, 59.6% for AGIs $75k-100k, 63.4% for AGIs $100k-200k, 43.3% for AGIs over 200k)
Taxable interest for individuals: $20,924 (reported on 71.2% of returns)
This zip code:
$20,924
New York:
$3,125
(% of AGI for various income ranges: 5.5% for AGIs below $25k, 2.4% for AGIs $25k-50k, 1.9% for AGIs $50k-75k, 2.1% for AGIs $75k-100k, 1.6% for AGIs $100k-200k, 4.0% for AGIs over 200k)
Ordinary dividends: $36,122 (reported on 61.5% of returns)
Here:
$36,122
State:
$10,299
(% of AGI for various income ranges: 14.7% for AGIs below $25k, 6.4% for AGIs $25k-50k, 4.6% for AGIs $50k-75k, 5.0% for AGIs $75k-100k, 4.5% for AGIs $100k-200k, 5.7% for AGIs over 200k)
Net capital gain/loss in AGI: +$123,279 (reported on 55.7% of returns)
Here:
+$123,279
State:
+$42,474
(% of AGI for various income ranges: 2.9% for AGIs below $25k, 2.1% for AGIs $25k-50k, 1.0% for AGIs $50k-75k, 1.8% for AGIs $75k-100k, 2.2% for AGIs $100k-200k, 19.5% for AGIs over 200k)
Profit/loss from business: +$61,805 (reported on 20.1% of returns)
Here:
+$61,805
State:
+$16,168
(% of AGI for various income ranges: 9.1% for AGIs below $25k, 6.1% for AGIs $25k-50k, 4.8% for AGIs $50k-75k, 4.9% for AGIs $75k-100k, 5.9% for AGIs $100k-200k, 2.8% for AGIs over 200k)
Taxable individual retirement arrangement distribution: $44,989 (reported on 16.8% of returns)
10583:
$44,989
New York:
$17,621
(% of AGI for various income ranges: 4.8% for AGIs below $25k, 4.5% for AGIs $25k-50k, 4.3% for AGIs $50k-75k, 4.9% for AGIs $75k-100k, 5.4% for AGIs $100k-200k, 1.5% for AGIs over 200k)
Self-employment retirement plans: $42,389 (reported on 7.1% of returns)
10583:
$42,389
New York:
$27,330
(% of AGI for various income ranges: 0.6% for AGIs $25k-50k, 0.2% for AGIs $75k-100k, 0.7% for AGIs $100k-200k, 0.8% for AGIs over 200k)
Total itemized deductions: $102,675 (18% of AGI, reported on 67.0% of returns)
Here:
$102,675
State:
$34,985
Here:
18.0% of AGI
State:
21.3% of AGI
(% of AGI for various income ranges: 31.4% for AGIs below $25k, 24.5% for AGIs $25k-50k, 25.1% for AGIs $50k-75k, 25.8% for AGIs $75k-100k, 25.0% for AGIs $100k-200k, 16.6% for AGIs over 200k)
Charity contributions: $19,241 (reported on 60.2% of returns)
Here:
$19,241
State:
$5,572
(% of AGI for various income ranges: 1.2% for AGIs below $25k, 1.5% for AGIs $25k-50k, 1.9% for AGIs $50k-75k, 1.9% for AGIs $75k-100k, 2.1% for AGIs $100k-200k, 3.1% for AGIs over 200k)
Taxes paid: $65,556 (reported on 66.7% of returns)
10583:
$65,556
State:
$18,656
(% of AGI for various income ranges: 13.6% for AGIs below $25k, 11.4% for AGIs $25k-50k, 12.5% for AGIs $50k-75k, 13.2% for AGIs $75k-100k, 14.2% for AGIs $100k-200k, 10.8% for AGIs over 200k)
Earned income credit: $1,433 (reported on 2.6% of returns)
Here:
$1,433
State:
$2,230
(% of AGI for various income ranges: 1.2% for AGIs below $25k, 0.3% for AGIs $25k-50k)
Percentage of individuals using paid preparers for their 2012 taxes: 75.7%
Here:
76%
State:
66%
(% for various income ranges: 71.8% for AGIs below $25k, 70.6% for AGIs $25k-50k, 73.1% for AGIs $50k-75k, 75.4% for AGIs $75k-100k, 75.9% for AGIs $100k-200k, 81.0% for AGIs over 200k)
Averages for the 2004 tax year for zip code 10583, filed in 2005:
Average Adjusted Gross Income (AGI) in 2004: $251,702 (Individual Income Tax Returns)
Here:
$251,702
State:
$59,519
Salary/wage: $183,970 (reported on 70.1% of returns)
Here:
$183,970
State:
$50,673
(% of AGI for various income ranges: 52.4% for AGIs $10k-25k, 68.0% for AGIs $25k-50k, 64.2% for AGIs $50k-75k, 64.1% for AGIs $75k-100k, 49.4% for AGIs over 100k)
Taxable interest for individuals: $9,714 (reported on 81.7% of returns)
This zip code:
$9,714
New York:
$2,377
(% of AGI for various income ranges: 9.3% for AGIs $10k-25k, 4.7% for AGIs $25k-50k, 3.6% for AGIs $50k-75k, 3.3% for AGIs $75k-100k, 2.9% for AGIs over 100k)
Taxable dividends: $15,117 (reported on 68.1% of returns)
Here:
$15,117
State:
$5,394
(% of AGI for various income ranges: 9.2% for AGIs $10k-25k, 5.2% for AGIs $25k-50k, 4.6% for AGIs $50k-75k, 4.1% for AGIs $75k-100k, 3.9% for AGIs over 100k)
Net capital gain/loss: +$69,991 (reported on 60.9% of returns)
Here:
+$69,991
State:
+$23,581
(% of AGI for various income ranges: 2.3% for AGIs $10k-25k, 2.0% for AGIs $25k-50k, 1.8% for AGIs $50k-75k, 1.9% for AGIs $75k-100k, 17.7% for AGIs over 100k)
Profit/loss from business: +$57,538 (reported on 19.3% of returns)
Here:
+$57,538
State:
+$13,809
(% of AGI for various income ranges: 8.8% for AGIs $10k-25k, 6.3% for AGIs $25k-50k, 4.8% for AGIs $50k-75k, 5.1% for AGIs $75k-100k, 4.2% for AGIs over 100k)
IRA payment deduction: $3,888 (reported on 4.2% of returns)
10583:
$3,888
New York:
$3,115
(% of AGI for various income ranges: 0.6% for AGIs $10k-25k, 0.6% for AGIs $25k-50k, 0.4% for AGIs $50k-75k, 0.3% for AGIs $75k-100k, 0.0% for AGIs over 100k)
Self-employed pension: $31,969 (reported on 7.7% of returns)
Here:
$31,969
New York:
$19,016
(% of AGI for various income ranges: 0.2% for AGIs $10k-25k, 0.3% for AGIs $25k-50k, 0.5% for AGIs $50k-75k, 0.5% for AGIs $75k-100k, 1.0% for AGIs over 100k)
Total itemized deductions: $67,404 (17% of AGI, reported on 63.9% of returns)
Here:
$67,404
State:
$25,864
Here:
17.4% of AGI
State:
21.9% of AGI
(% of AGI for various income ranges: 32.2% for AGIs $10k-25k, 27.0% for AGIs $25k-50k, 26.8% for AGIs $50k-75k, 26.7% for AGIs $75k-100k, 16.1% for AGIs over 100k)
Charity contributions deductions: $15,246 (4% of AGI, reported on 59.9% of returns)
Here:
$15,246
State:
$4,439
Here:
3.8% of AGI
State:
3.6% of AGI
(% of AGI for various income ranges: 2.2% for AGIs $10k-25k, 2.4% for AGIs $25k-50k, 2.7% for AGIs $50k-75k, 2.9% for AGIs $75k-100k, 3.7% for AGIs over 100k)
Total tax: $70,296 (reported on 82.7% of returns)
10583:
$70,296
State:
$11,730
(% of AGI for various income ranges: 5.2% for AGIs $10k-25k, 7.9% for AGIs $25k-50k, 10.4% for AGIs $50k-75k, 11.2% for AGIs $75k-100k, 23.9% for AGIs over 100k)
Earned income credit: $1,147 (reported on 2.2% of returns)
Here:
$1,147
State:
$1,757
Percentage of individuals using paid preparers for their 2004 taxes: 76.5%
Here:
76%
State:
67%
(% for various income ranges: 74.8% for AGIs below $10k, 72.0% for AGIs $10k-25k, 71.9% for AGIs $25k-50k, 73.7% for AGIs $50k-75k, 74.4% for AGIs $75k-100k, 80.6% for AGIs over 100k)
Likely homosexual households (counted as self-reported same-sex unmarried-partner households)
Lesbian couples: 0.0% of all households
Gay men: 0.1% of all households
Household received Food Stamps/SNAP in the past 12 months: 257 Household did not receive Food Stamps/SNAP in the past 12 months: 13,979
Women who had a birth in the past 12 months: 363 (332 now married, 26 unmarried) Women who did not have a birth in the past 12 months: 7,828 (4,537 now married, 3,208 unmarried)
Housing units in zip code 10583 with a mortgage: 7,321 (880 second mortgage, 877 both second mortgage and home equity loan) Houses without a mortgage: 157
Median monthly owner costs for units with a mortgage: $3,860 Median monthly owner costs for units without a mortgage: $1,487
Residents with income below the poverty level in 2022:
This zip code:
3.2%
Whole state:
14.3%
Residents with income below 50% of the poverty level in 2022:
This zip code:
1.3%
Whole state:
6.8%
Median number of rooms in houses and condos:
Here:
8.0
State:
6.3
Median number of rooms in apartments:
Here:
4.5
State:
3.8
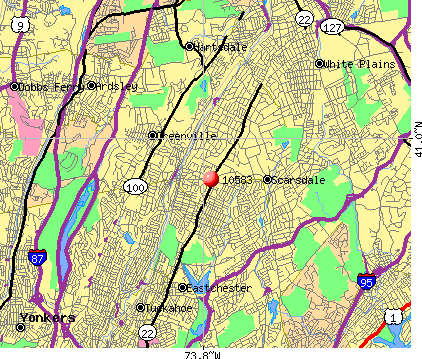
Notable locations in this zip code not listed on our city pages
Notable locations in zip code 10583: Lake Isle Country Club (A), Sunningdale Country Club (B), Scarsdale Station (C), Saxon Woods Golf Course (D), Quaker Ridge Golf Club (E), Leewood Golf Club (F), Scarsdale Public Library (G), Scarsdale Village Hall (H), Sprain Brook Manor Nursing Home (I), Scarsdale Village Hall (J), Scarsdale Fire Department (K). Display/hide their locations on the map
Shopping Centers: Vernon Hills Shopping Center (1), Universal Shopping Center (2), Central Plaza Shopping Center (3), Midway Shopping Center (4). Display/hide their locations on the map
Churches in zip code 10583 include: Westchester Temple (A), Trinity Lutheran Church (B), Saint Pius X Church (C), Scarsdale Friends Meetinghouse (D), Scarsdale Congregational Church (E), Scarsdale Community Baptist Church (F), Our Lady of Fatima Church (G), Immaculate Heart of Mary Church (H), Greenville Community Reformed Church (I). Display/hide their locations on the map
Parks in zip code 10583 include: George W Field Park (1), Greenburgh Nature Center (2), Harwood Park (3), Saxon Woods Park (4), Dunwoodie Park (5), Crossway Field (6), Butler Field (7), Cooper Green (8), Corell Park (9). Display/hide their locations on the map
9,609 married couples with children.
834 single-parent households (411 men, 423 women).
70.9% of residents of 10583 zip code speak English at home.
5.5% of residents speak Spanish at home (80% very well, 12% well, 6% not well, 1% not at all).
11.1% of residents speak other Indo-European language at home (83% very well, 13% well, 3% not well).
10.6% of residents speak Asian or Pacific Island language at home (62% very well, 24% well, 8% not well, 6% not at all).
1.8% of residents speak other language at home (92% very well, 8% well).
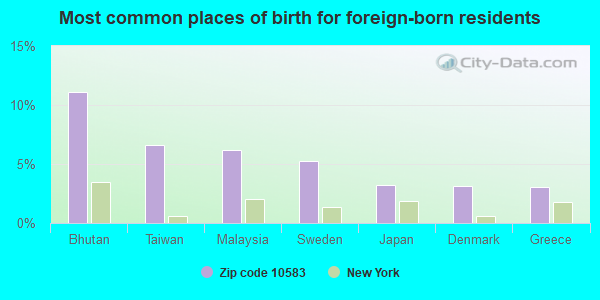
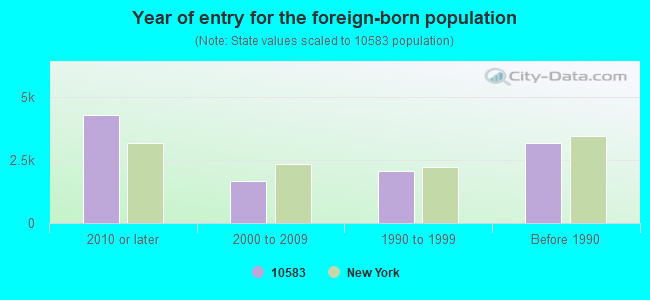
Foreign born population: 10,208 (25.2%) (61.4% of them are naturalized citizens)
Major facilities with environmental interests located in this zip code:
HEATHCOTE TAILORS CORP (46 EAST PKWY in SCARSDALE, NY)
AIR MINOR (AIRS/AFS) STATE MASTER (New York facility tracking) - AIR PROGRAM (Resource Conservation and Recovery Act (tracking hazardous waste)) Business SIC classification: DRYCLEANING PLANTS, EXCEPT RUG CLEANING Business NAICS classification: DRYCLEANING AND LAUNDRY SERVICES (EXCEPT COIN-OPERATED).
HAPPY CLEANERS (62 GARTH ROAD in SCARSDALE, NY)
AIR MINOR (AIRS/AFS) STATE MASTER (New York facility tracking) - AIR PROGRAM Business SIC classification: DRYCLEANING PLANTS, EXCEPT RUG CLEANING Business NAICS classification: DRYCLEANING AND LAUNDRY SERVICES (EXCEPT COIN-OPERATED).
J & R AUTO BODY WORKS INC (200 BROOK ST in SCARSDALE, NY)
STATE MASTER (New York facility tracking) - AIR PROGRAM, Small Quantity Generators, between 100 kg and 1000 kg of hazardous waste/month (Resource Conservation and Recovery Act (tracking hazardous waste)) - notification Organizations: BOB DICINTIO (CONTACT/OWNER)
GREENACRES SCHOOL ( in SCARSDALE, NY)
(Geographic Names Information System) (National Center for Education Statistics) - STATE ID-662001030003 Organizations: SCARSDALE UFSD (SCHOOL DISTRICT)
GREENVALE SCHOOL ( in SCARSDALE, NY)
(Geographic Names Information System) (National Center for Education Statistics) - STATE ID-660301030003 Organizations: EASTCHESTER UFSD (SCHOOL DISTRICT)
GREENVILLE SCHOOL ( in SCARSDALE, NY)
(Geographic Names Information System) (National Center for Education Statistics) - STATE ID-660406030001 Organizations: EDGEMONT UFSD (SCHOOL DISTRICT)
HEATHCOTE SCHOOL ( in SCARSDALE, NY)
(National Center for Education Statistics) - STATE ID-662001030004 Organizations: SCARSDALE UFSD (SCHOOL DISTRICT)
HEATHCOTE ELEMENTARY SCHOOL (26 PALMER AVENUE in SCARSDALE, NY)
(Integrated Compliance Information System) - ICIS-02-2003-1054, FORMAL ENFORCEMENT ACTION Business SIC classification: ELEMENTARY AND SECONDARY SCHOOLS
HOF & POF REALTY (3 MT JOY AVE in SCARSDALE, NY)
(Integrated Compliance Information System) - ICIS-02-1997-0137, FORMAL ENFORCEMENT ACTION Business SIC classification: REAL ESTATE AGENTS AND MANAGERS
HARNEY CLEANERS (69 HARNEY ROAD in SCARSDALE, NY)
(Resource Conservation and Recovery Act (tracking hazardous waste)) Small Quantity Generators, between 100 kg and 1000 kg of hazardous waste/month (Resource Conservation and Recovery Act (tracking hazardous waste)) - notification Organizations: JOHN DETTORE (CONTACT/OWNER)
HAUSMAN REALTY CORP (51 CHRISTIE PL in SCARSDALE, NY)
Large Quantity Generators, more that 1000 kg of hazardous waste/month (Resource Conservation and Recovery Act (tracking hazardous waste)) - notification
CON ED - SCARSDALE #39 (WHITE PLAINS POST RD &DRAKE RD in SCARSDALE, NY)
HAZARDOUS WASTE BIENNIAL REPORTER (Resource Conservation and Recovery Act (tracking hazardous waste)) (Resource Conservation and Recovery Act (tracking hazardous waste))
A & A SERVICE CENTER (144 SUMMERFIELD ST in SCARSDALE, NY)
(Resource Conservation and Recovery Act (tracking hazardous waste))
Housing units lacking complete plumbing facilities: 0.6% Housing units lacking complete kitchen facilities: 0.8%
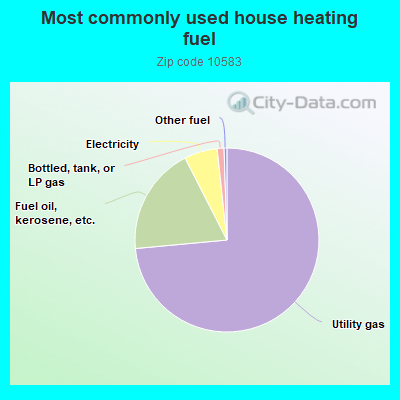
73.3%Utility gas
18.9%Fuel oil, kerosene, etc.
5.8%Electricity
1.2%Bottled, tank, or LP gas
0.5%Other fuel
Population in 1990: 35,302. Population change in the 1990s: +3,789 (+10.7%).
Place of birth for U.S.-born residents:
This state: 22,136
Northeast: 3,298
Midwest: 1,349
South: 1,512
West: 1,262
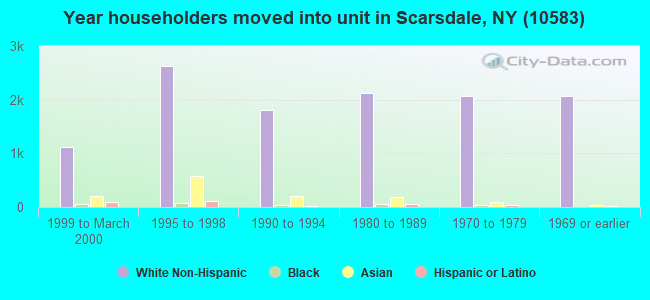
69% of the 10583 zip code residents lived in the same house 5 years ago. Out of people who lived in different houses, 55% lived in this county. Out of people who lived in different counties, 50% lived in New York.
92% of the 10583 zip code residents lived in the same house 1 year ago. Out of people who lived in different houses, 37% moved from this county. Out of people who lived in different houses, 28% moved from different county within same state. Out of people who lived in different houses, 20% moved from different state. Out of people who lived in different houses, 17% moved from abroad.
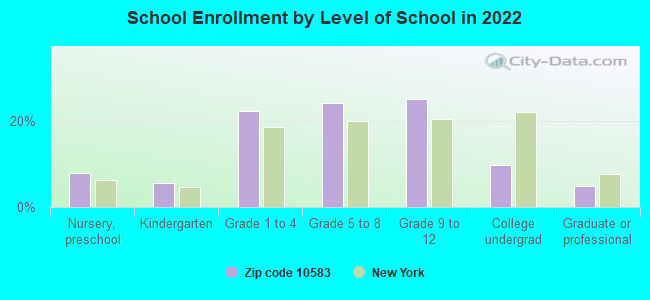
Private vs. public school enrollment:
Students in private schools in grades 1 to 8 (elementary and middle school): 484
Here:
9.0%
New York:
15.6%
Students in private schools in grades 9 to 12 (high school): 349
Here:
12.0%
New York:
15.0%
Students in private undergraduate colleges: 689
Here:
60.6%
New York:
39.2%
Occupation by median earnings in the past 12 months ($)
247,483Legal occupations
205,927Health diagnosing and treating practitioners and other technical occupations
183,674Management occupations
161,257Computer and mathematical occupations
138,309Business and financial operations occupations
136,821Law enforcement workers including supervisors
Companies with federal contracts located in this zip code:
CKL TECHNOLOGIES INC. (455 CENTRAL PARK AVE. in SCARSDALE, NY; small business) : $293,820 in 2 contractsin 2000
$194,370 with Air Force for Electrical Control Equipment. Signed on 2000-06-09. Completion date: 2000-06-30.
$99,450, same as above.Signed on 2000-03-07. Completion date: 2000-03-01.
SPECTRONIX SYSTEMS, INC (24 ROBIN HILL ROAD in SCARSDALE, NY; small business) : $170,000 in 2 contractsfrom 2002 to 2003
$100,000 with Air Force for Defense Electronics and Communication Equipment -- Management and Support (R&D). Taking place in CA. Signed on 2002-08-20. Completion date: 2003-06-12.
$70,000 with Department of Defense for Other Defense -- Advanced Development (R&D). Signed on 2003-01-06. Completion date: 2003-07-05.
Top industries in this zip code by the number of employees in 2005:
2002 - 2018 National Fire Incident Reporting System (NFIRS) incidents
According to the data from the years 2002 - 2018 the average number of fire incidents per year is 169. The highest number of reported fire incidents - 235 took place in 2006, and the least - 57 in 2002. The data has an increasing trend.
When looking into fire subcategories, the most incidents belonged to: Structure Fires (72.3%), and Outside Fires (12.9%).
Fire incident types reported to NFIRS in Zip Code 10583


 Nearest zip codes: 10606, 10709, 10804, 10530, 10707, 10605.


 According to the data from the years 2002 - 2018 the average number of fire incidents per year is 169. The highest number of reported fire incidents - 235 took place in 2006, and the least - 57 in 2002. The data has an increasing trend.
 When looking into fire subcategories, the most incidents belonged to: Structure Fires (72.3%), and Outside Fires (12.9%).