Estimated zip code population in 2022: 22,236 Zip code population in 2010: 21,225 Zip code population in 2000: 22,411
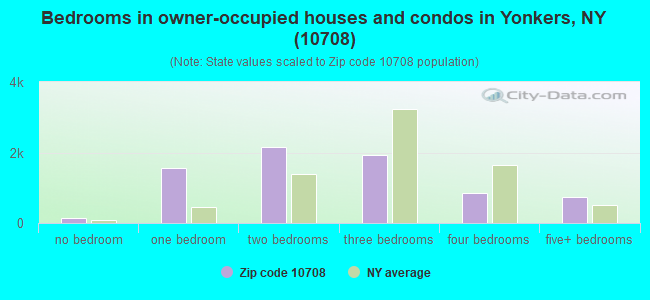
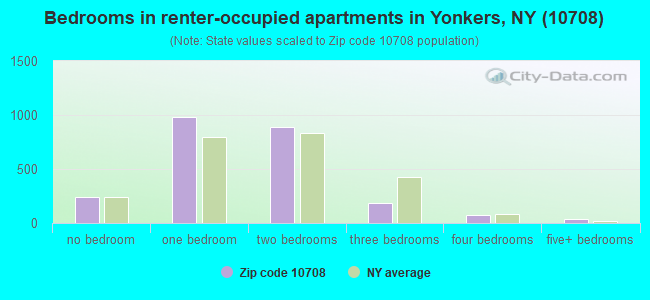
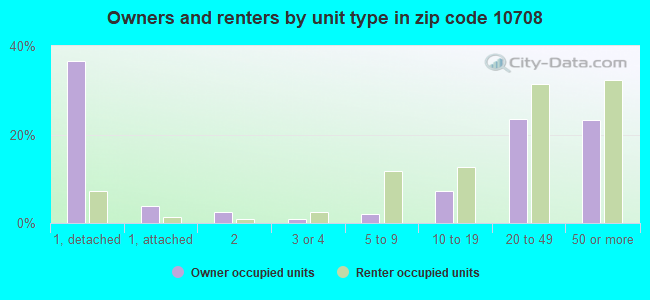
Houses and condos: 10,174 Renter-occupied apartments: 2,414
% of renters here:
25%
State:
46%
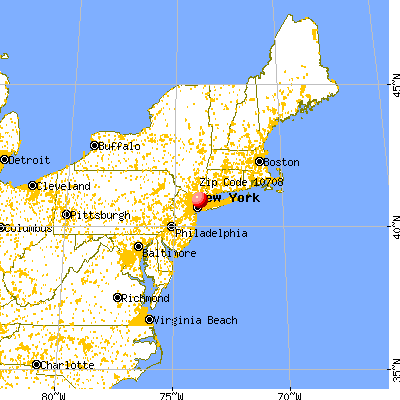
March 2022 cost of living index in zip code 10708: 147.1 (very high, U.S. average is 100)
Land area: 3.1 sq. mi. Water area: 0.0 sq. mi.
Population density: 7,224 people per square mile
(high).
OSM Map
General Map
Google Map
MSN Map
OSM Map
General Map
Google Map
MSN Map
OSM Map
General Map
Google Map
MSN Map
OSM Map
General Map
Google Map
MSN Map
Please wait while loading the map...
Real estate property taxes paid for housing units in 2022:
This zip code:
2.0% ($9,805)
New York:
1.5% ($6,180)
Median real estate property taxes paid for housing units with mortgages in 2022: $9,858 (1.6%) Median real estate property taxes paid for housing units with no mortgage in 2022: $9,755 (2.3%)
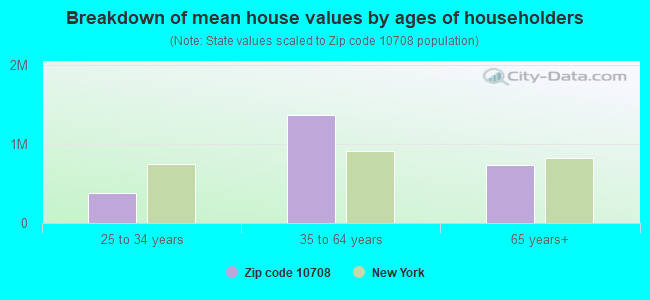
Estimated median house/condo value in 2022: $501,412
10708:
$501,412
New York:
$400,400
According to our research of New York and other state lists, there was 1 registered sex offender living in 10708 zip code as of April 27, 2024. The ratio of all residents to sex offenders in zip code 10708 is 22,956 to 1. The ratio of registered sex offenders to all residents in this zip code is much lower than the state average.
Median resident age:
This zip code:
43.8 years
New York median age:
40.0 years
Average household size:
This zip code:
2.1 people
New York:
2.5 people
Averages for the 2020 tax year for zip code 10708, filed in 2021:
Average Adjusted Gross Income (AGI) in 2020: $318,104 (Individual Income Tax Returns)
Here:
$318,104
State:
$90,930
Salary/wage: $209,515 (reported on 74.3% of returns)
Here:
$209,515
State:
$72,104
(% of AGI for various income ranges: 957.4% for AGIs below $25k, 3432.5% for AGIs $25k-50k, 6369.9% for AGIs $50k-75k, 9808.9% for AGIs $75k-100k, 18370.6% for AGIs $100k-200k, 223740.7% for AGIs over 200k)
Taxable interest for individuals: $9,521 (reported on 54.7% of returns)
This zip code:
$9,521
New York:
$3,075
(% of AGI for various income ranges: 53.2% for AGIs below $25k, 85.7% for AGIs $25k-50k, 104.9% for AGIs $50k-75k, 116.6% for AGIs $75k-100k, 250.7% for AGIs $100k-200k, 8703.1% for AGIs over 200k)
Ordinary dividends: $27,734 (reported on 46.8% of returns)
Here:
$27,734
State:
$11,095
(% of AGI for various income ranges: 171.3% for AGIs below $25k, 276.0% for AGIs $25k-50k, 256.6% for AGIs $50k-75k, 428.9% for AGIs $75k-100k, 882.3% for AGIs $100k-200k, 20793.6% for AGIs over 200k)
Net capital gain/loss in AGI: +$199,622 (reported on 42.9% of returns)
Here:
+$199,622
State:
+$44,925
(% of AGI for various income ranges: 103.2% for AGIs below $25k, 208.4% for AGIs $25k-50k, 233.4% for AGIs $50k-75k, 298.9% for AGIs $75k-100k, 848.8% for AGIs $100k-200k, 157641.1% for AGIs over 200k)
Profit/loss from business: +$35,046 (reported on 16.6% of returns)
Here:
+$35,046
State:
+$14,940
(% of AGI for various income ranges: 208.4% for AGIs below $25k, 239.9% for AGIs $25k-50k, 201.1% for AGIs $50k-75k, 258.0% for AGIs $75k-100k, 660.9% for AGIs $100k-200k, 8141.8% for AGIs over 200k)
Taxable individual retirement arrangement distribution: $37,080 (reported on 12.9% of returns)
10708:
$37,080
New York:
$19,609
(% of AGI for various income ranges: 108.6% for AGIs below $25k, 200.0% for AGIs $25k-50k, 275.6% for AGIs $50k-75k, 480.7% for AGIs $75k-100k, 949.0% for AGIs $100k-200k, 5453.0% for AGIs over 200k)
Self-employed (Keogh) retirement plans: $44,439 (reported on 2.9% of returns)
10708:
$44,439
New York:
$32,497
(% of AGI for various income ranges: 30.9% for AGIs $25k-50k, 73.1% for AGIs $100k-200k, 2204.9% for AGIs over 200k)
Total itemized deductions: $59,642 (reported on 28.9% of returns)
Here:
$59,642
State:
$39,326
(% of AGI for various income ranges: 223.8% for AGIs below $25k, 400.8% for AGIs $25k-50k, 618.6% for AGIs $50k-75k, 1058.4% for AGIs $75k-100k, 1811.5% for AGIs $100k-200k, 25214.1% for AGIs over 200k)
Charity contributions: $32,913 (reported on 26.0% of returns)
Here:
$32,913
State:
$15,420
(% of AGI for various income ranges: 15.2% for AGIs below $25k, 36.6% for AGIs $25k-50k, 63.9% for AGIs $50k-75k, 150.3% for AGIs $75k-100k, 325.9% for AGIs $100k-200k, 14963.3% for AGIs over 200k)
Taxes paid: $9,241 (reported on 28.9% of returns)
10708:
$9,241
State:
$9,183
(% of AGI for various income ranges: 58.2% for AGIs below $25k, 101.6% for AGIs $25k-50k, 162.4% for AGIs $50k-75k, 356.3% for AGIs $75k-100k, 652.6% for AGIs $100k-200k, 2672.0% for AGIs over 200k)
Earned income credit: $1,659 (reported on 4.0% of returns)
Here:
$1,659
State:
$2,138
(% of AGI for various income ranges: 47.2% for AGIs below $25k, 27.2% for AGIs $25k-50k)
Percentage of individuals using paid preparers for their 2020 taxes: 94.0%
Here:
94%
State:
95%
(% for various income ranges: 91.7% for AGIs below $25k, 93.5% for AGIs $25k-50k, 93.4% for AGIs $50k-75k, 93.7% for AGIs $75k-100k, 94.8% for AGIs $100k-200k, 95.8% for AGIs over 200k)
Averages for the 2012 tax year for zip code 10708, filed in 2013:
Average Adjusted Gross Income (AGI) in 2012: $270,922 (Individual Income Tax Returns)
Here:
$270,922
State:
$77,088
Salary/wage: $178,322 (reported on 75.3% of returns)
Here:
$178,322
State:
$60,593
(% of AGI for various income ranges: 51.8% for AGIs below $25k, 69.8% for AGIs $25k-50k, 69.9% for AGIs $50k-75k, 69.8% for AGIs $75k-100k, 70.1% for AGIs $100k-200k, 44.8% for AGIs over 200k)
Taxable interest for individuals: $11,148 (reported on 60.7% of returns)
This zip code:
$11,148
New York:
$3,125
(% of AGI for various income ranges: 3.9% for AGIs below $25k, 1.6% for AGIs $25k-50k, 1.2% for AGIs $50k-75k, 1.5% for AGIs $75k-100k, 1.2% for AGIs $100k-200k, 2.8% for AGIs over 200k)
Ordinary dividends: $27,825 (reported on 47.3% of returns)
Here:
$27,825
State:
$10,299
(% of AGI for various income ranges: 9.3% for AGIs below $25k, 3.9% for AGIs $25k-50k, 3.0% for AGIs $50k-75k, 3.3% for AGIs $75k-100k, 3.4% for AGIs $100k-200k, 5.2% for AGIs over 200k)
Net capital gain/loss in AGI: +$146,355 (reported on 40.7% of returns)
Here:
+$146,355
State:
+$42,474
(% of AGI for various income ranges: 0.7% for AGIs $25k-50k, 0.3% for AGIs $50k-75k, 1.0% for AGIs $75k-100k, 1.6% for AGIs $100k-200k, 27.1% for AGIs over 200k)
Profit/loss from business: +$33,927 (reported on 17.0% of returns)
Here:
+$33,927
State:
+$16,168
(% of AGI for various income ranges: 8.8% for AGIs below $25k, 5.1% for AGIs $25k-50k, 2.8% for AGIs $50k-75k, 1.7% for AGIs $75k-100k, 3.6% for AGIs $100k-200k, 1.8% for AGIs over 200k)
Taxable individual retirement arrangement distribution: $38,291 (reported on 16.6% of returns)
10708:
$38,291
New York:
$17,621
(% of AGI for various income ranges: 6.7% for AGIs below $25k, 3.6% for AGIs $25k-50k, 3.8% for AGIs $50k-75k, 3.7% for AGIs $75k-100k, 4.5% for AGIs $100k-200k, 1.9% for AGIs over 200k)
Self-employment retirement plans: $36,833 (reported on 3.1% of returns)
10708:
$36,833
New York:
$27,330
(% of AGI for various income ranges: 0.4% for AGIs $50k-75k, 0.3% for AGIs $100k-200k, 0.5% for AGIs over 200k)
Total itemized deductions: $70,546 (17% of AGI, reported on 63.2% of returns)
Here:
$70,546
State:
$34,985
Here:
17.3% of AGI
State:
21.3% of AGI
(% of AGI for various income ranges: 27.8% for AGIs below $25k, 18.3% for AGIs $25k-50k, 19.2% for AGIs $50k-75k, 20.1% for AGIs $75k-100k, 21.8% for AGIs $100k-200k, 15.4% for AGIs over 200k)
Charity contributions: $12,106 (reported on 56.7% of returns)
Here:
$12,106
State:
$5,572
(% of AGI for various income ranges: 1.3% for AGIs below $25k, 1.8% for AGIs $25k-50k, 1.9% for AGIs $50k-75k, 2.0% for AGIs $75k-100k, 2.0% for AGIs $100k-200k, 2.7% for AGIs over 200k)
Taxes paid: $42,652 (reported on 63.0% of returns)
10708:
$42,652
State:
$18,656
(% of AGI for various income ranges: 10.1% for AGIs below $25k, 6.3% for AGIs $25k-50k, 7.8% for AGIs $50k-75k, 8.8% for AGIs $75k-100k, 10.9% for AGIs $100k-200k, 10.0% for AGIs over 200k)
Earned income credit: $1,571 (reported on 4.2% of returns)
Here:
$1,571
State:
$2,230
(% of AGI for various income ranges: 2.1% for AGIs below $25k, 0.4% for AGIs $25k-50k)
Percentage of individuals using paid preparers for their 2012 taxes: 73.8%
Here:
74%
State:
66%
(% for various income ranges: 68.2% for AGIs below $25k, 68.9% for AGIs $25k-50k, 70.5% for AGIs $50k-75k, 74.8% for AGIs $75k-100k, 75.8% for AGIs $100k-200k, 84.0% for AGIs over 200k)
Averages for the 2004 tax year for zip code 10708, filed in 2005:
Average Adjusted Gross Income (AGI) in 2004: $191,382 (Individual Income Tax Returns)
Here:
$191,382
State:
$59,519
Salary/wage: $149,433 (reported on 74.0% of returns)
Here:
$149,433
State:
$50,673
(% of AGI for various income ranges: 175.1% for AGIs below $10k, 52.3% for AGIs $10k-25k, 72.8% for AGIs $25k-50k, 72.5% for AGIs $50k-75k, 72.9% for AGIs $75k-100k, 55.4% for AGIs over 100k)
Taxable interest for individuals: $5,368 (reported on 73.9% of returns)
This zip code:
$5,368
New York:
$2,377
(% of AGI for various income ranges: 47.8% for AGIs below $10k, 7.4% for AGIs $10k-25k, 2.9% for AGIs $25k-50k, 2.2% for AGIs $50k-75k, 2.0% for AGIs $75k-100k, 1.9% for AGIs over 100k)
Taxable dividends: $16,852 (reported on 54.6% of returns)
Here:
$16,852
State:
$5,394
(% of AGI for various income ranges: 76.8% for AGIs below $10k, 7.4% for AGIs $10k-25k, 3.2% for AGIs $25k-50k, 2.9% for AGIs $50k-75k, 2.5% for AGIs $75k-100k, 5.0% for AGIs over 100k)
Net capital gain/loss: +$71,619 (reported on 46.6% of returns)
Here:
+$71,619
State:
+$23,581
(% of AGI for various income ranges: -29.5% for AGIs below $10k, 1.4% for AGIs $10k-25k, 0.3% for AGIs $25k-50k, 1.1% for AGIs $50k-75k, 1.4% for AGIs $75k-100k, 20.2% for AGIs over 100k)
Profit/loss from business: +$30,351 (reported on 16.7% of returns)
Here:
+$30,351
State:
+$13,809
(% of AGI for various income ranges: 26.0% for AGIs below $10k, 8.9% for AGIs $10k-25k, 3.2% for AGIs $25k-50k, 2.8% for AGIs $50k-75k, 3.2% for AGIs $75k-100k, 2.5% for AGIs over 100k)
IRA payment deduction: $3,411 (reported on 3.9% of returns)
10708:
$3,411
New York:
$3,115
(% of AGI for various income ranges: 1.1% for AGIs below $10k, 0.6% for AGIs $10k-25k, 0.5% for AGIs $25k-50k, 0.3% for AGIs $50k-75k, 0.2% for AGIs $75k-100k, 0.0% for AGIs over 100k)
Self-employed pension: $28,601 (reported on 3.9% of returns)
Here:
$28,601
New York:
$19,016
(% of AGI for various income ranges: 0.2% for AGIs $25k-50k, 0.3% for AGIs $50k-75k, 0.2% for AGIs $75k-100k, 0.6% for AGIs over 100k)
Total itemized deductions: $47,023 (16% of AGI, reported on 62.2% of returns)
Here:
$47,023
State:
$25,864
Here:
16.2% of AGI
State:
21.9% of AGI
(% of AGI for various income ranges: 81.1% for AGIs below $10k, 28.0% for AGIs $10k-25k, 20.6% for AGIs $25k-50k, 20.9% for AGIs $50k-75k, 20.6% for AGIs $75k-100k, 14.2% for AGIs over 100k)
Charity contributions deductions: $8,277 (3% of AGI, reported on 59.0% of returns)
Here:
$8,277
State:
$4,439
Here:
2.7% of AGI
State:
3.6% of AGI
(% of AGI for various income ranges: 3.5% for AGIs below $10k, 2.4% for AGIs $10k-25k, 2.7% for AGIs $25k-50k, 2.7% for AGIs $50k-75k, 2.6% for AGIs $75k-100k, 2.5% for AGIs over 100k)
Total tax: $49,465 (reported on 85.8% of returns)
10708:
$49,465
State:
$11,730
(% of AGI for various income ranges: 17.9% for AGIs below $10k, 4.8% for AGIs $10k-25k, 8.3% for AGIs $25k-50k, 11.5% for AGIs $50k-75k, 12.6% for AGIs $75k-100k, 24.1% for AGIs over 100k)
Earned income credit: $1,209 (reported on 3.3% of returns)
Here:
$1,209
State:
$1,757
Percentage of individuals using paid preparers for their 2004 taxes: 72.6%
Here:
73%
State:
67%
(% for various income ranges: 69.8% for AGIs below $10k, 66.4% for AGIs $10k-25k, 68.3% for AGIs $25k-50k, 70.9% for AGIs $50k-75k, 75.2% for AGIs $75k-100k, 79.1% for AGIs over 100k)
Likely homosexual households (counted as self-reported same-sex unmarried-partner households)
Lesbian couples: 0.0% of all households
Gay men: 0.1% of all households
Household received Food Stamps/SNAP in the past 12 months: 169 Household did not receive Food Stamps/SNAP in the past 12 months: 9,389
Women who had a birth in the past 12 months: 271 (252 now married, 15 unmarried) Women who did not have a birth in the past 12 months: 4,896 (1,744 now married, 3,154 unmarried)
Housing units in zip code 10708 with a mortgage: 3,757 (274 second mortgage, 277 both second mortgage and home equity loan) Houses without a mortgage: 46
Median monthly owner costs for units with a mortgage: $3,023 Median monthly owner costs for units without a mortgage: $1,140
Residents with income below the poverty level in 2022:
This zip code:
6.6%
Whole state:
14.3%
Residents with income below 50% of the poverty level in 2022:
This zip code:
3.1%
Whole state:
6.8%
Median number of rooms in houses and condos:
Here:
5.2
State:
6.3
Median number of rooms in apartments:
Here:
3.7
State:
3.8
Notable locations in this zip code not listed on our city pages
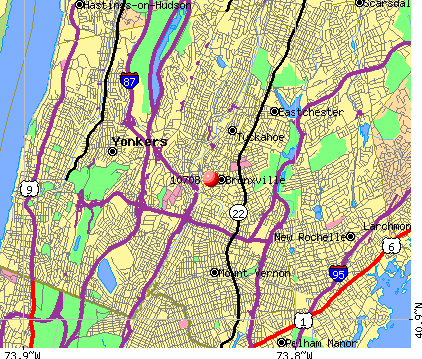
Notable locations in zip code 10708: Union Corners (A), Siwanoy Country Club (B), Bronxville Station (C), Feth Administration Hall (D), Sieker Hall (E), Scheele Memorial Library (F), Romoser Hall (G), Brunn-Maier Hall (H), Sommer Center for Worship and the Performing Arts (I), Rippe Hall (J), Schoenfeld Campus Center (K), Bohm Hall (L), Stein Hall (M), Meyer Athletic Center (N), Bronxville Public Library (O), Charles DeCarlo Performing Arts Center (P), Ruth Leff Siegel Center (Q), Westland Gate House (R), MacCracken Center (S), Swinford House (T). Display/hide their locations on the map
Churches in zip code 10708 include: Church of Saint Joseph (A), First Baptist Church (B), Village Lutheran Church (C), West Center Congregational Church (D), Saint Joseph's Church (E), Reformed Church of Bronxville (F), First Church of Christ Scientist (G), Christ Church (H). Display/hide their locations on the map
Parks in zip code 10708 include: Parkway Field (1), Music Terrace (2), Andrews Court (3), John E Andrus Memorial Park (4), Sunnybrook Park (5), James P Scotti Junior Park (6). Display/hide their locations on the map
In group quarters: 1,554 (-1 institutionalized population)
Size of family households: 3,199 2-persons, 1,196 3-persons, 1,039 4-persons, 280 5-persons, 112 6-persons, 34 7-or-more-persons
Size of nonfamily households: 3,262 1-person, 509 2-persons, 119 3-persons
3,189 married couples with children.
484 single-parent households (199 men, 285 women).
76.7% of residents of 10708 zip code speak English at home.
9.0% of residents speak Spanish at home (83% very well, 9% well, 7% not well, 2% not at all).
8.1% of residents speak other Indo-European language at home (82% very well, 15% well, 3% not well).
4.2% of residents speak Asian or Pacific Island language at home (64% very well, 17% well, 20% not well).
2.1% of residents speak other language at home (69% very well, 16% well, 16% not well).
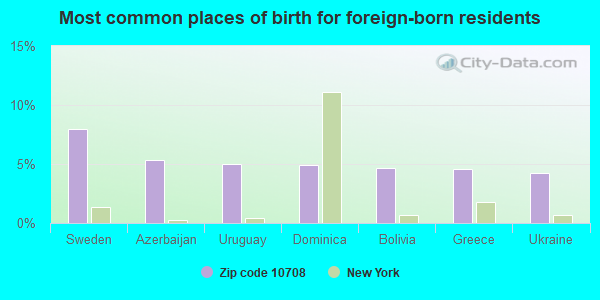
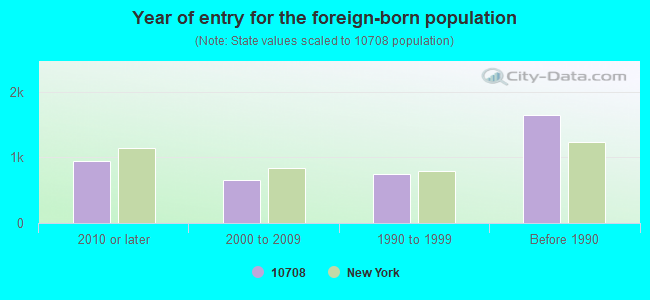
Foreign born population: 3,521 (15.8%) (72.4% of them are naturalized citizens)
Facilities with environmental interests located in this zip code:
GETTY SERVICE STATION (719 BRONX RIVER RD in YONKERS, NY)
STATE MASTER (New York facility tracking) - AIR PROGRAM (Resource Conservation and Recovery Act (tracking hazardous waste)) Organizations: GETTY OIL CORP (CONTACT/OPERATOR)
, GETTY PETROLEUM MARKETING INC (LEGALLY RESPONSIBLE PARTY)
J & K CLEANERS (16 PALMER AVE in BRONXVILLE, NY)
AIR MINOR (AIRS/AFS) STATE MASTER (New York facility tracking) - AIR PROGRAM Conditionally Exempt Small Quantity Generators, less than 100 kg/month of hazardous waste (Resource Conservation and Recovery Act (tracking hazardous waste)) Business SIC classification: DRYCLEANING PLANTS, EXCEPT RUG CLEANING Business NAICS classification: DRYCLEANING AND LAUNDRY SERVICES (EXCEPT COIN-OPERATED).
CLOTHES DOCTOR CLEANERS THE (121 PARKWAY RD in BRONXVILLE, NY)
STATE MASTER (New York facility tracking) - HAZARDOUS WASTE PROGRAM Small Quantity Generators, between 100 kg and 1000 kg of hazardous waste/month (Resource Conservation and Recovery Act (tracking hazardous waste)) Business SIC classification: DRYCLEANING PLANTS, EXCEPT RUG CLEANING Business NAICS classification: DRYCLEANING AND LAUNDRY SERVICES (EXCEPT COIN-OPERATED). Organizations: YONG HO KIM (LEGALLY RESPONSIBLE PARTY)
10 PAXTON PARTNERS LP (10 PAXTON AVE - PARKING LOT in BRONXVILLE, NY)
(Resource Conservation and Recovery Act (tracking hazardous waste)) Alternative names: SMITH CAIRNS MOTOR SALES CO INC
CHURCH OF ST JOSEPH (29 MEADOW AVE in BRONXVILLE, NY)
HAZARDOUS WASTE BIENNIAL REPORTER (Resource Conservation and Recovery Act (tracking hazardous waste)) Large Quantity Generators, more that 1000 kg of hazardous waste/month (Resource Conservation and Recovery Act (tracking hazardous waste)) - notification
GM108 (49 WELLYN ROAD in YONKERS, NY)
HAZARDOUS WASTE BIENNIAL REPORTER (Resource Conservation and Recovery Act (tracking hazardous waste)) (Resource Conservation and Recovery Act (tracking hazardous waste))
HAMILTON CLEANERS (5 PARK PL in BRONXVILLE, NY)
AIR MINOR (AIRS/AFS) Small Quantity Generators, between 100 kg and 1000 kg of hazardous waste/month (Resource Conservation and Recovery Act (tracking hazardous waste)) Business SIC classification: DRYCLEANING PLANTS, EXCEPT RUG CLEANING
CON ED - LAWRENCE PK 44 & PALMER RD (LAWRENCE PARK 44 & PALMER RD in BRONXVILLE, NY)
HAZARDOUS WASTE BIENNIAL REPORTER (Resource Conservation and Recovery Act (tracking hazardous waste)) (Resource Conservation and Recovery Act (tracking hazardous waste))
CON ED - MH 4299 (PALMER RD & PAXTON AVE in BRONXVILLE, NY)
HAZARDOUS WASTE BIENNIAL REPORTER (Resource Conservation and Recovery Act (tracking hazardous waste)) (Resource Conservation and Recovery Act (tracking hazardous waste))
CON ED - NEW ROCHELLE RD & OREGON RD (NEW ROCHELLE RD & OREGON RD in EASTCHESTER, NY)
HAZARDOUS WASTE BIENNIAL REPORTER (Resource Conservation and Recovery Act (tracking hazardous waste)) (Resource Conservation and Recovery Act (tracking hazardous waste))
CON ED - V 1466 (MEADOW AVE W/O PONFIELD RD in BRONXVILLE, NY)
HAZARDOUS WASTE BIENNIAL REPORTER (Resource Conservation and Recovery Act (tracking hazardous waste)) (Resource Conservation and Recovery Act (tracking hazardous waste))
HUPALO RESIDENCE (13 SUNNY BREE PL in BRONXVILLE, NY)
Conditionally Exempt Small Quantity Generators, less than 100 kg/month of hazardous waste (Resource Conservation and Recovery Act (tracking hazardous waste)) - notification Organizations: MR & MRS HUPALO (CONTACT/OWNER)
H&S PROPERTY MANAGEMENT, INC (1101 MIDLAND AVE in BRONXVILLE, NY)
COMPLIANCE ACTIVITY (Tracking inspections of insecticide, fungicide, and rodenticide, and toxic substances)
Housing units lacking complete plumbing facilities: 0.2% Housing units lacking complete kitchen facilities: 0.2%
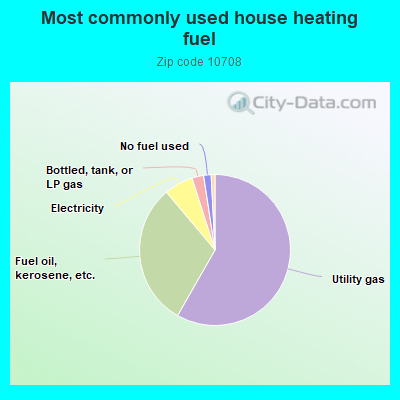
58.2%Utility gas
30.6%Fuel oil, kerosene, etc.
6.2%Electricity
2.5%Bottled, tank, or LP gas
1.6%No fuel used
0.8%Other fuel
Population in 1990: 20,406. Population change in the 1990s: +2,005 (+9.8%).
Place of birth for U.S.-born residents:
This state: 14,303
Northeast: 1,538
Midwest: 816
South: 910
West: 643
61% of the 10708 zip code residents lived in the same house 5 years ago. Out of people who lived in different houses, 48% lived in this county. Out of people who lived in different counties, 50% lived in New York.
92% of the 10708 zip code residents lived in the same house 1 year ago. Out of people who lived in different houses, 35% moved from this county. Out of people who lived in different houses, 45% moved from different county within same state. Out of people who lived in different houses, 18% moved from different state. Out of people who lived in different houses, 3% moved from abroad.
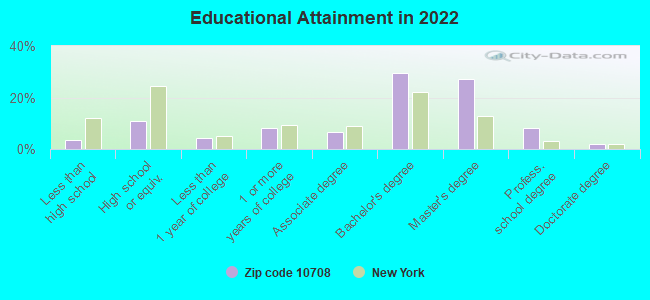
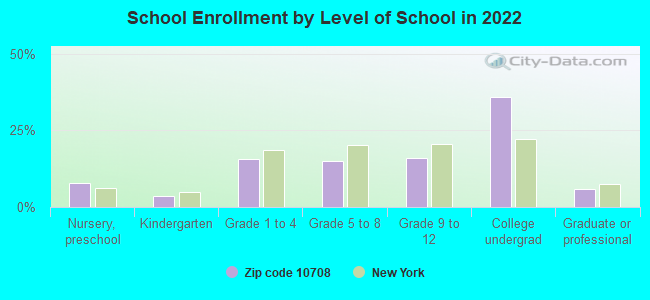
Private vs. public school enrollment:
Students in private schools in grades 1 to 8 (elementary and middle school): 187
Here:
10.6%
New York:
15.6%
Students in private schools in grades 9 to 12 (high school): 255
Here:
27.4%
New York:
15.0%
Students in private undergraduate colleges: 1,646
Here:
77.6%
New York:
39.2%
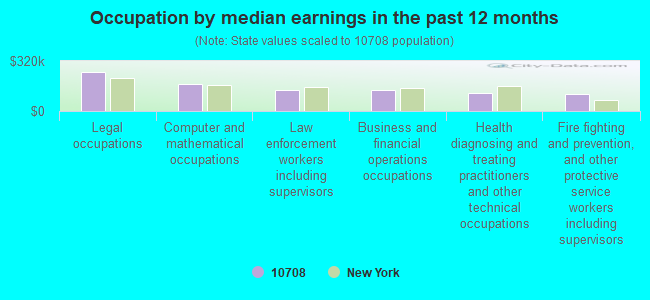
Occupation by median earnings in the past 12 months ($)
247,483Legal occupations
171,675Computer and mathematical occupations
136,040Law enforcement workers including supervisors
134,936Business and financial operations occupations
112,835Health diagnosing and treating practitioners and other technical occupations
111,304Fire fighting and prevention, and other protective service workers including supervisors
Companies with federal contracts located in this zip code:
PAUL SUNKES (15 BEECH TREE LANE in BRONXVILLE, NY; small business) : $209,849 in 9 contractsfrom 2004 to 2006
Contracts for Personal Services Contracts by Departmental Offices Signed by year:2000: $0; 2001: $0; 2002: $0; 2003: $0; 2004: $67,008; 2005: $92,128; 2006: $50,713.
Biggest contracts:
$48,116 with Departmental Offices for Personal Services Contracts. Taking place in DC. Signed on 2005-02-22. Effective on 2005-02-27. Completion date: 2006-02-26.
$38,493, same as above.Signed on 2005-12-02. Completion date: 2009-02-26.
$38,473, same as above.Signed on 2006-04-24. Completion date: 2009-02-26.
$29,885, same as above.Signed on 2004-04-23. Completion date: 2005-02-26.
HARRY R. TETHER (37 SUMMIT AVENUE in BRONXVILLE, NY; small business) : $62,145 in 4 contractsfrom 2004 to 2006
$48,069 with Departmental Offices for Personal Services Contracts. Taking place in DC. Signed on 2005-09-13. Completion date: 2006-06-20.
$44,396, same as above.Signed on 2004-06-21. Completion date: 2005-06-20.
$195, same as above.Signed on 2006-06-21. Completion date: 2007-06-20.
-$30,515, same as above.Signed on 2005-06-22. Completion date: 2006-06-20.
SARAH LAWRENCE COLLEGE (1 MEAD WAY in BRONXVILLE, NY)
$3,200 with Army for Lectures For Training. Taking place in PA. Signed on 2005-05-03. Completion date: 2005-03-23.
Top industries in this zip code by the number of employees in 2005:
Educational Services: Colleges, Universities, and Professional Schools (over 1000 employees: 1 establishment, 250-499 employees: 1 establishment)
Health Care and Social Assistance: General Medical and Surgical Hospitals (over 1000: 1)
Administrative and Support and Waste Management and Remediation Services: Temporary Help Services (500-999: 1, 50-99: 1)
Health Care and Social Assistance: Offices of Physicians (except Mental Health Specialists) (10-19: 4, 5-9: 20, 1-4: 27)
Other Services (except Public Administration): Religious Organizations (50-99: 2, 20-49: 1, 10-19: 1, 5-9: 1, 1-4: 5)
Other Services (except Public Administration): Other Similar Organizations (except Business, Professional, Labor, and Political Organizations) (20-49: 1, 10-19: 1, 5-9: 7, 1-4: 38)
Administrative and Support and Waste Management and Remediation Services: Janitorial Services (100-249: 1, 1-4: 2)
Real Estate and Rental and Leasing: Lessors of Residential Buildings and Dwellings (5-9: 10, 1-4: 32)
People in group quarters in 2010:
1,223 people in college/university student housing
16 people in workers' group living quarters and job corps centers
6 people in group homes intended for adults
People in group quarters in 2000:
888 people in college dormitories (includes college quarters off campus)
20 people in homes for the mentally retarded
4 people in religious group quarters
Fatal accident statistics in 2013:
Fatal accident count: 2
Vehicles involved in fatal accidents: 6
Fatal accidents caused by drunken drivers: 0
Fatalities: 2
Persons involved in fatal accidents: 4
Pedestrians involved in fatal accidents: 1
Fatal accident statistics in 2011:
Fatal accident count: 1
Vehicles involved in fatal accidents: 1
Fatal accidents caused by drunken drivers: 0
Fatalities: 1
Persons involved in fatal accidents: 1
Pedestrians involved in fatal accidents: 1
Home Mortgage Disclosure Act Aggregated Statistics For Year 2009 (Based on 10 full and 6 partial tracts)
A) FHA, FSA/RHS & VA Home Purchase Loans
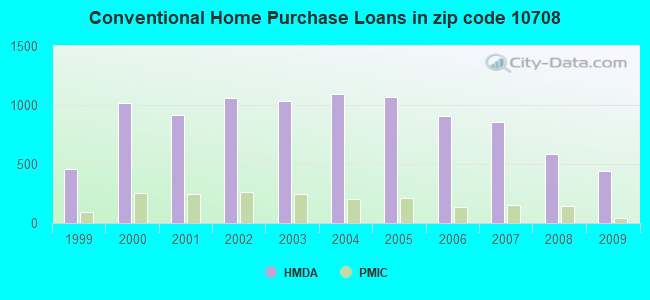
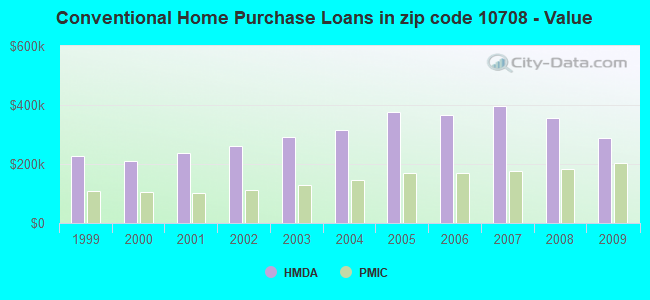
B) Conventional Home Purchase Loans
C) Refinancings
D) Home Improvement Loans
E) Loans on Dwellings For 5+ Families
F) Non-occupant Loans on < 5 Family Dwellings (A B C & D)
Number
Average Value
Number
Average Value
Number
Average Value
Number
Average Value
Number
Average Value
Number
Average Value
LOANS ORIGINATED
18
$483,375
441
$289,374
595
$314,758
15
$179,794
8
$2,517,911
15
$247,329
APPLICATIONS APPROVED, NOT ACCEPTED
4
$348,465
47
$446,546
83
$411,656
3
$18,437
2
$1,815,180
3
$485,223
APPLICATIONS DENIED
10
$366,963
107
$202,889
260
$358,536
21
$124,592
1
$110,970
11
$331,887
APPLICATIONS WITHDRAWN
2
$206,565
49
$246,331
144
$397,876
7
$438,586
0
$0
8
$247,950
FILES CLOSED FOR INCOMPLETENESS
1
$474,210
19
$282,207
45
$297,442
2
$145,750
0
$0
2
$499,950
Aggregated Statistics For Year 2008 (Based on 10 full and 6 partial tracts)
A) FHA, FSA/RHS & VA Home Purchase Loans
B) Conventional Home Purchase Loans
C) Refinancings
D) Home Improvement Loans
E) Loans on Dwellings For 5+ Families
F) Non-occupant Loans on < 5 Family Dwellings (A B C & D)
Number
Average Value
Number
Average Value
Number
Average Value
Number
Average Value
Number
Average Value
Number
Average Value
LOANS ORIGINATED
1
$693,810
586
$356,567
196
$321,194
42
$286,880
14
$829,267
29
$292,629
APPLICATIONS APPROVED, NOT ACCEPTED
0
$0
103
$384,980
58
$378,439
10
$162,864
0
$0
4
$146,578
APPLICATIONS DENIED
5
$388,050
143
$305,972
153
$344,545
26
$112,908
2
$248,900
14
$190,693
APPLICATIONS WITHDRAWN
3
$269,610
33
$261,785
64
$390,009
2
$416,960
0
$0
7
$377,434
FILES CLOSED FOR INCOMPLETENESS
0
$0
32
$365,787
31
$368,054
2
$33,275
0
$0
1
$386,920
Aggregated Statistics For Year 2007 (Based on 10 full and 6 partial tracts)
A) FHA, FSA/RHS & VA Home Purchase Loans
B) Conventional Home Purchase Loans
C) Refinancings
D) Home Improvement Loans
E) Loans on Dwellings For 5+ Families
F) Non-occupant Loans on < 5 Family Dwellings (A B C & D)
G) Loans On Manufactured Home Dwelling (A B C & D)
Number
Average Value
Number
Average Value
Number
Average Value
Number
Average Value
Number
Average Value
Number
Average Value
Number
Average Value
LOANS ORIGINATED
1
$190,870
855
$396,391
354
$428,842
43
$218,770
19
$1,496,899
25
$1,029,440
0
$0
APPLICATIONS APPROVED, NOT ACCEPTED
2
$349,965
181
$358,816
102
$374,458
22
$124,511
2
$6,780
1
$342,530
0
$0
APPLICATIONS DENIED
2
$136,615
168
$336,685
169
$447,168
85
$147,688
2
$4,845
28
$384,693
4
$73,568
APPLICATIONS WITHDRAWN
0
$0
58
$284,894
61
$474,081
6
$157,630
0
$0
1
$770,120
0
$0
FILES CLOSED FOR INCOMPLETENESS
0
$0
39
$277,669
46
$292,688
2
$236,080
0
$0
0
$0
0
$0
Aggregated Statistics For Year 2006 (Based on 10 full and 6 partial tracts)
B) Conventional Home Purchase Loans
C) Refinancings
D) Home Improvement Loans
E) Loans on Dwellings For 5+ Families
F) Non-occupant Loans on < 5 Family Dwellings (A B C & D)
Number
Average Value
Number
Average Value
Number
Average Value
Number
Average Value
Number
Average Value
LOANS ORIGINATED
910
$364,958
400
$333,222
72
$174,181
41
$1,213,802
42
$347,244
APPLICATIONS APPROVED, NOT ACCEPTED
154
$397,239
82
$385,071
20
$105,611
0
$0
9
$208,193
APPLICATIONS DENIED
149
$376,159
169
$362,065
49
$94,213
0
$0
19
$323,908
APPLICATIONS WITHDRAWN
106
$474,112
160
$351,322
7
$74,550
0
$0
8
$670,659
FILES CLOSED FOR INCOMPLETENESS
38
$374,405
49
$378,029
2
$125,955
0
$0
0
$0
Aggregated Statistics For Year 2005 (Based on 10 full and 6 partial tracts)
A) FHA, FSA/RHS & VA Home Purchase Loans
B) Conventional Home Purchase Loans
C) Refinancings
D) Home Improvement Loans
E) Loans on Dwellings For 5+ Families
F) Non-occupant Loans on < 5 Family Dwellings (A B C & D)
Number
Average Value
Number
Average Value
Number
Average Value
Number
Average Value
Number
Average Value
Number
Average Value
LOANS ORIGINATED
2
$247,905
1,071
$375,967
512
$294,856
65
$161,920
14
$1,434,017
48
$365,191
APPLICATIONS APPROVED, NOT ACCEPTED
0
$0
132
$315,101
83
$324,930
17
$120,093
0
$0
3
$345,737
APPLICATIONS DENIED
0
$0
169
$308,376
210
$363,550
63
$142,112
1
$63,620
17
$180,167
APPLICATIONS WITHDRAWN
0
$0
98
$343,815
185
$355,721
27
$302,931
0
$0
15
$523,507
FILES CLOSED FOR INCOMPLETENESS
0
$0
48
$326,340
24
$418,168
4
$149,770
0
$0
2
$131,770
Aggregated Statistics For Year 2004 (Based on 10 full and 6 partial tracts)
A) FHA, FSA/RHS & VA Home Purchase Loans
B) Conventional Home Purchase Loans
C) Refinancings
D) Home Improvement Loans
E) Loans on Dwellings For 5+ Families
F) Non-occupant Loans on < 5 Family Dwellings (A B C & D)
G) Loans On Manufactured Home Dwelling (A B C & D)
Number
Average Value
Number
Average Value
Number
Average Value
Number
Average Value
Number
Average Value
Number
Average Value
Number
Average Value
LOANS ORIGINATED
0
$0
1,091
$315,312
600
$315,490
51
$252,198
19
$1,570,559
45
$281,160
0
$0
APPLICATIONS APPROVED, NOT ACCEPTED
0
$0
122
$269,486
111
$237,908
17
$46,912
0
$0
8
$228,471
0
$0
APPLICATIONS DENIED
3
$277,250
158
$327,531
255
$311,819
41
$177,740
0
$0
14
$183,919
1
$110,970
APPLICATIONS WITHDRAWN
4
$241,255
92
$286,962
158
$320,190
7
$161,196
0
$0
3
$138,080
0
$0
FILES CLOSED FOR INCOMPLETENESS
1
$189,880
21
$406,050
61
$356,449
2
$24,995
0
$0
1
$346,560
0
$0
Aggregated Statistics For Year 2003 (Based on 10 full and 6 partial tracts)
B) Conventional Home Purchase Loans
C) Refinancings
D) Home Improvement Loans
E) Loans on Dwellings For 5+ Families
F) Non-occupant Loans on < 5 Family Dwellings (A B C & D)
Number
Average Value
Number
Average Value
Number
Average Value
Number
Average Value
Number
Average Value
LOANS ORIGINATED
1,033
$291,566
1,617
$287,153
38
$88,880
6
$2,033,317
51
$227,118
APPLICATIONS APPROVED, NOT ACCEPTED
119
$283,618
264
$304,833
19
$141,202
0
$0
7
$397,003
APPLICATIONS DENIED
149
$237,760
316
$314,488
46
$41,341
0
$0
16
$246,042
APPLICATIONS WITHDRAWN
85
$268,368
214
$307,819
4
$57,642
0
$0
5
$199,398
FILES CLOSED FOR INCOMPLETENESS
37
$260,866
54
$335,464
7
$48,424
0
$0
0
$0
Aggregated Statistics For Year 2002 (Based on 10 full and 6 partial tracts)
A) FHA, FSA/RHS & VA Home Purchase Loans
B) Conventional Home Purchase Loans
C) Refinancings
D) Home Improvement Loans
E) Loans on Dwellings For 5+ Families
F) Non-occupant Loans on < 5 Family Dwellings (A B C & D)
Number
Average Value
Number
Average Value
Number
Average Value
Number
Average Value
Number
Average Value
Number
Average Value
LOANS ORIGINATED
2
$159,870
1,063
$262,191
1,003
$326,124
59
$104,115
8
$3,133,491
28
$211,217
APPLICATIONS APPROVED, NOT ACCEPTED
0
$0
152
$300,476
198
$296,496
8
$75,879
0
$0
15
$155,799
APPLICATIONS DENIED
0
$0
138
$222,256
210
$273,724
43
$44,236
0
$0
3
$84,380
APPLICATIONS WITHDRAWN
0
$0
92
$271,862
220
$299,864
15
$57,466
0
$0
6
$217,022
FILES CLOSED FOR INCOMPLETENESS
0
$0
24
$193,825
64
$263,622
0
$0
0
$0
0
$0
Aggregated Statistics For Year 2001 (Based on 10 full and 6 partial tracts)
A) FHA, FSA/RHS & VA Home Purchase Loans
B) Conventional Home Purchase Loans
C) Refinancings
D) Home Improvement Loans
E) Loans on Dwellings For 5+ Families
F) Non-occupant Loans on < 5 Family Dwellings (A B C & D)
Number
Average Value
Number
Average Value
Number
Average Value
Number
Average Value
Number
Average Value
Number
Average Value
LOANS ORIGINATED
5
$216,020
918
$238,064
630
$286,800
57
$83,979
8
$2,240,100
28
$354,864
APPLICATIONS APPROVED, NOT ACCEPTED
0
$0
96
$334,563
111
$410,765
31
$108,594
0
$0
3
$34,967
APPLICATIONS DENIED
0
$0
111
$289,723
170
$278,005
50
$55,166
0
$0
5
$185,734
APPLICATIONS WITHDRAWN
1
$89,520
85
$261,714
141
$251,665
10
$50,095
0
$0
6
$229,275
FILES CLOSED FOR INCOMPLETENESS
0
$0
33
$444,831
43
$233,280
5
$30,370
0
$0
0
$0
Aggregated Statistics For Year 2000 (Based on 10 full and 6 partial tracts)
A) FHA, FSA/RHS & VA Home Purchase Loans
B) Conventional Home Purchase Loans
C) Refinancings
D) Home Improvement Loans
E) Loans on Dwellings For 5+ Families
F) Non-occupant Loans on < 5 Family Dwellings (A B C & D)
Number
Average Value
Number
Average Value
Number
Average Value
Number
Average Value
Number
Average Value
Number
Average Value
LOANS ORIGINATED
3
$259,103
1,015
$210,575
180
$203,099
81
$123,982
2
$2,330,695
16
$95,452
APPLICATIONS APPROVED, NOT ACCEPTED
0
$0
104
$241,595
38
$279,588
27
$104,709
0
$0
10
$143,948
APPLICATIONS DENIED
0
$0
164
$164,485
109
$290,560
27
$36,327
2
$991,500
7
$49,543
APPLICATIONS WITHDRAWN
5
$138,816
79
$231,413
86
$190,272
8
$149,286
4
$786,420
0
$0
FILES CLOSED FOR INCOMPLETENESS
0
$0
44
$224,896
11
$469,786
13
$60,410
0
$0
2
$73,845
Aggregated Statistics For Year 1999 (Based on 5 full and 3 partial tracts)
A) FHA, FSA/RHS & VA Home Purchase Loans
B) Conventional Home Purchase Loans
C) Refinancings
D) Home Improvement Loans
E) Loans on Dwellings For 5+ Families
F) Non-occupant Loans on < 5 Family Dwellings (A B C & D)
2003 - 2018 National Fire Incident Reporting System (NFIRS) incidents
According to the data from the years 2003 - 2018 the average number of fires per year is 67. The highest number of reported fire incidents - 126 took place in 2018, and the least - 0 in 2004. The data has a growing trend.
When looking into fire subcategories, the most incidents belonged to: Structure Fires (79.0%), and Outside Fires (8.4%).
Fire incident types reported to NFIRS in Zip Code 10708


 Nearest zip codes: 10552, 10707, 10709, 10553, 10710, 10550.


 According to the data from the years 2003 - 2018 the average number of fires per year is 67. The highest number of reported fire incidents - 126 took place in 2018, and the least - 0 in 2004. The data has a growing trend.
 When looking into fire subcategories, the most incidents belonged to: Structure Fires (79.0%), and Outside Fires (8.4%).