Estimated zip code population in 2022: 25,684 Zip code population in 2010: 25,120 Zip code population in 2000: 25,202
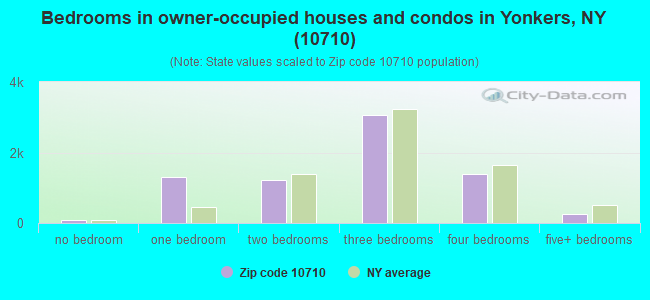
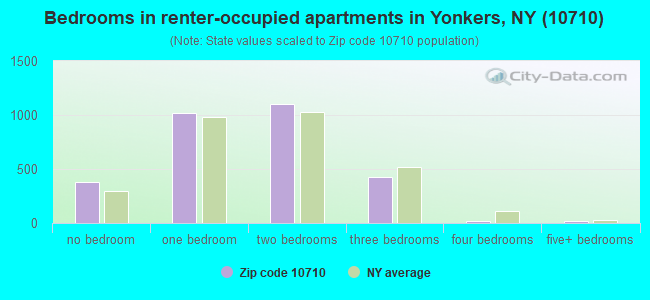
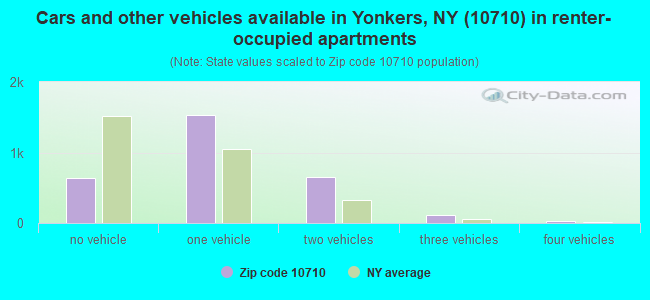
Houses and condos: 10,423 Renter-occupied apartments: 2,955
% of renters here:
29%
State:
46%
March 2022 cost of living index in zip code 10710: 148.3 (very high, U.S. average is 100)
Land area: 4.6 sq. mi. Water area: 0.3 sq. mi.
Population density: 5,607 people per square mile
(average).
OSM Map
General Map
Google Map
MSN Map
OSM Map
General Map
Google Map
MSN Map
OSM Map
General Map
Google Map
MSN Map
OSM Map
General Map
Google Map
MSN Map
Please wait while loading the map...
Real estate property taxes paid for housing units in 2022:
This zip code:
1.8% ($9,805)
New York:
1.5% ($6,180)
Median real estate property taxes paid for housing units with mortgages in 2022: $9,858 (1.7%) Median real estate property taxes paid for housing units with no mortgage in 2022: $8,270 (1.9%)
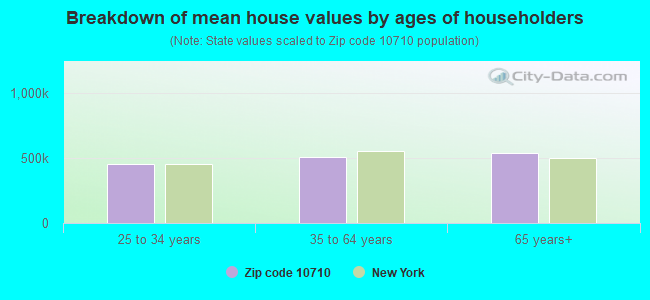
Estimated median house/condo value in 2022: $533,206
10710:
$533,206
New York:
$400,400
According to our research of New York and other state lists, there were 9 registered sex offenders living in 10710 zip code as of April 27, 2024. The ratio of all residents to sex offenders in zip code 10710 is 3,111 to 1. The ratio of registered sex offenders to all residents in this zip code is much lower than the state average.
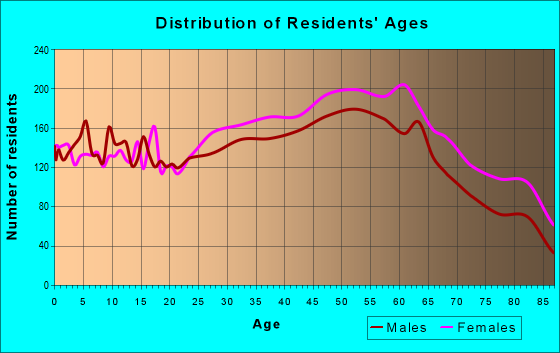
Median resident age:
This zip code:
45.5 years
New York median age:
40.0 years
Average household size:
This zip code:
2.5 people
New York:
2.5 people
Averages for the 2020 tax year for zip code 10710, filed in 2021:
Average Adjusted Gross Income (AGI) in 2020: $83,088 (Individual Income Tax Returns)
Here:
$83,088
State:
$90,930
Salary/wage: $74,960 (reported on 79.1% of returns)
Here:
$74,960
State:
$72,104
(% of AGI for various income ranges: 1042.7% for AGIs below $25k, 3594.1% for AGIs $25k-50k, 6913.0% for AGIs $50k-75k, 9903.1% for AGIs $75k-100k, 18323.8% for AGIs $100k-200k, 67347.3% for AGIs over 200k)
Taxable interest for individuals: $1,530 (reported on 39.5% of returns)
This zip code:
$1,530
New York:
$3,075
(% of AGI for various income ranges: 38.1% for AGIs below $25k, 41.2% for AGIs $25k-50k, 55.0% for AGIs $50k-75k, 89.4% for AGIs $75k-100k, 153.9% for AGIs $100k-200k, 765.2% for AGIs over 200k)
Ordinary dividends: $6,005 (reported on 23.6% of returns)
Here:
$6,005
State:
$11,095
(% of AGI for various income ranges: 40.1% for AGIs below $25k, 54.3% for AGIs $25k-50k, 77.4% for AGIs $50k-75k, 189.7% for AGIs $75k-100k, 331.9% for AGIs $100k-200k, 2840.3% for AGIs over 200k)
Net capital gain/loss in AGI: +$12,669 (reported on 21.4% of returns)
Here:
+$12,669
State:
+$44,925
(% of AGI for various income ranges: 12.2% for AGIs below $25k, 43.8% for AGIs $25k-50k, 68.6% for AGIs $50k-75k, 153.5% for AGIs $75k-100k, 423.4% for AGIs $100k-200k, 8480.6% for AGIs over 200k)
Profit/loss from business: +$11,072 (reported on 14.4% of returns)
Here:
+$11,072
State:
+$14,940
(% of AGI for various income ranges: 131.6% for AGIs below $25k, 164.5% for AGIs $25k-50k, 130.9% for AGIs $50k-75k, 109.8% for AGIs $75k-100k, 276.8% for AGIs $100k-200k, 2663.6% for AGIs over 200k)
Taxable individual retirement arrangement distribution: $16,516 (reported on 9.0% of returns)
10710:
$16,516
New York:
$19,609
(% of AGI for various income ranges: 75.1% for AGIs below $25k, 102.8% for AGIs $25k-50k, 162.1% for AGIs $50k-75k, 259.8% for AGIs $75k-100k, 367.3% for AGIs $100k-200k, 1760.9% for AGIs over 200k)
Self-employed (Keogh) retirement plans: $24,000 (reported on 0.5% of returns)
10710:
$24,000
New York:
$32,497
(% of AGI for various income ranges: 24.5% for AGIs $100k-200k, 378.5% for AGIs over 200k)
Total itemized deductions: $27,597 (reported on 18.5% of returns)
Here:
$27,597
State:
$39,326
(% of AGI for various income ranges: 129.7% for AGIs below $25k, 266.9% for AGIs $25k-50k, 451.1% for AGIs $50k-75k, 927.9% for AGIs $75k-100k, 1715.7% for AGIs $100k-200k, 5446.1% for AGIs over 200k)
Charity contributions: $5,781 (reported on 15.4% of returns)
Here:
$5,781
State:
$15,420
(% of AGI for various income ranges: 7.0% for AGIs below $25k, 26.2% for AGIs $25k-50k, 59.7% for AGIs $50k-75k, 122.9% for AGIs $75k-100k, 299.7% for AGIs $100k-200k, 1413.3% for AGIs over 200k)
Taxes paid: $9,148 (reported on 18.3% of returns)
10710:
$9,148
State:
$9,183
(% of AGI for various income ranges: 41.3% for AGIs below $25k, 80.1% for AGIs $25k-50k, 149.2% for AGIs $50k-75k, 322.0% for AGIs $75k-100k, 598.3% for AGIs $100k-200k, 1579.4% for AGIs over 200k)
Earned income credit: $1,916 (reported on 8.8% of returns)
Here:
$1,916
State:
$2,138
(% of AGI for various income ranges: 69.1% for AGIs below $25k, 47.9% for AGIs $25k-50k)
Percentage of individuals using paid preparers for their 2020 taxes: 94.1%
Here:
94%
State:
95%
(% for various income ranges: 92.9% for AGIs below $25k, 93.8% for AGIs $25k-50k, 94.4% for AGIs $50k-75k, 94.9% for AGIs $75k-100k, 94.9% for AGIs $100k-200k, 95.1% for AGIs over 200k)
Averages for the 2012 tax year for zip code 10710, filed in 2013:
Average Adjusted Gross Income (AGI) in 2012: $72,652 (Individual Income Tax Returns)
Here:
$72,652
State:
$77,088
Salary/wage: $65,698 (reported on 81.7% of returns)
Here:
$65,698
State:
$60,593
(% of AGI for various income ranges: 63.1% for AGIs below $25k, 75.4% for AGIs $25k-50k, 78.1% for AGIs $50k-75k, 77.8% for AGIs $75k-100k, 78.0% for AGIs $100k-200k, 63.1% for AGIs over 200k)
Taxable interest for individuals: $1,502 (reported on 46.8% of returns)
This zip code:
$1,502
New York:
$3,125
(% of AGI for various income ranges: 2.2% for AGIs below $25k, 1.3% for AGIs $25k-50k, 1.3% for AGIs $50k-75k, 0.7% for AGIs $75k-100k, 0.8% for AGIs $100k-200k, 0.9% for AGIs over 200k)
Ordinary dividends: $4,503 (reported on 25.7% of returns)
Here:
$4,503
State:
$10,299
(% of AGI for various income ranges: 2.7% for AGIs below $25k, 1.5% for AGIs $25k-50k, 1.7% for AGIs $50k-75k, 1.1% for AGIs $75k-100k, 1.3% for AGIs $100k-200k, 2.1% for AGIs over 200k)
Net capital gain/loss in AGI: +$6,091 (reported on 20.1% of returns)
Here:
+$6,091
State:
+$42,474
(% of AGI for various income ranges: 0.3% for AGIs $75k-100k, 0.8% for AGIs $100k-200k, 6.6% for AGIs over 200k)
Profit/loss from business: +$12,820 (reported on 13.6% of returns)
Here:
+$12,820
State:
+$16,168
(% of AGI for various income ranges: 9.2% for AGIs below $25k, 2.0% for AGIs $25k-50k, 1.1% for AGIs $50k-75k, 1.4% for AGIs $75k-100k, 2.1% for AGIs $100k-200k, 3.3% for AGIs over 200k)
Taxable individual retirement arrangement distribution: $13,837 (reported on 11.8% of returns)
10710:
$13,837
New York:
$17,621
(% of AGI for various income ranges: 4.3% for AGIs below $25k, 2.9% for AGIs $25k-50k, 2.1% for AGIs $50k-75k, 1.8% for AGIs $75k-100k, 2.2% for AGIs $100k-200k, 1.9% for AGIs over 200k)
Self-employment retirement plans: $22,075 (reported on 0.6% of returns)
10710:
$22,075
New York:
$27,330
Total itemized deductions: $26,867 (25% of AGI, reported on 52.9% of returns)
Here:
$26,867
State:
$34,985
Here:
24.7% of AGI
State:
21.3% of AGI
(% of AGI for various income ranges: 17.1% for AGIs below $25k, 17.0% for AGIs $25k-50k, 19.9% for AGIs $50k-75k, 20.9% for AGIs $75k-100k, 21.4% for AGIs $100k-200k, 17.2% for AGIs over 200k)
Charity contributions: $2,930 (reported on 46.9% of returns)
Here:
$2,930
State:
$5,572
(% of AGI for various income ranges: 0.9% for AGIs below $25k, 1.8% for AGIs $25k-50k, 2.0% for AGIs $50k-75k, 2.0% for AGIs $75k-100k, 2.1% for AGIs $100k-200k, 1.7% for AGIs over 200k)
Taxes paid: $12,772 (reported on 52.7% of returns)
10710:
$12,772
State:
$18,656
(% of AGI for various income ranges: 5.8% for AGIs below $25k, 6.3% for AGIs $25k-50k, 7.9% for AGIs $50k-75k, 9.2% for AGIs $75k-100k, 10.5% for AGIs $100k-200k, 10.3% for AGIs over 200k)
Earned income credit: $1,941 (reported on 9.1% of returns)
Here:
$1,941
State:
$2,230
(% of AGI for various income ranges: 4.1% for AGIs below $25k, 0.5% for AGIs $25k-50k)
Percentage of individuals using paid preparers for their 2012 taxes: 71.5%
Here:
72%
State:
66%
(% for various income ranges: 66.2% for AGIs below $25k, 67.2% for AGIs $25k-50k, 71.2% for AGIs $50k-75k, 77.2% for AGIs $75k-100k, 78.8% for AGIs $100k-200k, 78.7% for AGIs over 200k)
Averages for the 2004 tax year for zip code 10710, filed in 2005:
Average Adjusted Gross Income (AGI) in 2004: $58,478 (Individual Income Tax Returns)
Here:
$58,478
State:
$59,519
Salary/wage: $55,060 (reported on 80.6% of returns)
Here:
$55,060
State:
$50,673
(% of AGI for various income ranges: 121.4% for AGIs below $10k, 62.8% for AGIs $10k-25k, 77.8% for AGIs $25k-50k, 78.8% for AGIs $50k-75k, 79.9% for AGIs $75k-100k, 73.3% for AGIs over 100k)
Taxable interest for individuals: $1,677 (reported on 64.2% of returns)
This zip code:
$1,677
New York:
$2,377
(% of AGI for various income ranges: 14.8% for AGIs below $10k, 5.2% for AGIs $10k-25k, 2.3% for AGIs $25k-50k, 1.5% for AGIs $50k-75k, 1.2% for AGIs $75k-100k, 1.4% for AGIs over 100k)
Taxable dividends: $2,942 (reported on 34.9% of returns)
Here:
$2,942
State:
$5,394
(% of AGI for various income ranges: 12.3% for AGIs below $10k, 3.2% for AGIs $10k-25k, 1.6% for AGIs $25k-50k, 1.5% for AGIs $50k-75k, 1.2% for AGIs $75k-100k, 1.8% for AGIs over 100k)
Net capital gain/loss: +$5,790 (reported on 27.6% of returns)
Here:
+$5,790
State:
+$23,581
(% of AGI for various income ranges: -7.7% for AGIs below $10k, 0.5% for AGIs $10k-25k, 0.1% for AGIs $25k-50k, 0.3% for AGIs $50k-75k, 0.7% for AGIs $75k-100k, 5.7% for AGIs over 100k)
Profit/loss from business: +$13,841 (reported on 12.8% of returns)
Here:
+$13,841
State:
+$13,809
(% of AGI for various income ranges: 21.2% for AGIs below $10k, 6.6% for AGIs $10k-25k, 2.4% for AGIs $25k-50k, 2.0% for AGIs $50k-75k, 1.9% for AGIs $75k-100k, 3.4% for AGIs over 100k)
IRA payment deduction: $3,414 (reported on 4.0% of returns)
10710:
$3,414
New York:
$3,115
(% of AGI for various income ranges: 0.6% for AGIs below $10k, 0.3% for AGIs $10k-25k, 0.4% for AGIs $25k-50k, 0.3% for AGIs $50k-75k, 0.3% for AGIs $75k-100k, 0.1% for AGIs over 100k)
Self-employed pension: $13,736 (reported on 1.0% of returns)
Here:
$13,736
New York:
$19,016
(% of AGI for various income ranges: 0.2% for AGIs $10k-25k, 0.1% for AGIs $50k-75k, 0.2% for AGIs $75k-100k, 0.4% for AGIs over 100k)
Total itemized deductions: $22,044 (25% of AGI, reported on 53.6% of returns)
Here:
$22,044
State:
$25,864
Here:
25.5% of AGI
State:
21.9% of AGI
(% of AGI for various income ranges: 32.9% for AGIs below $10k, 18.5% for AGIs $10k-25k, 18.8% for AGIs $25k-50k, 21.7% for AGIs $50k-75k, 22.3% for AGIs $75k-100k, 19.3% for AGIs over 100k)
Charity contributions deductions: $2,943 (3% of AGI, reported on 50.3% of returns)
Here:
$2,943
State:
$4,439
Here:
3.3% of AGI
State:
3.6% of AGI
(% of AGI for various income ranges: 2.1% for AGIs below $10k, 1.7% for AGIs $10k-25k, 2.5% for AGIs $25k-50k, 2.8% for AGIs $50k-75k, 2.7% for AGIs $75k-100k, 2.4% for AGIs over 100k)
Total tax: $8,719 (reported on 82.2% of returns)
10710:
$8,719
State:
$11,730
(% of AGI for various income ranges: 4.8% for AGIs below $10k, 4.1% for AGIs $10k-25k, 7.4% for AGIs $25k-50k, 9.9% for AGIs $50k-75k, 10.8% for AGIs $75k-100k, 16.4% for AGIs over 100k)
Earned income credit: $1,530 (reported on 7.5% of returns)
Here:
$1,530
State:
$1,757
Percentage of individuals using paid preparers for their 2004 taxes: 70.6%
Here:
71%
State:
67%
(% for various income ranges: 65.3% for AGIs below $10k, 68.2% for AGIs $10k-25k, 69.0% for AGIs $25k-50k, 72.5% for AGIs $50k-75k, 72.8% for AGIs $75k-100k, 77.0% for AGIs over 100k)
Likely homosexual households (counted as self-reported same-sex unmarried-partner households)
Lesbian couples: 0.2% of all households
Gay men: 0.2% of all households
Household received Food Stamps/SNAP in the past 12 months: 965 Household did not receive Food Stamps/SNAP in the past 12 months: 9,220
Women who had a birth in the past 12 months: 217 (213 now married, 0 unmarried) Women who did not have a birth in the past 12 months: 4,971 (1,922 now married, 3,043 unmarried)
Housing units in zip code 10710 with a mortgage: 4,055 (510 second mortgage, 56 home equity loan, 441 both second mortgage and home equity loan) Houses without a mortgage: 135
Median monthly owner costs for units with a mortgage: $3,036 Median monthly owner costs for units without a mortgage: $1,126
Residents with income below the poverty level in 2022:
This zip code:
9.4%
Whole state:
14.3%
Residents with income below 50% of the poverty level in 2022:
This zip code:
2.8%
Whole state:
6.8%
Median number of rooms in houses and condos:
Here:
5.8
State:
6.3
Median number of rooms in apartments:
Here:
3.7
State:
3.8
Notable locations in this zip code not listed on our city pages
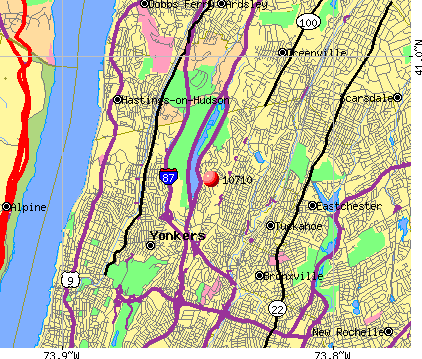
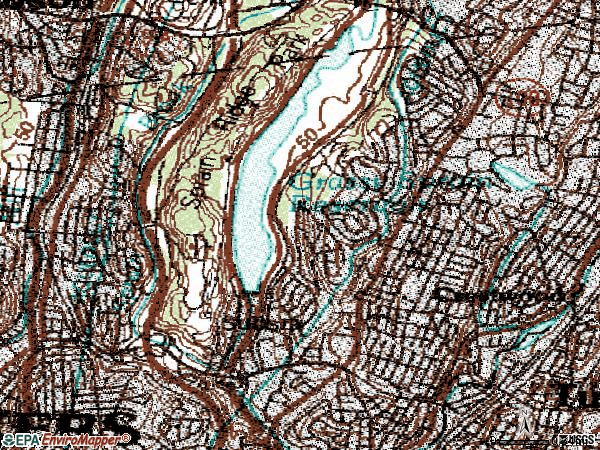
Notable locations in zip code 10710: Sprain Lake Golf Course (A), Yonkers Tennis Center (B), Yonkers Toll Bridge (C), Sprain Ridge House of Rest (D), Homecrest Home (E), Yonkers Fire Department Station 14 (F). Display/hide their locations on the map
Churches in zip code 10710 include: Asbury Crestwood United Methodist Church (A), Saint Eugene's Church (B), Saint Johns Episcopal Church (C), Christ Evangelical Lutheran Church (D). Display/hide their locations on the map
Parks in zip code 10710 include: Sprain Ridge Park (1), Rory O'Moore Parklet (2), A Z Hogan Park (3), Joseph Kardash Parklet (4), Raymond Leroy Williams Park (5). Display/hide their locations on the map
3,012 married couples with children.
1,238 single-parent households (745 men, 493 women).
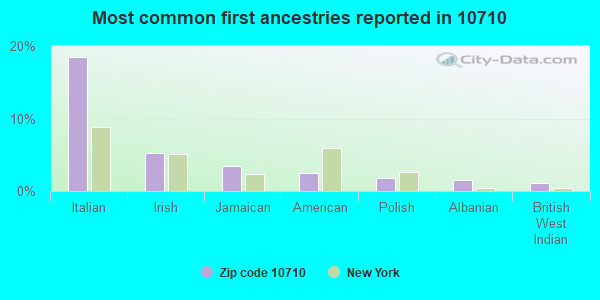
62.9% of residents of 10710 zip code speak English at home.
18.0% of residents speak Spanish at home (60% very well, 26% well, 12% not well, 1% not at all).
8.0% of residents speak other Indo-European language at home (73% very well, 24% well, 3% not well).
9.1% of residents speak Asian or Pacific Island language at home (71% very well, 25% well, 2% not well, 2% not at all).
2.5% of residents speak other language at home (76% very well, 20% well, 3% not well, 2% not at all).
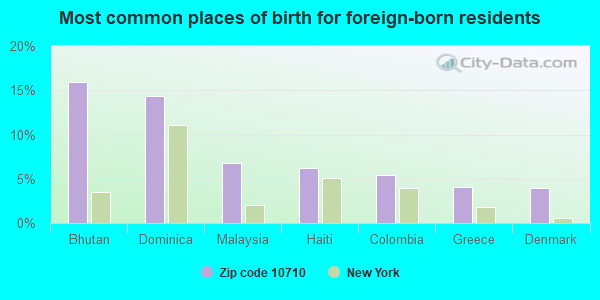
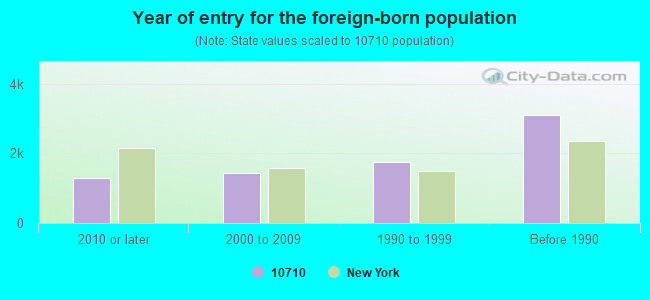
Foreign born population: 6,894 (26.8%) (73.7% of them are naturalized citizens)
Major facilities with environmental interests located in this zip code:
H & P TANGLEWOOD CLEANERS INC (2266 CENTRAL PARK AVENUE in YONKERS, NY)
AIR MINOR (AIRS/AFS) STATE MASTER (New York facility tracking) - AIR PROGRAM Small Quantity Generators, between 100 kg and 1000 kg of hazardous waste/month (Resource Conservation and Recovery Act (tracking hazardous waste)) - notification TRANSPORTER (Resource Conservation and Recovery Act (tracking hazardous waste)) - notification Business SIC classification: DRYCLEANING PLANTS, EXCEPT RUG CLEANING Business NAICS classification: DRYCLEANING AND LAUNDRY SERVICES (EXCEPT COIN-OPERATED). Organizations: HEUNG KYU PARK (CONTACT/OWNER)
GETTY SERVICE STATION (774 TUCKAHOE RD in YONKERS, NY)
STATE MASTER (New York facility tracking) - AIR PROGRAM (Resource Conservation and Recovery Act (tracking hazardous waste)) Organizations: GETTY PETROLEUM MARKETING INC (LEGALLY RESPONSIBLE PARTY)
HIGH RIDGE CLEANERS (1775 CENTRAL PARK AVE in YONKERS, NY)
AIR MINOR (AIRS/AFS) STATE MASTER (New York facility tracking) - AIR PROGRAM, HAZARDOUS WASTE PROGRAM Small Quantity Generators, between 100 kg and 1000 kg of hazardous waste/month (Resource Conservation and Recovery Act (tracking hazardous waste)) Business SIC classification: DRYCLEANING PLANTS, EXCEPT RUG CLEANING Business NAICS classification: DRYCLEANING AND LAUNDRY SERVICES (EXCEPT COIN-OPERATED).
GUS S AUTO BODY SHOP (336 SAW MILL RIVER RD in YONKERS, NY)
STATE MASTER (New York facility tracking) - AIR PROGRAM, Conditionally Exempt Small Quantity Generators, less than 100 kg/month of hazardous waste (Resource Conservation and Recovery Act (tracking hazardous waste)) - notification Organizations: GUASTAVO ALVAREZ (CONTACT/OWNER)
Alternative names: GUS AUTOBODY
CON EDISON SPRAIN BROOK SUBSTATION (TUCKAHOE ROAD & GRASSY SPRAIN ROAD in YONKERS, NY)
National Pollutant Discharge Elimination System NON-MAJOR (Tracking pollutant discharge elimination systems) - permit HAZARDOUS WASTE BIENNIAL REPORTER (Resource Conservation and Recovery Act (tracking hazardous waste)) Small Quantity Generators, between 100 kg and 1000 kg of hazardous waste/month (Resource Conservation and Recovery Act (tracking hazardous waste)) Business SIC classification: ELECTRIC AND OTHER SERVICES COMBINED Organizations: CONSOLIDATED EDISON OF NY (CONTACT/OWNER)
Alternative names: CON EDISON - SPRAIN BROOK SERVICE STA, CONSOLIDATED EDISON CHEM LAB, SPRAIN BROOK CENTRAL SUBSTA
A A ENVIRONMENTAL (68 RUNYON AVE in YONKERS, NY)
TRANSPORTER (Resource Conservation and Recovery Act (tracking hazardous waste)) USED OIL PROGRAM (Resource Conservation and Recovery Act (tracking hazardous waste)) Organizations: H PITTS (CONTACT/OPERATOR)
, BARBARA DIRENZO (CONTACT/OWNER)
GETTY PETROLEUM CORP (313 TUCKAHOE RD in YONKERS, NY)
(Resource Conservation and Recovery Act (tracking hazardous waste))
CON EDISION MH8610 (CENTRAL PARK AVENUE 515 TUCKAHOE in YONKERS, NY)
HAZARDOUS WASTE BIENNIAL REPORTER (Resource Conservation and Recovery Act (tracking hazardous waste)) Large Quantity Generators, more that 1000 kg of hazardous waste/month (Resource Conservation and Recovery Act (tracking hazardous waste)) Business NAICS classification: ELECTRIC POWER DISTRIBUTION.
CON ED - HELENA AVE & ST GEORGE PKY (HELENA AVE & ST GEORGE PKY in YONKERS, NY)
HAZARDOUS WASTE BIENNIAL REPORTER (Resource Conservation and Recovery Act (tracking hazardous waste)) (Resource Conservation and Recovery Act (tracking hazardous waste))
CON ED - MH 8486 (CENTRAL PARK AVE in YONKERS, NY)
HAZARDOUS WASTE BIENNIAL REPORTER (Resource Conservation and Recovery Act (tracking hazardous waste)) (Resource Conservation and Recovery Act (tracking hazardous waste))
CON ED-MH 2097 (GUNTHER AVE 34' WWC SMART AVE in YONKERS, NY)
HAZARDOUS WASTE BIENNIAL REPORTER (Resource Conservation and Recovery Act (tracking hazardous waste)) (Resource Conservation and Recovery Act (tracking hazardous waste))
CON ED-TM 5234 (SADORE LN in YONKERS, NY)
HAZARDOUS WASTE BIENNIAL REPORTER (Resource Conservation and Recovery Act (tracking hazardous waste)) (Resource Conservation and Recovery Act (tracking hazardous waste))
A K MEDICAL SERVICES INC (1025D SAW MILL RIVER RD in YONKERS, NY)
TRANSPORTER (Resource Conservation and Recovery Act (tracking hazardous waste)) Organizations: JAMES LEASE (CONTACT/OPERATOR)
Housing units lacking complete plumbing facilities: 0.5% Housing units lacking complete kitchen facilities: 0.3%
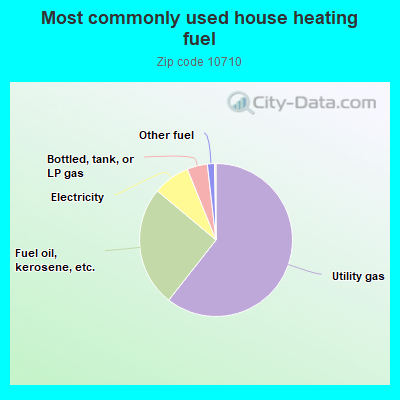
60.6%Utility gas
25.5%Fuel oil, kerosene, etc.
7.8%Electricity
4.3%Bottled, tank, or LP gas
1.5%Other fuel
Population in 1990: 24,952. Population change in the 1990s: +250 (+1.0%).
Place of birth for U.S.-born residents:
This state: 16,246
Northeast: 910
Midwest: 101
South: 525
West: 102
71% of the 10710 zip code residents lived in the same house 5 years ago. Out of people who lived in different houses, 59% lived in this county. Out of people who lived in different counties, 50% lived in New York.
93% of the 10710 zip code residents lived in the same house 1 year ago. Out of people who lived in different houses, 40% moved from this county. Out of people who lived in different houses, 38% moved from different county within same state. Out of people who lived in different houses, 16% moved from different state. Out of people who lived in different houses, 6% moved from abroad.
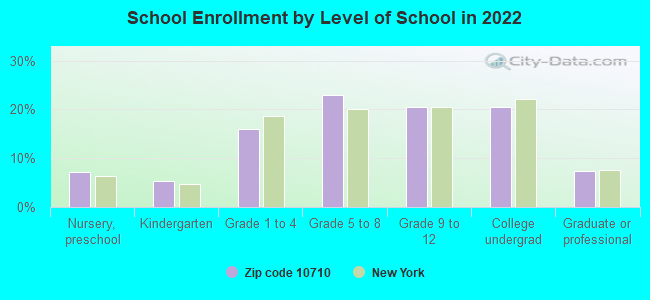
Private vs. public school enrollment:
Students in private schools in grades 1 to 8 (elementary and middle school): 341
Here:
15.8%
New York:
15.6%
Students in private schools in grades 9 to 12 (high school): 438
Here:
38.9%
New York:
15.0%
Students in private undergraduate colleges: 444
Here:
39.2%
New York:
39.2%
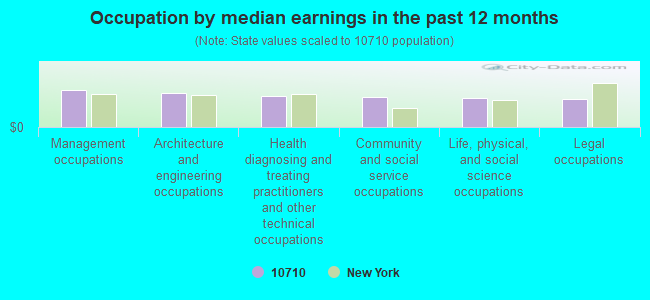
Occupation by median earnings in the past 12 months ($)
98,327Management occupations
91,379Architecture and engineering occupations
83,842Health diagnosing and treating practitioners and other technical occupations
81,651Community and social service occupations
76,781Life, physical, and social science occupations
76,100Legal occupations
Companies with federal contracts located in this zip code:
BAE SYSTEMS INFORMATION AND EL (RIDGE HILL ROAD in YONKERS, NY) : $110,581,856 in 297 contractsfrom 2001 to 2006
Contracts for Electronic Countermeasures, Counter-Countermeasures and Quick Reaction Capability Equipment, Converters, Electrical, Nonrotating, Systems Engineering Services, Miscellaneous Communication Equipment, and moreby Air Force, Defense Logistics Agency, Navy Signed by year:2000: $0; 2001: $1,526,184; 2002: $11,971,834; 2003: $24,447,948; 2004: $30,374,169; 2005: $26,514,690; 2006: $15,747,031.
Biggest contracts:
$15,088,648 with Air Force for Electronic Countermeasures, Counter-Countermeasures and Quick Reaction Capability Equipment. Signed on 2005-05-11. Completion date: 2007-04-11.
$12,269,600 with Air Force for Converters, Electrical, Nonrotating. Signed on 2004-09-20. Completion date: 2005-08-31.
$9,327,487 with Air Force for Electronic Countermeasures, Counter-Countermeasures and Quick Reaction Capability Equipment. Signed on 2006-02-24. Completion date: 2008-03-31.
$7,544,324, same as above.Signed on 2005-08-01. Completion date: 2005-08-01.
LOCKHEED MARTIN CORPORATION (RIDGE HL in YONKERS, NY) : $82,700,169 in 86 contractsfrom 1999 to 2005
Contracts for Electronic Countermeasures, Counter-Countermeasures and Quick Reaction Capability Equipment, Systems Engineering Services, Electrical and Electronic Properties Measuring and Testing Instruments, Maintenance, Repair and Rebuilding of Equipment -- Communication, Detection, and Coherent Radiation Equipment, and moreby Air Force, Navy, Defense Logistics Agency Signed by year:2000: $25,804,473; 2001: $19,826,271; 2002: $0; 2003: $0; 2004: $0; 2005: -$135,191; 2006: $0.
Biggest contracts:
$15,737,150 with Air Force for Electronic Countermeasures, Counter-Countermeasures and Quick Reaction Capability Equipment. Signed on 1999-11-03. Completion date: 2001-09-30.
$11,246,534, same as above.Signed on 1999-12-20. Completion date: 2001-07-31.
$9,186,403, same as above.Signed on 2000-09-29. Completion date: 2002-03-31.
$6,721,933 with Air Force for Systems Engineering Services. Signed on 1999-10-06. Completion date: 2001-01-31.
FISHER CONTRACTING CORP (ONE VIA TRENTA COURT in YONKERS, NY; small business)
$13,675 with Navy for Maintenance, Repair or Alteration of Real Property -- Miscellaneous Buildings. Signed on 2001-01-02. Completion date: 2001-01-31.
GOTTSCHALK, ERNEST CO INC (1051 SAW MILL RIVER ROAD in YONKERS, NY; small business)
$4,850 with Navy for Measuring Tools, Craftsmen's. Signed on 2005-03-16. Completion date: 2005-04-29.
FLANNERY, DENNIS E (PO BOX 1329 in JAKARTA, In; small business)
-$62,401 with Departmental Offices for Personal Services Contracts. Taking place in DC. Signed on 2003-03-15. Completion date: 2003-03-15.
Top industries in this zip code by the number of employees in 2005:
2002 - 2018 National Fire Incident Reporting System (NFIRS) incidents
According to the data from the years 2002 - 2018 the average number of fires per year is 76. The highest number of reported fire incidents - 190 took place in 2017, and the least - 0 in 2008. The data has a growing trend.
When looking into fire subcategories, the most incidents belonged to: Structure Fires (71.8%), and Outside Fires (15.0%).
Fire incident types reported to NFIRS in Zip Code 10710
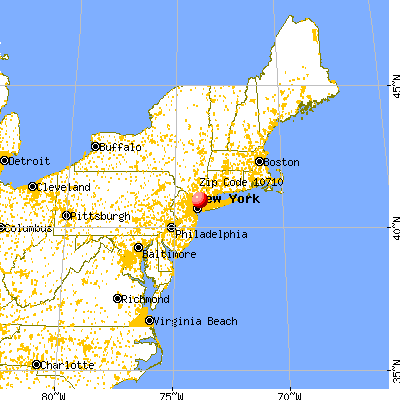


 Nearest zip codes: 10707, 10706, 10708, 10703, 10709, 10701.
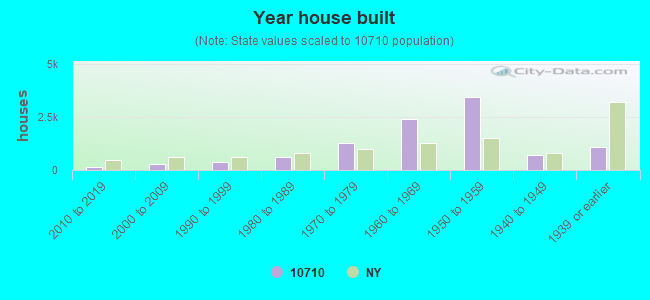


 According to the data from the years 2002 - 2018 the average number of fires per year is 76. The highest number of reported fire incidents - 190 took place in 2017, and the least - 0 in 2008. The data has a growing trend.
 When looking into fire subcategories, the most incidents belonged to: Structure Fires (71.8%), and Outside Fires (15.0%).