Estimated zip code population in 2022: 42,826 Zip code population in 2010: 40,931 Zip code population in 2000: 38,086
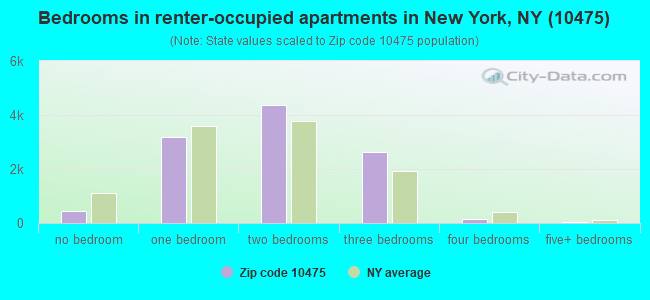
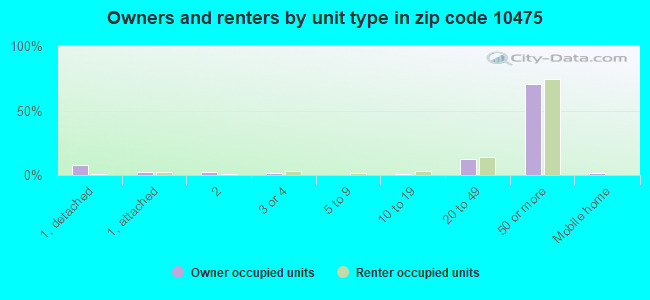
Houses and condos: 18,916 Renter-occupied apartments: 10,919
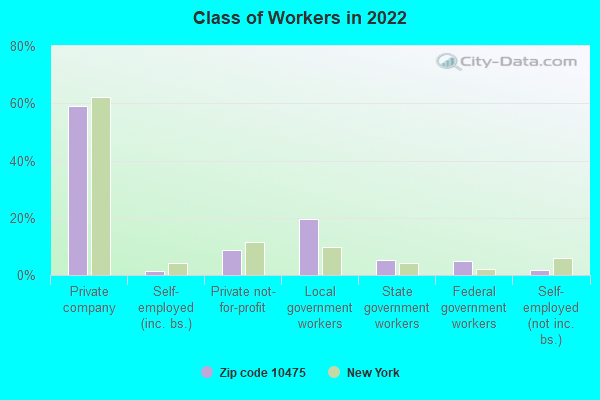
% of renters here:
58%
State:
46%
March 2022 cost of living index in zip code 10475: 136.0 (high, U.S. average is 100)
Land area: 1.7 sq. mi. Water area: 0.1 sq. mi.
Population density: 24,852 people per square mile
(very high).
OSM Map
General Map
Google Map
MSN Map
OSM Map
General Map
Google Map
MSN Map
OSM Map
General Map
Google Map
MSN Map
OSM Map
General Map
Google Map
MSN Map
Please wait while loading the map...
Real estate property taxes paid for housing units in 2022:
This zip code:
3.0% ($974)
New York:
1.5% ($6,180)
Median real estate property taxes paid for housing units with mortgages in 2022: $4,553 (1.6%) Median real estate property taxes paid for housing units with no mortgage in 2022: $842 (2.9%)
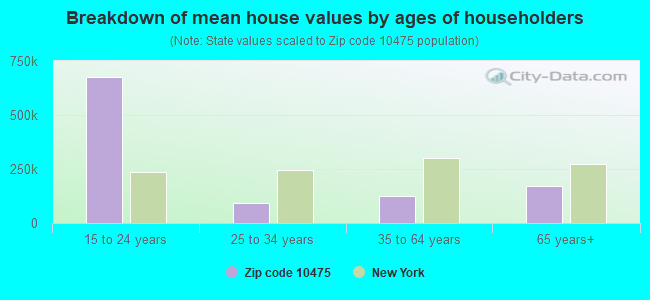
Estimated median house/condo value in 2022: $32,107
10475:
$32,107
New York:
$400,400
According to our research of New York and other state lists, there were 13 registered sex offenders living in 10475 zip code as of April 26, 2024. The ratio of all residents to sex offenders in zip code 10475 is 3,492 to 1. The ratio of registered sex offenders to all residents in this zip code is much lower than the state average.
Median resident age:
This zip code:
44.3 years
New York median age:
40.0 years
Average household size:
This zip code:
2.2 people
New York:
2.5 people
Averages for the 2020 tax year for zip code 10475, filed in 2021:
Average Adjusted Gross Income (AGI) in 2020: $51,510 (Individual Income Tax Returns)
Here:
$51,510
State:
$90,930
Salary/wage: $47,552 (reported on 79.5% of returns)
Here:
$47,552
State:
$72,104
(% of AGI for various income ranges: 867.1% for AGIs below $25k, 3448.2% for AGIs $25k-50k, 6340.7% for AGIs $50k-75k, 9497.7% for AGIs $75k-100k, 16222.9% for AGIs $100k-200k, 46416.0% for AGIs over 200k)
Taxable interest for individuals: $580 (reported on 23.2% of returns)
This zip code:
$580
New York:
$3,075
(% of AGI for various income ranges: 11.8% for AGIs below $25k, 10.1% for AGIs $25k-50k, 16.6% for AGIs $50k-75k, 33.0% for AGIs $75k-100k, 56.3% for AGIs $100k-200k, 120.0% for AGIs over 200k)
Ordinary dividends: $1,557 (reported on 9.3% of returns)
Here:
$1,557
State:
$11,095
(% of AGI for various income ranges: 8.1% for AGIs below $25k, 9.8% for AGIs $25k-50k, 15.8% for AGIs $50k-75k, 26.2% for AGIs $75k-100k, 86.9% for AGIs $100k-200k, 402.0% for AGIs over 200k)
Net capital gain/loss in AGI: +$3,082 (reported on 7.7% of returns)
Here:
+$3,082
State:
+$44,925
(% of AGI for various income ranges: 2.2% for AGIs below $25k, 12.0% for AGIs $25k-50k, 14.4% for AGIs $50k-75k, 26.9% for AGIs $75k-100k, 140.0% for AGIs $100k-200k, 3666.0% for AGIs over 200k)
Profit/loss from business: +$1,923 (reported on 10.6% of returns)
Here:
+$1,923
State:
+$14,940
(% of AGI for various income ranges: 92.0% for AGIs below $25k, 14.0% for AGIs $25k-50k, 30.1% for AGIs $100k-200k)
Taxable individual retirement arrangement distribution: $11,347 (reported on 5.6% of returns)
10475:
$11,347
New York:
$19,609
(% of AGI for various income ranges: 48.9% for AGIs below $25k, 48.8% for AGIs $25k-50k, 81.4% for AGIs $50k-75k, 154.2% for AGIs $75k-100k, 293.0% for AGIs $100k-200k)
Total itemized deductions: $23,758 (reported on 6.5% of returns)
Here:
$23,758
State:
$39,326
(% of AGI for various income ranges: 32.3% for AGIs below $25k, 89.7% for AGIs $25k-50k, 201.7% for AGIs $50k-75k, 441.8% for AGIs $75k-100k, 885.3% for AGIs $100k-200k, 3412.0% for AGIs over 200k)
Charity contributions: $8,448 (reported on 5.7% of returns)
Here:
$8,448
State:
$15,420
(% of AGI for various income ranges: 2.8% for AGIs below $25k, 20.1% for AGIs $25k-50k, 59.4% for AGIs $50k-75k, 145.6% for AGIs $75k-100k, 314.6% for AGIs $100k-200k, 1336.0% for AGIs over 200k)
Taxes paid: $7,870 (reported on 6.4% of returns)
10475:
$7,870
State:
$9,183
(% of AGI for various income ranges: 3.6% for AGIs below $25k, 21.2% for AGIs $25k-50k, 62.0% for AGIs $50k-75k, 163.2% for AGIs $75k-100k, 341.2% for AGIs $100k-200k, 742.0% for AGIs over 200k)
Earned income credit: $1,834 (reported on 12.7% of returns)
Here:
$1,834
State:
$2,138
(% of AGI for various income ranges: 72.3% for AGIs below $25k, 41.5% for AGIs $25k-50k, 0.2% for AGIs $50k-75k)
Percentage of individuals using paid preparers for their 2020 taxes: 93.8%
Here:
94%
State:
95%
(% for various income ranges: 92.6% for AGIs below $25k, 94.7% for AGIs $25k-50k, 94.9% for AGIs $50k-75k, 93.1% for AGIs $75k-100k, 92.5% for AGIs $100k-200k, 100.0% for AGIs over 200k)
Averages for the 2012 tax year for zip code 10475, filed in 2013:
Average Adjusted Gross Income (AGI) in 2012: $44,554 (Individual Income Tax Returns)
Here:
$44,554
State:
$77,088
Salary/wage: $42,724 (reported on 81.2% of returns)
Here:
$42,724
State:
$60,593
(% of AGI for various income ranges: 55.6% for AGIs below $25k, 79.3% for AGIs $25k-50k, 81.2% for AGIs $50k-75k, 81.8% for AGIs $75k-100k, 79.5% for AGIs $100k-200k, 60.5% for AGIs over 200k)
Taxable interest for individuals: $576 (reported on 29.3% of returns)
This zip code:
$576
New York:
$3,125
(% of AGI for various income ranges: 0.9% for AGIs below $25k, 0.3% for AGIs $25k-50k, 0.3% for AGIs $50k-75k, 0.3% for AGIs $75k-100k, 0.4% for AGIs $100k-200k, 0.7% for AGIs over 200k)
Ordinary dividends: $1,436 (reported on 10.3% of returns)
Here:
$1,436
State:
$10,299
(% of AGI for various income ranges: 0.6% for AGIs below $25k, 0.3% for AGIs $25k-50k, 0.3% for AGIs $50k-75k, 0.3% for AGIs $75k-100k, 0.2% for AGIs $100k-200k, 0.3% for AGIs over 200k)
Net capital gain/loss in AGI: +$22 (reported on 6.0% of returns)
Here:
+$22
State:
+$42,474
Profit/loss from business: +$4,554 (reported on 9.0% of returns)
Here:
+$4,554
State:
+$16,168
(% of AGI for various income ranges: 6.9% for AGIs below $25k, 0.4% for AGIs $25k-50k, 0.1% for AGIs $50k-75k, 0.1% for AGIs $75k-100k, 0.6% for AGIs $100k-200k)
Taxable individual retirement arrangement distribution: $9,470 (reported on 7.4% of returns)
10475:
$9,470
New York:
$17,621
(% of AGI for various income ranges: 3.1% for AGIs below $25k, 1.3% for AGIs $25k-50k, 1.3% for AGIs $50k-75k, 1.2% for AGIs $75k-100k, 2.1% for AGIs $100k-200k)
Total itemized deductions: $16,524 (25% of AGI, reported on 41.2% of returns)
Here:
$16,524
State:
$34,985
Here:
24.8% of AGI
State:
21.3% of AGI
(% of AGI for various income ranges: 7.7% for AGIs below $25k, 13.1% for AGIs $25k-50k, 16.8% for AGIs $50k-75k, 17.9% for AGIs $75k-100k, 17.3% for AGIs $100k-200k, 16.4% for AGIs over 200k)
Charity contributions: $3,348 (reported on 36.0% of returns)
Here:
$3,348
State:
$5,572
(% of AGI for various income ranges: 1.2% for AGIs below $25k, 2.5% for AGIs $25k-50k, 3.1% for AGIs $50k-75k, 3.1% for AGIs $75k-100k, 2.8% for AGIs $100k-200k, 1.5% for AGIs over 200k)
Taxes paid: $5,928 (reported on 41.1% of returns)
10475:
$5,928
State:
$18,656
(% of AGI for various income ranges: 1.2% for AGIs below $25k, 3.4% for AGIs $25k-50k, 5.9% for AGIs $50k-75k, 7.2% for AGIs $75k-100k, 8.0% for AGIs $100k-200k, 8.3% for AGIs over 200k)
Earned income credit: $1,845 (reported on 15.5% of returns)
Here:
$1,845
State:
$2,230
(% of AGI for various income ranges: 5.3% for AGIs below $25k, 0.6% for AGIs $25k-50k)
Percentage of individuals using paid preparers for their 2012 taxes: 68.5%
Here:
69%
State:
66%
(% for various income ranges: 64.1% for AGIs below $25k, 69.3% for AGIs $25k-50k, 70.7% for AGIs $50k-75k, 73.6% for AGIs $75k-100k, 73.1% for AGIs $100k-200k, 80.0% for AGIs over 200k)
Averages for the 2004 tax year for zip code 10475, filed in 2005:
Average Adjusted Gross Income (AGI) in 2004: $39,265 (Individual Income Tax Returns)
Here:
$39,265
State:
$59,519
Salary/wage: $38,478 (reported on 84.3% of returns)
Here:
$38,478
State:
$50,673
(% of AGI for various income ranges: 71.5% for AGIs below $10k, 61.6% for AGIs $10k-25k, 85.8% for AGIs $25k-50k, 86.5% for AGIs $50k-75k, 84.6% for AGIs $75k-100k, 77.8% for AGIs over 100k)
Taxable interest for individuals: $831 (reported on 44.9% of returns)
This zip code:
$831
New York:
$2,377
(% of AGI for various income ranges: 5.0% for AGIs below $10k, 2.4% for AGIs $10k-25k, 0.8% for AGIs $25k-50k, 0.6% for AGIs $50k-75k, 0.8% for AGIs $75k-100k, 0.9% for AGIs over 100k)
Taxable dividends: $1,076 (reported on 14.5% of returns)
Here:
$1,076
State:
$5,394
(% of AGI for various income ranges: 2.2% for AGIs below $10k, 0.8% for AGIs $10k-25k, 0.3% for AGIs $25k-50k, 0.3% for AGIs $50k-75k, 0.3% for AGIs $75k-100k, 0.4% for AGIs over 100k)
Net capital gain/loss: +$1,282 (reported on 9.0% of returns)
Here:
+$1,282
State:
+$23,581
(% of AGI for various income ranges: -1.4% for AGIs below $10k, -0.2% for AGIs $10k-25k, -0.0% for AGIs $25k-50k, 0.1% for AGIs $50k-75k, 0.3% for AGIs $75k-100k, 2.5% for AGIs over 100k)
Profit/loss from business: +$2,369 (reported on 7.8% of returns)
Here:
+$2,369
State:
+$13,809
(% of AGI for various income ranges: 10.5% for AGIs below $10k, 2.8% for AGIs $10k-25k, 0.0% for AGIs $25k-50k, -0.1% for AGIs $50k-75k, 0.3% for AGIs $75k-100k, 0.3% for AGIs over 100k)
IRA payment deduction: $2,234 (reported on 2.1% of returns)
10475:
$2,234
New York:
$3,115
(% of AGI for various income ranges: 0.2% for AGIs below $10k, 0.2% for AGIs $10k-25k, 0.2% for AGIs $25k-50k, 0.1% for AGIs $50k-75k, 0.0% for AGIs $75k-100k, 0.1% for AGIs over 100k)
Self-employed pension: $2,800 (reported on 0.1% of returns)
Here:
$2,800
New York:
$19,016
Total itemized deductions: $14,941 (27% of AGI, reported on 45.4% of returns)
Here:
$14,941
State:
$25,864
Here:
26.7% of AGI
State:
21.9% of AGI
(% of AGI for various income ranges: 4.9% for AGIs below $10k, 9.3% for AGIs $10k-25k, 16.7% for AGIs $25k-50k, 19.8% for AGIs $50k-75k, 19.2% for AGIs $75k-100k, 18.2% for AGIs over 100k)
Charity contributions deductions: $3,525 (6% of AGI, reported on 43.8% of returns)
Here:
$3,525
State:
$4,439
Here:
6.3% of AGI
State:
3.6% of AGI
(% of AGI for various income ranges: 0.7% for AGIs below $10k, 2.0% for AGIs $10k-25k, 4.0% for AGIs $25k-50k, 4.6% for AGIs $50k-75k, 4.3% for AGIs $75k-100k, 3.6% for AGIs over 100k)
Total tax: $4,297 (reported on 79.4% of returns)
10475:
$4,297
State:
$11,730
(% of AGI for various income ranges: 2.4% for AGIs below $10k, 3.5% for AGIs $10k-25k, 6.5% for AGIs $25k-50k, 9.7% for AGIs $50k-75k, 11.6% for AGIs $75k-100k, 14.7% for AGIs over 100k)
Earned income credit: $1,485 (reported on 13.1% of returns)
Here:
$1,485
State:
$1,757
Percentage of individuals using paid preparers for their 2004 taxes: 68.5%
Here:
69%
State:
67%
(% for various income ranges: 63.7% for AGIs below $10k, 70.4% for AGIs $10k-25k, 67.7% for AGIs $25k-50k, 69.7% for AGIs $50k-75k, 71.3% for AGIs $75k-100k, 73.2% for AGIs over 100k)
Household received Food Stamps/SNAP in the past 12 months: 4,020 Household did not receive Food Stamps/SNAP in the past 12 months: 14,886
Women who had a birth in the past 12 months: 642 (417 now married, 226 unmarried) Women who did not have a birth in the past 12 months: 7,946 (2,310 now married, 5,664 unmarried)
Housing units in zip code 10475 with a mortgage: 1,974 (142 second mortgage, 143 both second mortgage and home equity loan) Houses without a mortgage: 115
Median monthly owner costs for units with a mortgage: $1,638 Median monthly owner costs for units without a mortgage: $145
Residents with income below the poverty level in 2022:
This zip code:
14.8%
Whole state:
14.3%
Residents with income below 50% of the poverty level in 2022:
This zip code:
7.6%
Whole state:
6.8%
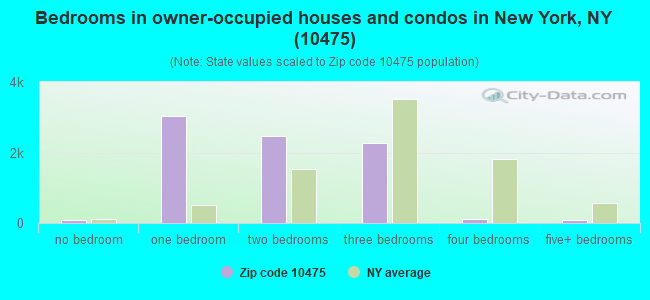
Median number of rooms in houses and condos:
Here:
4.0
State:
6.3
Median number of rooms in apartments:
Here:
4.0
State:
3.8
Notable locations in this zip code not listed on our city pages
Notable locations in zip code 10475: Rice Memorial Stadium (A), Fire Department New York Engine 66 Ladder 61 (B), Baychester Regional Branch New York Public Library (C), New York Ladder Company 61 (D). Display/hide their locations on the map
Shopping Centers: Bay Plaza Shopping Center (1), The Mall At Bay Plaza Shopping Center (2), Bartow Mall Shopping Center (3), Shopwell Plaza Shopping Center (4). Display/hide their locations on the map
2,736 married couples with children.
3,442 single-parent households (1,098 men, 2,344 women).
68.3% of residents of 10475 zip code speak English at home.
23.8% of residents speak Spanish at home (77% very well, 10% well, 11% not well, 1% not at all).
3.1% of residents speak other Indo-European language at home (56% very well, 23% well, 15% not well, 5% not at all).
1.5% of residents speak Asian or Pacific Island language at home (73% very well, 2% well, 25% not well).
3.9% of residents speak other language at home (83% very well, 11% well, 5% not well, 1% not at all).
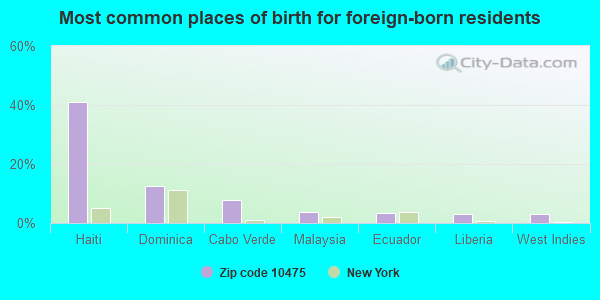
Foreign born population: 10,018 (23.4%) (75.9% of them are naturalized citizens)
This zip code:
23.4%
Whole state:
22.7%
41%Haiti
12%Dominica
8%Cabo Verde
4%Malaysia
3%Ecuador
3%Liberia
3%West Indies
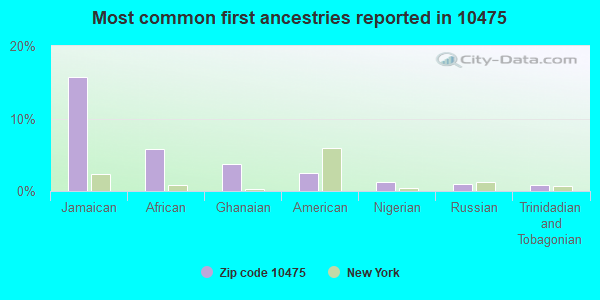
13%Jamaican
6%African
3%American
2%West Indian
1%Ghanaian
1%Nigerian
1%Trinidadian and Tobagonian
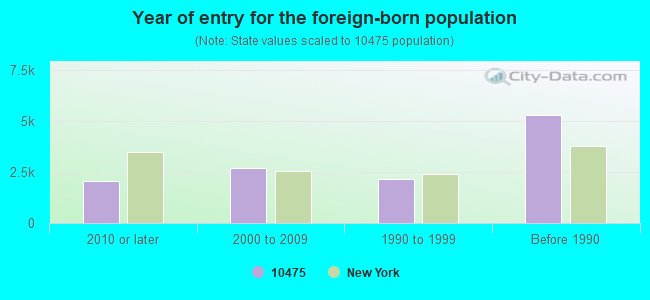
Year of entry for the foreign-born population
2,0392010 or later
2,7012000 to 2009
2,1391990 to 1999
5,288Before 1990
Major facilities with environmental interests located in this zip code:
HEXAGON LABORATORIES OF NY INCORPORATED (3536 PEARTREE AVENUE in BRONX, NY)
AIR MINOR (AIRS/AFS) SUPERFUND (Superfund database) (Integrated Compliance Information System) - ICIS-02-1996-0277, FORMAL ENFORCEMENT ACTION, ICIS-02-1989-0373, ICIS-02-1996-0059, COMPLIANCE ACTIVITY (Tracking inspections of insecticide, fungicide, and rodenticide, and toxic substances) (Resource Conservation and Recovery Act (tracking hazardous waste)) (Resource Conservation and Recovery Act (tracking hazardous waste)) TRI REPORTER (Tracking of toxic chemicals releasing facilities) Business SIC classification: MEDICINAL CHEMICALS AND BOTANICAL PRODUCTS; PHARMACEUTICAL PREPARATIONS Alternative names: HEXAGON LAB INC, HEXAGON LABS NYD053659074, HEXAGON LABS SITE - USEPA
CITY GAS 4090 BOSTON ROAD (4090 BOSTON ROAD in BRONX, NY)
AIR MINOR (AIRS/AFS) (Integrated Compliance Information System) - ICIS-02-2001-0004, FORMAL ENFORCEMENT ACTION (Resource Conservation and Recovery Act (tracking hazardous waste)) Business SIC classification: GASOLINE SERVICE STATIONS Alternative names: BOSTON ROAD CITGO-4090 BOSTON RD, CONNER GAS NY INC
HARRY S. TRUMAN HS ( in BRONX, NY)
(National Center for Education Statistics) - STATE ID-327800010455 Organizations: NEW YORK CITY PUBLIC SCHOOLS (SCHOOL DISTRICT)
HEALTH CARE WASTE SERVICES (3446 ROMBOUTS AVE in BRONX, NY)
CON EDISON - MH 14227 (E170TH STREET AND TELLER AVE in BRONX, NY)
Large Quantity Generators, more that 1000 kg of hazardous waste/month (Resource Conservation and Recovery Act (tracking hazardous waste)) Organizations: CONSOLIDATED EDISON COMPANY OF NY, INC. (CONTACT/OPERATOR)
CON EDISON - MH 27725 (CO-OP CITY BLVD AND BORTOW AVE in BRONX, NY)
Large Quantity Generators, more that 1000 kg of hazardous waste/month (Resource Conservation and Recovery Act (tracking hazardous waste)) Organizations: CONSOLIDATED EDISON COMPANY OF NY, INC. (CONTACT/OPERATOR)
2020 BARTOW AVENUE (2020 BARTOW AVENUE in NEW YORK CITY, NY)
HAZARDOUS WASTE BIENNIAL REPORTER (Resource Conservation and Recovery Act (tracking hazardous waste)) (Resource Conservation and Recovery Act (tracking hazardous waste))
CO-OP CITY POWER PLANT (98 CO-OP CITY BOULEVARD in BRONX, NY)
OIL CONTROL (Facility Response Plan for oil discharge) HAZARDOUS WASTE BIENNIAL REPORTER (Resource Conservation and Recovery Act (tracking hazardous waste)) Small Quantity Generators, between 100 kg and 1000 kg of hazardous waste/month (Resource Conservation and Recovery Act (tracking hazardous waste)) Organizations: RIVERBAY CORPORATION (CONTACT/GENERAL)
Alternative names: RIVERBAY CORP
CON ED - V 5020 (BOSTON RD & STEENWICK ST in BRONX, NY)
HAZARDOUS WASTE BIENNIAL REPORTER (Resource Conservation and Recovery Act (tracking hazardous waste)) (Resource Conservation and Recovery Act (tracking hazardous waste))
CON ED - VS 2580 (ASCH LOOP & BARTOW AVE in BRONX, NY)
HAZARDOUS WASTE BIENNIAL REPORTER (Resource Conservation and Recovery Act (tracking hazardous waste)) (Resource Conservation and Recovery Act (tracking hazardous waste))
CON ED MH 5925 (NWC BOSTON RD & DEREIMER AVE in BRONX, NY)
HAZARDOUS WASTE BIENNIAL REPORTER (Resource Conservation and Recovery Act (tracking hazardous waste)) (Resource Conservation and Recovery Act (tracking hazardous waste))
CON ED V 2614 (BOSTON RD & HUGUENOT in BRONX, NY)
HAZARDOUS WASTE BIENNIAL REPORTER (Resource Conservation and Recovery Act (tracking hazardous waste)) (Resource Conservation and Recovery Act (tracking hazardous waste))
AMOCO OIL CO (3500 CONNER ST in BRONX, NY)
(Resource Conservation and Recovery Act (tracking hazardous waste))
Housing units lacking complete plumbing facilities: 0.9% Housing units lacking complete kitchen facilities: 1.5%
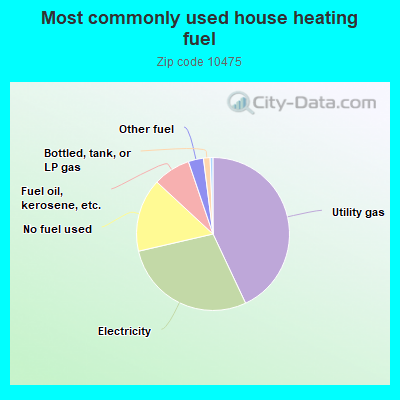
43.0%Utility gas
28.4%Electricity
15.5%No fuel used
7.9%Fuel oil, kerosene, etc.
3.2%Other fuel
1.4%Bottled, tank, or LP gas
0.6%Solar energy
Population in 1990: 37,045. Population change in the 1990s: +1,041 (+2.8%).
Place of birth for U.S.-born residents:
This state: 26,228
Northeast: 442
Midwest: 150
South: 3,259
West: 222
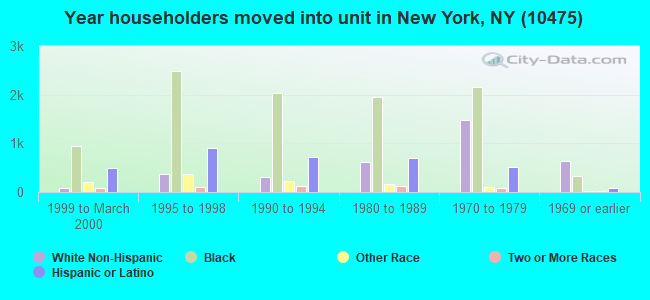
71% of the 10475 zip code residents lived in the same house 5 years ago. Out of people who lived in different houses, 73% lived in this county. Out of people who lived in different counties, 50% lived in New York.
95% of the 10475 zip code residents lived in the same house 1 year ago. Out of people who lived in different houses, 45% moved from this county. Out of people who lived in different houses, 14% moved from different county within same state. Out of people who lived in different houses, 29% moved from different state. Out of people who lived in different houses, 12% moved from abroad.
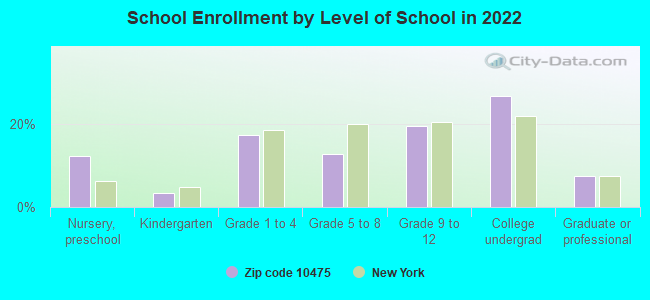
Private vs. public school enrollment:
Students in private schools in grades 1 to 8 (elementary and middle school): 279
Here:
8.6%
New York:
15.6%
Students in private schools in grades 9 to 12 (high school): 98
Here:
4.7%
New York:
15.0%
Students in private undergraduate colleges: 1,075
Here:
37.5%
New York:
39.2%
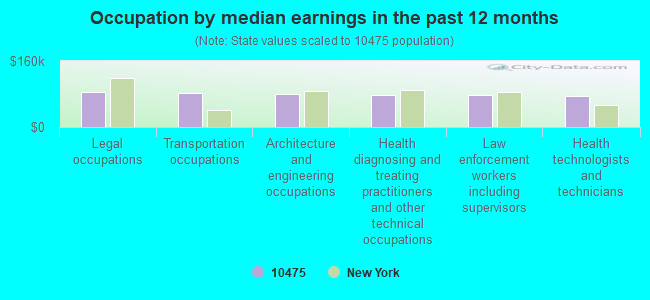
Occupation by median earnings in the past 12 months ($)
84,956Legal occupations
81,232Transportation occupations
79,407Architecture and engineering occupations
78,283Health diagnosing and treating practitioners and other technical occupations
76,521Law enforcement workers including supervisors
76,350Health technologists and technicians
Top industries in this zip code by the number of employees in 2005:
Health Care and Social Assistance: Nursing Care Facilities (500-999 employees: 1 establishment, 100-249 employees: 2 establishments)
Real Estate and Rental and Leasing: Residential Property Managers (500-999: 1, 10-19: 1, 5-9: 1, 1-4: 1)
Health Care and Social Assistance: Child Day Care Services (250-499: 1, 5-9: 2)
Health Care and Social Assistance: Home Health Care Services (250-499: 1)
Information: Cable and Other Subscription Programming (250-499: 1)
2007 - 2018 National Fire Incident Reporting System (NFIRS) incidents
Based on the data from the years 2007 - 2018 the average number of fires per year is 212. The highest number of fire incidents - 245 took place in 2015, and the least - 130 in 2007. The data has an increasing trend.
When looking into fire subcategories, the most incidents belonged to: Structure Fires (71.8%), and Outside Fires (12.5%).
Fire incident types reported to NFIRS in Zip Code 10475

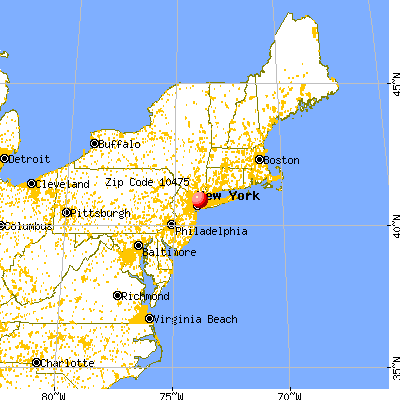


 Nearest zip codes: 10464, 10469, 10466, 10803, 10550, 10461.


 Based on the data from the years 2007 - 2018 the average number of fires per year is 212. The highest number of fire incidents - 245 took place in 2015, and the least - 130 in 2007. The data has an increasing trend.
 When looking into fire subcategories, the most incidents belonged to: Structure Fires (71.8%), and Outside Fires (12.5%).