Estimated zip code population in 2022: 57,491 Zip code population in 2010: 61,347 Zip code population in 2000: 58,595
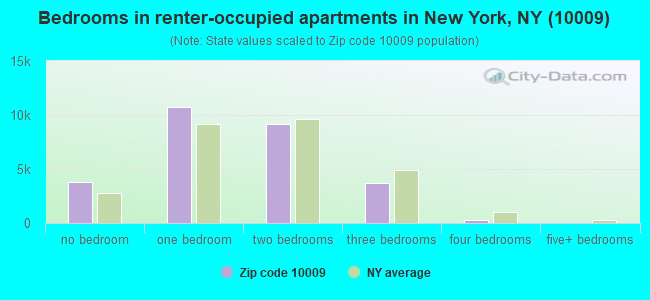
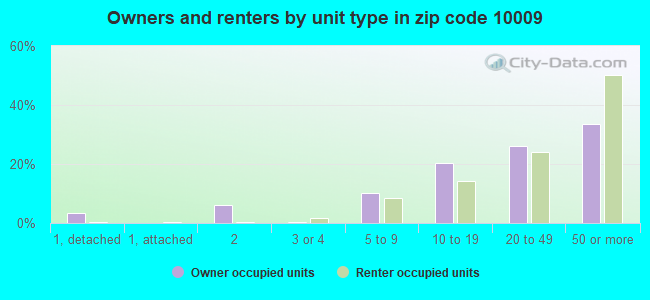
Houses and condos: 32,363 Renter-occupied apartments: 27,557
% of renters here:
91%
State:
46%
March 2022 cost of living index in zip code 10009: 151.4 (very high, U.S. average is 100)
Land area: 0.6 sq. mi. Water area: 0.0 sq. mi.
Population density: 93,239 people per square mile
(very high).
OSM Map
General Map
Google Map
MSN Map
OSM Map
General Map
Google Map
MSN Map
OSM Map
General Map
Google Map
MSN Map
OSM Map
General Map
Google Map
MSN Map
Please wait while loading the map...
Real estate property taxes paid for housing units in 2022:
This zip code:
1.1% ($8,254)
New York:
1.5% ($6,180)
Median real estate property taxes paid for housing units with mortgages in 2022: $9,168 (1.0%) Median real estate property taxes paid for housing units with no mortgage in 2022: $7,111 (1.0%)
Estimated median house/condo value in 2022: $744,404
10009:
$744,404
New York:
$400,400
According to our research of New York and other state lists, there were 11 registered sex offenders living in 10009 zip code as of April 27, 2024. The ratio of all residents to sex offenders in zip code 10009 is 5,514 to 1. The ratio of registered sex offenders to all residents in this zip code is much lower than the state average.
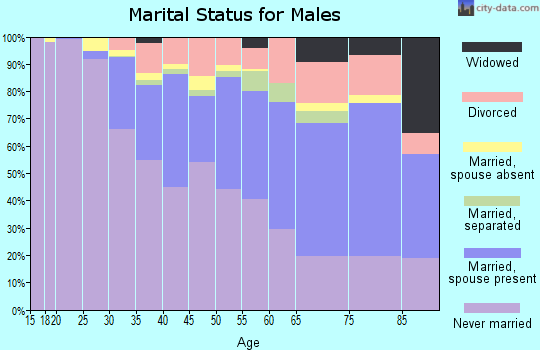
Median resident age:
This zip code:
38.9 years
New York median age:
40.0 years
Average household size:
This zip code:
1.9 people
New York:
2.5 people
Averages for the 2020 tax year for zip code 10009, filed in 2021:
Average Adjusted Gross Income (AGI) in 2020: $85,474 (Individual Income Tax Returns)
Here:
$85,474
State:
$90,930
Salary/wage: $80,573 (reported on 80.3% of returns)
Here:
$80,573
State:
$72,104
(% of AGI for various income ranges: 920.1% for AGIs below $25k, 3412.8% for AGIs $25k-50k, 6851.2% for AGIs $50k-75k, 10531.9% for AGIs $75k-100k, 19844.6% for AGIs $100k-200k, 116543.5% for AGIs over 200k)
Taxable interest for individuals: $1,485 (reported on 33.3% of returns)
This zip code:
$1,485
New York:
$3,075
(% of AGI for various income ranges: 20.6% for AGIs below $25k, 26.6% for AGIs $25k-50k, 43.2% for AGIs $50k-75k, 53.1% for AGIs $75k-100k, 113.9% for AGIs $100k-200k, 1075.2% for AGIs over 200k)
Ordinary dividends: $5,721 (reported on 29.1% of returns)
Here:
$5,721
State:
$11,095
(% of AGI for various income ranges: 38.5% for AGIs below $25k, 71.9% for AGIs $25k-50k, 129.9% for AGIs $50k-75k, 180.3% for AGIs $75k-100k, 409.4% for AGIs $100k-200k, 3995.3% for AGIs over 200k)
Net capital gain/loss in AGI: +$15,190 (reported on 26.5% of returns)
Here:
+$15,190
State:
+$44,925
(% of AGI for various income ranges: 23.0% for AGIs below $25k, 68.7% for AGIs $25k-50k, 118.0% for AGIs $50k-75k, 243.6% for AGIs $75k-100k, 595.2% for AGIs $100k-200k, 14512.9% for AGIs over 200k)
Profit/loss from business: +$16,451 (reported on 17.9% of returns)
Here:
+$16,451
State:
+$14,940
(% of AGI for various income ranges: 171.4% for AGIs below $25k, 217.3% for AGIs $25k-50k, 261.8% for AGIs $50k-75k, 351.1% for AGIs $75k-100k, 629.8% for AGIs $100k-200k, 5655.2% for AGIs over 200k)
Taxable individual retirement arrangement distribution: $18,313 (reported on 5.9% of returns)
10009:
$18,313
New York:
$19,609
(% of AGI for various income ranges: 39.6% for AGIs below $25k, 61.3% for AGIs $25k-50k, 109.4% for AGIs $50k-75k, 199.8% for AGIs $75k-100k, 400.0% for AGIs $100k-200k, 1318.2% for AGIs over 200k)
Self-employed (Keogh) retirement plans: $22,705 (reported on 1.3% of returns)
10009:
$22,705
New York:
$32,497
(% of AGI for various income ranges: 15.7% for AGIs $25k-50k, 16.7% for AGIs $50k-75k, 23.9% for AGIs $75k-100k, 66.6% for AGIs $100k-200k, 850.3% for AGIs over 200k)
Total itemized deductions: $28,563 (reported on 6.3% of returns)
Here:
$28,563
State:
$39,326
(% of AGI for various income ranges: 31.2% for AGIs below $25k, 73.1% for AGIs $25k-50k, 146.0% for AGIs $50k-75k, 274.1% for AGIs $75k-100k, 576.0% for AGIs $100k-200k, 3607.7% for AGIs over 200k)
Charity contributions: $8,825 (reported on 5.2% of returns)
Here:
$8,825
State:
$15,420
(% of AGI for various income ranges: 2.8% for AGIs below $25k, 11.6% for AGIs $25k-50k, 27.6% for AGIs $50k-75k, 60.5% for AGIs $75k-100k, 125.0% for AGIs $100k-200k, 1195.3% for AGIs over 200k)
Taxes paid: $8,586 (reported on 6.2% of returns)
10009:
$8,586
State:
$9,183
(% of AGI for various income ranges: 6.7% for AGIs below $25k, 18.0% for AGIs $25k-50k, 35.5% for AGIs $50k-75k, 88.0% for AGIs $75k-100k, 211.6% for AGIs $100k-200k, 957.4% for AGIs over 200k)
Earned income credit: $1,794 (reported on 12.2% of returns)
Here:
$1,794
State:
$2,138
(% of AGI for various income ranges: 78.7% for AGIs below $25k, 48.8% for AGIs $25k-50k)
Percentage of individuals using paid preparers for their 2020 taxes: 94.5%
Here:
94%
State:
95%
(% for various income ranges: 92.8% for AGIs below $25k, 94.8% for AGIs $25k-50k, 95.0% for AGIs $50k-75k, 94.8% for AGIs $75k-100k, 95.2% for AGIs $100k-200k, 96.5% for AGIs over 200k)
Averages for the 2012 tax year for zip code 10009, filed in 2013:
Average Adjusted Gross Income (AGI) in 2012: $69,934 (Individual Income Tax Returns)
Here:
$69,934
State:
$77,088
Salary/wage: $63,071 (reported on 83.0% of returns)
Here:
$63,071
State:
$60,593
(% of AGI for various income ranges: 67.4% for AGIs below $25k, 83.8% for AGIs $25k-50k, 85.1% for AGIs $50k-75k, 83.2% for AGIs $75k-100k, 82.2% for AGIs $100k-200k, 59.6% for AGIs over 200k)
Taxable interest for individuals: $1,133 (reported on 36.8% of returns)
This zip code:
$1,133
New York:
$3,125
(% of AGI for various income ranges: 1.2% for AGIs below $25k, 0.6% for AGIs $25k-50k, 0.4% for AGIs $50k-75k, 0.5% for AGIs $75k-100k, 0.6% for AGIs $100k-200k, 0.6% for AGIs over 200k)
Ordinary dividends: $4,205 (reported on 24.8% of returns)
Here:
$4,205
State:
$10,299
(% of AGI for various income ranges: 2.4% for AGIs below $25k, 1.4% for AGIs $25k-50k, 1.1% for AGIs $50k-75k, 1.5% for AGIs $75k-100k, 1.6% for AGIs $100k-200k, 1.5% for AGIs over 200k)
Net capital gain/loss in AGI: +$13,869 (reported on 20.0% of returns)
Here:
+$13,869
State:
+$42,474
(% of AGI for various income ranges: 0.3% for AGIs $25k-50k, 0.3% for AGIs $50k-75k, 0.6% for AGIs $75k-100k, 1.1% for AGIs $100k-200k, 11.2% for AGIs over 200k)
Profit/loss from business: +$16,593 (reported on 20.2% of returns)
Here:
+$16,593
State:
+$16,168
(% of AGI for various income ranges: 16.1% for AGIs below $25k, 5.9% for AGIs $25k-50k, 3.9% for AGIs $50k-75k, 3.0% for AGIs $75k-100k, 4.2% for AGIs $100k-200k, 3.8% for AGIs over 200k)
Taxable individual retirement arrangement distribution: $13,212 (reported on 6.0% of returns)
10009:
$13,212
New York:
$17,621
(% of AGI for various income ranges: 2.5% for AGIs below $25k, 1.2% for AGIs $25k-50k, 1.1% for AGIs $50k-75k, 1.4% for AGIs $75k-100k, 1.3% for AGIs $100k-200k, 0.7% for AGIs over 200k)
Self-employment retirement plans: $18,677 (reported on 1.4% of returns)
10009:
$18,677
New York:
$27,330
(% of AGI for various income ranges: 0.1% for AGIs below $25k, 0.2% for AGIs $25k-50k, 0.2% for AGIs $50k-75k, 0.3% for AGIs $75k-100k, 0.4% for AGIs $100k-200k, 0.6% for AGIs over 200k)
Total itemized deductions: $21,680 (15% of AGI, reported on 34.9% of returns)
Here:
$21,680
State:
$34,985
Here:
15.5% of AGI
State:
21.3% of AGI
(% of AGI for various income ranges: 6.2% for AGIs below $25k, 6.2% for AGIs $25k-50k, 8.3% for AGIs $50k-75k, 12.3% for AGIs $75k-100k, 13.9% for AGIs $100k-200k, 11.8% for AGIs over 200k)
Charity contributions: $2,561 (reported on 26.5% of returns)
Here:
$2,561
State:
$5,572
(% of AGI for various income ranges: 0.5% for AGIs below $25k, 0.7% for AGIs $25k-50k, 1.0% for AGIs $50k-75k, 1.1% for AGIs $75k-100k, 1.3% for AGIs $100k-200k, 0.9% for AGIs over 200k)
Taxes paid: $14,489 (reported on 34.7% of returns)
10009:
$14,489
State:
$18,656
(% of AGI for various income ranges: 1.2% for AGIs below $25k, 1.7% for AGIs $25k-50k, 3.9% for AGIs $50k-75k, 7.2% for AGIs $75k-100k, 9.0% for AGIs $100k-200k, 10.5% for AGIs over 200k)
Earned income credit: $1,876 (reported on 15.1% of returns)
Here:
$1,876
State:
$2,230
(% of AGI for various income ranges: 6.0% for AGIs below $25k, 0.5% for AGIs $25k-50k)
Percentage of individuals using paid preparers for their 2012 taxes: 58.6%
Here:
59%
State:
66%
(% for various income ranges: 58.4% for AGIs below $25k, 56.5% for AGIs $25k-50k, 54.5% for AGIs $50k-75k, 57.6% for AGIs $75k-100k, 64.1% for AGIs $100k-200k, 72.7% for AGIs over 200k)
Averages for the 2004 tax year for zip code 10009, filed in 2005:
Average Adjusted Gross Income (AGI) in 2004: $50,245 (Individual Income Tax Returns)
Here:
$50,245
State:
$59,519
Salary/wage: $49,374 (reported on 82.9% of returns)
Here:
$49,374
State:
$50,673
(% of AGI for various income ranges: 99.6% for AGIs below $10k, 73.5% for AGIs $10k-25k, 86.4% for AGIs $25k-50k, 85.8% for AGIs $50k-75k, 85.2% for AGIs $75k-100k, 77.0% for AGIs over 100k)
Taxable interest for individuals: $1,393 (reported on 48.9% of returns)
This zip code:
$1,393
New York:
$2,377
(% of AGI for various income ranges: 6.5% for AGIs below $10k, 2.2% for AGIs $10k-25k, 1.2% for AGIs $25k-50k, 1.3% for AGIs $50k-75k, 1.2% for AGIs $75k-100k, 1.2% for AGIs over 100k)
Taxable dividends: $3,035 (reported on 27.6% of returns)
Here:
$3,035
State:
$5,394
(% of AGI for various income ranges: 5.6% for AGIs below $10k, 2.0% for AGIs $10k-25k, 1.2% for AGIs $25k-50k, 1.3% for AGIs $50k-75k, 1.4% for AGIs $75k-100k, 2.0% for AGIs over 100k)
Net capital gain/loss: +$4,972 (reported on 21.8% of returns)
Here:
+$4,972
State:
+$23,581
(% of AGI for various income ranges: -2.9% for AGIs below $10k, -0.7% for AGIs $10k-25k, 0.2% for AGIs $25k-50k, 0.5% for AGIs $50k-75k, 0.8% for AGIs $75k-100k, 4.9% for AGIs over 100k)
Profit/loss from business: +$10,137 (reported on 21.2% of returns)
Here:
+$10,137
State:
+$13,809
(% of AGI for various income ranges: 22.7% for AGIs below $10k, 11.1% for AGIs $10k-25k, 4.5% for AGIs $25k-50k, 2.7% for AGIs $50k-75k, 2.7% for AGIs $75k-100k, 3.6% for AGIs over 100k)
IRA payment deduction: $2,839 (reported on 3.5% of returns)
10009:
$2,839
New York:
$3,115
(% of AGI for various income ranges: 0.7% for AGIs below $10k, 0.4% for AGIs $10k-25k, 0.4% for AGIs $25k-50k, 0.2% for AGIs $50k-75k, 0.2% for AGIs $75k-100k, 0.1% for AGIs over 100k)
Self-employed pension: $13,492 (reported on 1.6% of returns)
Here:
$13,492
New York:
$19,016
(% of AGI for various income ranges: 0.2% for AGIs below $10k, 0.1% for AGIs $10k-25k, 0.2% for AGIs $25k-50k, 0.2% for AGIs $50k-75k, 0.3% for AGIs $75k-100k, 0.7% for AGIs over 100k)
Total itemized deductions: $17,214 (18% of AGI, reported on 36.2% of returns)
Here:
$17,214
State:
$25,864
Here:
18.3% of AGI
State:
21.9% of AGI
(% of AGI for various income ranges: 10.1% for AGIs below $10k, 7.1% for AGIs $10k-25k, 9.0% for AGIs $25k-50k, 12.7% for AGIs $50k-75k, 14.3% for AGIs $75k-100k, 14.3% for AGIs over 100k)
Charity contributions deductions: $2,667 (3% of AGI, reported on 31.9% of returns)
Here:
$2,667
State:
$4,439
Here:
2.8% of AGI
State:
3.6% of AGI
(% of AGI for various income ranges: 0.6% for AGIs below $10k, 0.9% for AGIs $10k-25k, 1.4% for AGIs $25k-50k, 1.8% for AGIs $50k-75k, 1.9% for AGIs $75k-100k, 1.9% for AGIs over 100k)
Total tax: $9,397 (reported on 80.8% of returns)
10009:
$9,397
State:
$11,730
(% of AGI for various income ranges: 6.1% for AGIs below $10k, 5.4% for AGIs $10k-25k, 9.2% for AGIs $25k-50k, 13.2% for AGIs $50k-75k, 15.1% for AGIs $75k-100k, 20.7% for AGIs over 100k)
Earned income credit: $1,454 (reported on 15.5% of returns)
Here:
$1,454
State:
$1,757
Percentage of individuals using paid preparers for their 2004 taxes: 64.2%
Here:
64%
State:
67%
(% for various income ranges: 61.1% for AGIs below $10k, 65.4% for AGIs $10k-25k, 60.9% for AGIs $25k-50k, 63.9% for AGIs $50k-75k, 67.4% for AGIs $75k-100k, 73.0% for AGIs over 100k)
Likely homosexual households (counted as self-reported same-sex unmarried-partner households)
Lesbian couples: 0.1% of all households
Gay men: 0.4% of all households
Household received Food Stamps/SNAP in the past 12 months: 6,068 Household did not receive Food Stamps/SNAP in the past 12 months: 24,396
Women who had a birth in the past 12 months: 469 (402 now married, 62 unmarried) Women who did not have a birth in the past 12 months: 15,037 (2,803 now married, 12,362 unmarried)
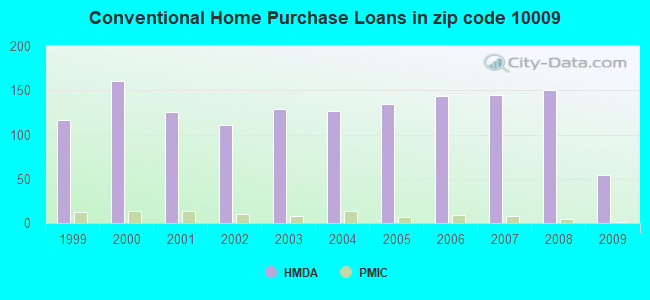
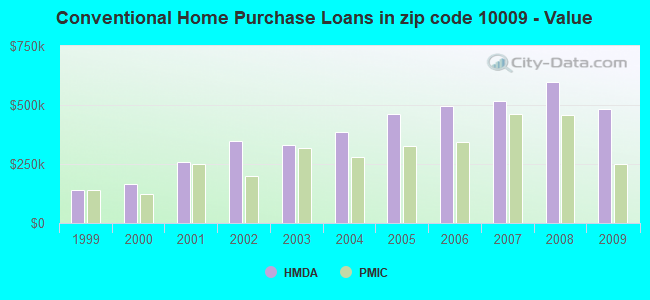
Housing units in zip code 10009 with a mortgage: 965 (110 second mortgage, 32 both second mortgage and home equity loan) Houses without a mortgage: 15
Residents with income below the poverty level in 2022:
This zip code:
24.0%
Whole state:
14.3%
Residents with income below 50% of the poverty level in 2022:
This zip code:
9.8%
Whole state:
6.8%
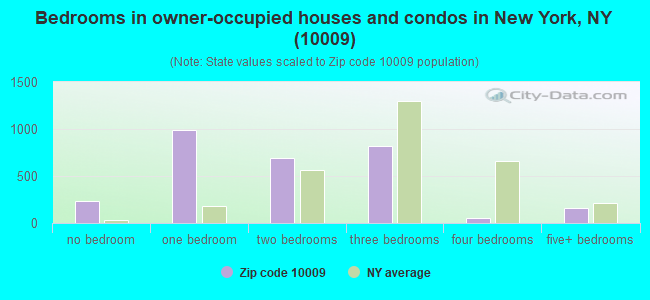
Median number of rooms in houses and condos:
Here:
4.0
State:
6.3
Median number of rooms in apartments:
Here:
3.4
State:
3.8
Notable locations in this zip code not listed on our city pages
Notable locations in zip code 10009: Ageloff Towers (A), Sixth Street Community Center (B), Christodora House (C), New York Ladder Company 11 (D), Fire Department New York Engine 28 Ladder 11 (E). Display/hide their locations on the map
Churches in zip code 10009 include: Grace Chapel and Dispensary (A), Saint Nicholas Roman Catholic Church (B), Saint Mark's Memorial Chapel (C), People's Home Church (D), Immaculate Conception Church (E), San Isidro Y San Leandro Orthodox Catholic Church of the Hispanic Rite (F), Trinity Lower East Side Parish and Shelter (G), The Father's Heart Ministry Center (H). Display/hide their locations on the map
Parks in zip code 10009 include: Hartman Triangle (1), Murphy Park (2), Toyota Children's Learning Garden (3), Hartman Triangle (4), Orchard Alley Garden (5), The Secret Garden (6), Peachtree Garden (7), B Street Community Garden (8), The Creative Little Garden (9). Display/hide their locations on the map
Tourist attraction (not listed on the city page) : Bowery & Canal Walking Tours (532 East 14th Street).
2,860 married couples with children.
2,541 single-parent households (803 men, 1,738 women).
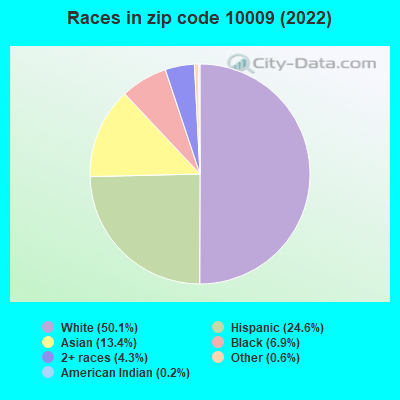
65.1% of residents of 10009 zip code speak English at home.
17.4% of residents speak Spanish at home (65% very well, 12% well, 16% not well, 6% not at all).
6.3% of residents speak other Indo-European language at home (78% very well, 16% well, 3% not well, 3% not at all).
10.4% of residents speak Asian or Pacific Island language at home (44% very well, 13% well, 28% not well, 15% not at all).
0.9% of residents speak other language at home (83% very well, 11% well, 6% not well).
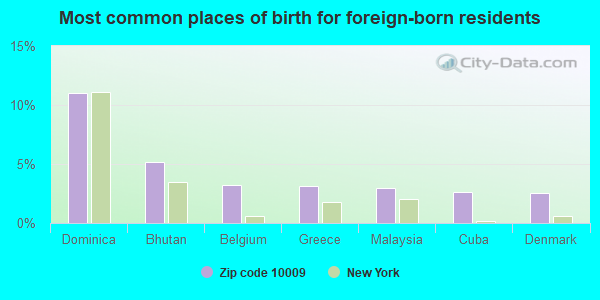
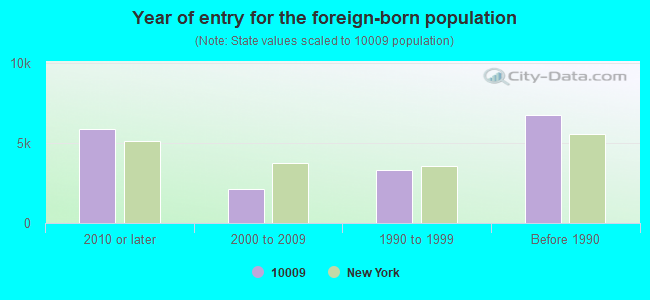
Foreign born population: 14,013 (24.4%) (56.3% of them are naturalized citizens)
Major facilities with environmental interests located in this zip code:
CON ED-EAST RIVER GENERATING STATION (801 EAST 14 STREET in NEW YORK, NY)
AIR MAJOR (AIRS/AFS) AIR PROGRAM (Clean Air Markets Division Business System) STATE MASTER (New York facility tracking) - AIR PROGRAM, National Pollutant Discharge Elimination System Permit, 401 CERTIFICATION, AIR PROGRAM, SECTION 404 PERMITTING, 401 CERTIFICATION, AIR MAJOR, AIR PROGRAM, National Pollutant Discharge Elimination System Permit, HAZARDOUS WASTE PROGRAM OIL CONTROL (Facility Response Plan for oil discharge) CRITERIA AND HAZARDOUS AIR POLLUTANT INVENTORY (Inventory of air pollution sources) National Pollutant Discharge Elimination System MAJOR (Tracking pollutant discharge elimination systems) - permit HAZARDOUS WASTE BIENNIAL REPORTER (Resource Conservation and Recovery Act (tracking hazardous waste)) Large Quantity Generators, more that 1000 kg of hazardous waste/month (Resource Conservation and Recovery Act (tracking hazardous waste)) - notification Large Quantity Generators, more that 1000 kg of hazardous waste/month (Resource Conservation and Recovery Act (tracking hazardous waste)) TRI REPORTER (Tracking of toxic chemicals releasing facilities) Business SIC classification: ELECTRIC SERVICES; STEAM AND AIR-CONDITIONING SUPPLY Business NAICS classification: FOSSIL FUEL ELECTRIC POWER GENERATION.; ELECTRIC POWER DISTRIBUTION.; ELECTRIC POWER DISTRIBUTION. Organizations: CONSOLIDATED EDISON (CONTACT/GENERAL)
, CONSOLIDATED EDISON COMPANY OF NY, INC. (CONTACT/OPERATOR)
, CONSOLIDATED EDISON CO OF NY (CONTACT/OWNER)
, CONSOLIDATED EDISON COMPANY OF NY, INC. (CONTACT/OWNER)
, CONSOLIDATED EDISON COMPANY OF NEW YORK INC (LEGALLY RESPONSIBLE PARTY)
, CONSOLIDATED EDISON OF NEW YORK (OWNER/OPERATOR)
Alternative names: CON ED - EAST RIVER SUBSTATION, CON EDISON CHEM LAB, BLDG 138, CON EDISON - EAST RIVER, CONSOLIDATED EDISON COMPANY, CONSOLIDATED EDISON CO. OF NEW YORK, CONSOLIDATED EDISON CO. OF NEW YORK -EAST RIVER FACILITY, CONSOLIDATED EDISON CHEM LAB, CONSOLIDATED EDISON CO. OF NEW YORK, CONSOLIDATED EDISON CO. OF NEW YORK -EAST RIVER FACILITY, CONSOLIDATED EDISON CO. OF NEW YORK -EAST RIVER FACILITY
CON EDISON - E. 16TH STREET (700 E. 16TH STREET in NEW YORK, NY)
HAZARDOUS WASTE BIENNIAL REPORTER (Resource Conservation and Recovery Act (tracking hazardous waste)) Large Quantity Generators, more that 1000 kg of hazardous waste/month (Resource Conservation and Recovery Act (tracking hazardous waste)) Large Quantity Generators, more that 1000 kg of hazardous waste/month (Resource Conservation and Recovery Act (tracking hazardous waste)) Business NAICS classification: ELECTRIC POWER DISTRIBUTION.; ELECTRIC POWER DISTRIBUTION. Organizations: CONSOLIDATED EDISON COMPANY OF NY, INC. (CONTACT/OPERATOR)
Alternative names: CON ED EAST 16TH SAINT SERVICE CENTER, CON ED - STEAM OPERATION COOLING PLT, CON EDISON - E 16TH ST CP
CON EDISON - VS 0825 (AVE C AND E16TH STREET in NEW YORK, NY)
Large Quantity Generators, more that 1000 kg of hazardous waste/month (Resource Conservation and Recovery Act (tracking hazardous waste)) Large Quantity Generators, more that 1000 kg of hazardous waste/month (Resource Conservation and Recovery Act (tracking hazardous waste)) Organizations: CONSOLIDATED EDISON COMPANY OF NY, INC. (CONTACT/OPERATOR)
Alternative names: CON EDISON - VS 825
12TH STREET ACAD ( in NEW YORK, NY)
(National Center for Education Statistics) - STATE ID-310100010370 Organizations: NEW YORK CITY PUBLIC SCHOOLS (SCHOOL DISTRICT)
CON ED - 13TH ST SUBSTATION #4 (SUBSTATION MILLYARD E in NEW YORK, NY)
HAZARDOUS WASTE BIENNIAL REPORTER (Resource Conservation and Recovery Act (tracking hazardous waste)) (Resource Conservation and Recovery Act (tracking hazardous waste)) Alternative names: CON ED - 13TH ST SUBSTATION #5
CON EDISON - EXC N/A (AVENUE C BTW E. 12TH & E. 13TH in NEW YORK, NY)
Large Quantity Generators, more that 1000 kg of hazardous waste/month (Resource Conservation and Recovery Act (tracking hazardous waste)) Organizations: CONSOLIDATED EDISON COMPANY OF NY, INC. (CONTACT/OPERATOR)
CON EDISON - GM 10009 (152 E. 66TH ST. in NEW YORK, NY)
Large Quantity Generators, more that 1000 kg of hazardous waste/month (Resource Conservation and Recovery Act (tracking hazardous waste)) Organizations: CONSOLIDATED EDISON COMPANY OF NY, INC. (CONTACT/OPERATOR)
CON EDISON - GM 16 INCH (10TH AVE WEST 42 /WEST 43 in NEW YORK, NY)
Large Quantity Generators, more that 1000 kg of hazardous waste/month (Resource Conservation and Recovery Act (tracking hazardous waste)) Organizations: CONSOLIDATED EDISON COMPANY OF NY, INC. (CONTACT/OPERATOR)
CON EDISON - MH 61781 (AVE C AND E20TH ST in NEW YORK, NY)
Large Quantity Generators, more that 1000 kg of hazardous waste/month (Resource Conservation and Recovery Act (tracking hazardous waste)) Organizations: CONSOLIDATED EDISON COMPANY OF NY, INC. (CONTACT/OPERATOR)
CON EDISON - VS 6361 (12TH ST. AND AVE A. in NEW YORK, NY)
Large Quantity Generators, more that 1000 kg of hazardous waste/month (Resource Conservation and Recovery Act (tracking hazardous waste)) Organizations: CONSOLIDATED EDISON COMPANY OF NY, INC. (CONTACT/OPERATOR)
CON EDISON AT PETER COOPER VILLAGE (E 22ND ST AT 1ST AVE in NEW YORK, NY)
Large Quantity Generators, more that 1000 kg of hazardous waste/month (Resource Conservation and Recovery Act (tracking hazardous waste)) Organizations: METROPOLITAN LIFE INSURANCE CO (CONTACT/OPERATOR)
, METROPOLITAN INSURANCE AND ANNUITY CO (CONTACT/OWNER)
CONSOLIDATED EDISON FEEDERS 46&48 (E RIVER PARK in NEW YORK, NY)
Large Quantity Generators, more that 1000 kg of hazardous waste/month (Resource Conservation and Recovery Act (tracking hazardous waste)) Business NAICS classification: ELECTRIC POWER DISTRIBUTION. Alternative names: CON ED FEEDERS 46 & 48
CON ED - AVE A E 7TH-E 10TH ST (AVE A E 7TH-E 10TH ST in MANHATTAN, NY)
HAZARDOUS WASTE BIENNIAL REPORTER (Resource Conservation and Recovery Act (tracking hazardous waste)) (Resource Conservation and Recovery Act (tracking hazardous waste))
Housing units lacking complete plumbing facilities: 0.3% Housing units lacking complete kitchen facilities: 1.0%
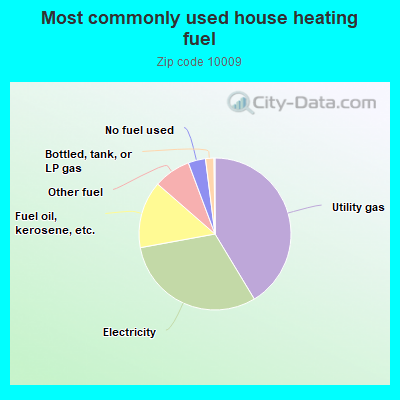
41.4%Utility gas
30.8%Electricity
14.3%Fuel oil, kerosene, etc.
7.9%Other fuel
3.7%No fuel used
1.8%Bottled, tank, or LP gas
Population in 1990: 57,426. Population change in the 1990s: +1,169 (+2.0%).
Place of birth for U.S.-born residents:
This state: 22,873
Northeast: 5,383
Midwest: 3,435
South: 4,528
West: 3,722
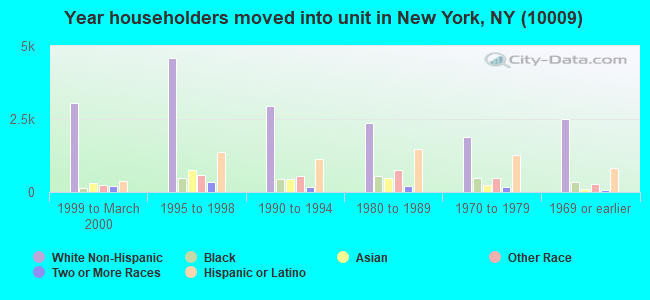
66% of the 10009 zip code residents lived in the same house 5 years ago. Out of people who lived in different houses, 51% lived in this county. Out of people who lived in different counties, 50% lived in New York.
88% of the 10009 zip code residents lived in the same house 1 year ago. Out of people who lived in different houses, 49% moved from this county. Out of people who lived in different houses, 19% moved from different county within same state. Out of people who lived in different houses, 24% moved from different state. Out of people who lived in different houses, 10% moved from abroad.
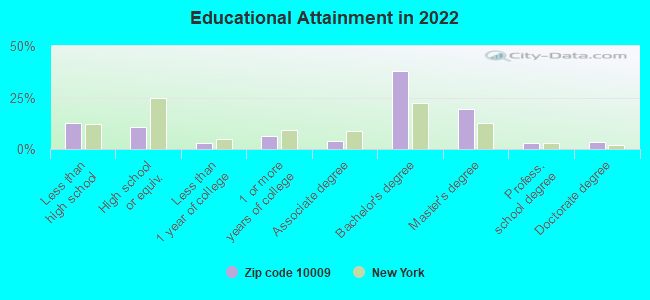
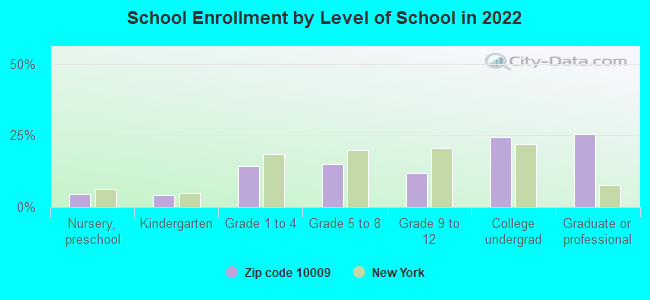
Private vs. public school enrollment:
Students in private schools in grades 1 to 8 (elementary and middle school): 288
Here:
10.0%
New York:
15.6%
Students in private schools in grades 9 to 12 (high school): 154
Here:
13.2%
New York:
15.0%
Students in private undergraduate colleges: 1,417
Here:
57.8%
New York:
39.2%
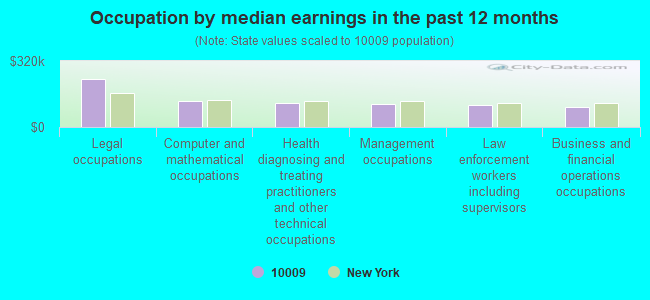
Occupation by median earnings in the past 12 months ($)
231,130Legal occupations
123,872Computer and mathematical occupations
114,794Health diagnosing and treating practitioners and other technical occupations
111,399Management occupations
108,505Law enforcement workers including supervisors
96,316Business and financial operations occupations
Companies with federal contracts located in this zip code:
LIPKA COM, INC (STUYVESANT STATION in NEW YORK, NY) : $40,874 in 5 contractsin 2005
Contracts for Legal Services by Army, U.S. Army Corps of Engineers - civil program financing only Signed by year:2000: $0; 2001: $0; 2002: $0; 2003: $0; 2004: $0; 2005: $40,874; 2006: $0.
Biggest contracts:
$21,584 with Army for Legal Services. Taking place in DC. Signed on 2005-03-17. Completion date: 2005-04-12.
$21,584 with U.S. Army Corps of Engineers - civil program financing only for Legal Services. Taking place in DC. Signed on 2005-03-17. Completion date: 2005-04-12.
$14,116 with Army for Legal Services. Taking place in DC. Signed on 2005-02-17. Completion date: 2005-04-12.
-$8,205, same as above.Signed on 2005-04-26. Completion date: 2005-04-12.
DANGEROUS MUSIC INC (154 E 2ND ST 4TH FLOOR in NEW YORK, NY; small business)
$4,250 with Air Force for Musical Instruments. Signed on 2005-09-27. Completion date: 2005-10-24.
Top industries in this zip code by the number of employees in 2005:
2007 - 2018 National Fire Incident Reporting System (NFIRS) incidents
Based on the data from the years 2007 - 2018 the average number of fires per year is 312. The highest number of fires - 350 took place in 2016, and the least - 211 in 2007. The data has a growing trend.
When looking into fire subcategories, the most reports belonged to: Structure Fires (75.9%), and Outside Fires (18.5%).
Fire incident types reported to NFIRS in Zip Code 10009


 Nearest zip codes: 10003, 10002, 10010, 10016, 10012, 10168.


 Based on the data from the years 2007 - 2018 the average number of fires per year is 312. The highest number of fires - 350 took place in 2016, and the least - 211 in 2007. The data has a growing trend.
 When looking into fire subcategories, the most reports belonged to: Structure Fires (75.9%), and Outside Fires (18.5%).