Housing density: 169 houses/condos per square mile
Median price asked for vacant for-sale houses and condos in 2022 in this county: $275,451.
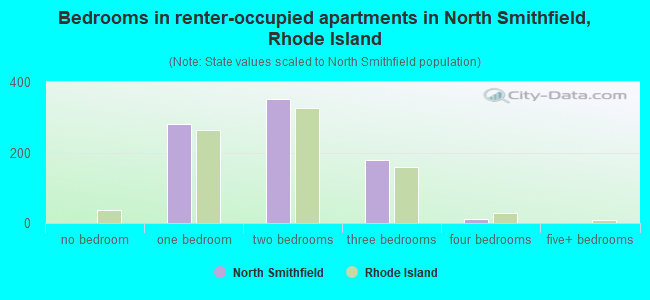
Median contract rent in 2022: $1,145 (lower quartile is $640, upper quartile is $1,623)
Median rent asked for vacant for-rent units in 2022: $1,202
Median gross rent in North Smithfield, RI in 2022: $1,328
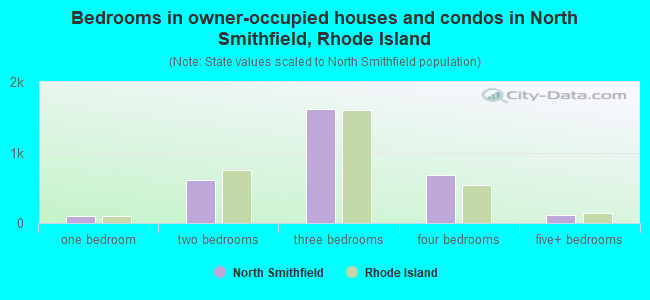
Housing units in North Smithfield with a mortgage: 2,028 (220 second mortgage, 343 home equity loan, 0 both second mortgage and home equity loan) Houses without a mortgage: 797
Compare current foreclosures near North Smithfield, RI:
In family households: 482,061 (90,167 male householders, 59,524 female householders)
98,652 spouses, 176,915 children (166,353 natural, 3,940 adopted, 6,622 stepchildren), 11,252 grandchildren, 7,716 brothers or sisters, 7,800 parents, foster children, 8,986 other relatives, 16,700 non-relatives
In nonfamily households: 116,821 (42,422 male householders (31,930 living alone)), 49,604 female householders (41,173 living alone)), 24,795 nonrelatives
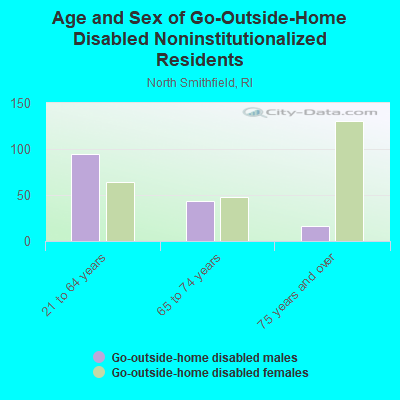
In group quarters: 27,785 (9,688 institutionalized population)
87,776 married couples with children.
48,327 single-parent households (7,463 men, 40,864 women).
85.6% of residents of North Smithfield speak English at home.
0.8% of residents speak Spanish at home (68% speak English very well, 20% speak English well, 12% speak English not well).
13.4% of residents speak other Indo-European language at home (75% speak English very well, 19% speak English well, 5% speak English not well, 1% don't speak English at all).
0.2% of residents speak other language at home (42% speak English very well, 58% speak English not well).
Foreign born population: 436 (3.9%)
(101.1% of them are naturalized citizens)
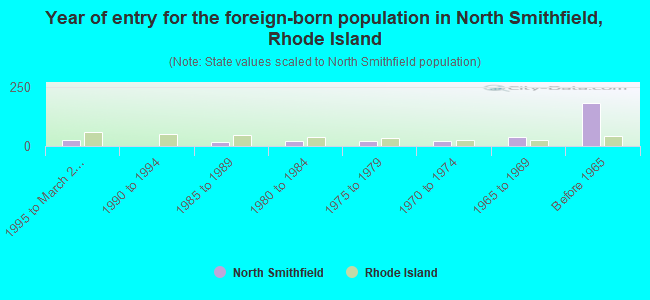
Year of entry for the foreign-born population in North Smithfield, Rhode Island
251995 to March 2000
01990 to 1994
151985 to 1989
211980 to 1984
191975 to 1979
221970 to 1974
391965 to 1969
180Before 1965
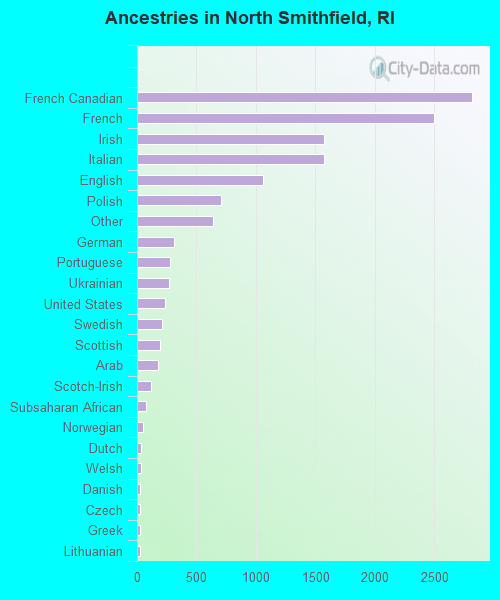
First ancestries reported:
French Canadian: 2,821 (21.7%)
French: 2,501 (19.2%)
Irish: 1,576 (12.1%)
Italian: 1,575 (12.1%)
English: 1,061 (8.1%)
Polish: 704 (5.4%)
Other: 639 (4.9%)
German: 314 (2.4%)
Portuguese: 276 (2.1%)
Ukrainian: 266 (2.0%)
United States: 238 (1.8%)
Swedish: 210 (1.6%)
Scottish: 193 (1.5%)
Arab: 179 (1.4%)
Scotch-Irish: 116 (0.9%)
Subsaharan African: 72 (0.6%)
Norwegian: 47 (0.4%)
Dutch: 35 (0.3%)
Welsh: 31 (0.2%)
Danish: 29 (0.2%)
Czech: 27 (0.2%)
Greek: 27 (0.2%)
Lithuanian: 27 (0.2%)
Russian: 25 (0.2%)
Swiss: 19 (0.1%)
Slovak: 11 (0.08%)
West Indian: 7 (0.05%)
Most common places of birth for foreign-born residents (%):
Canada
North Smithfield:
33.3% (107)
Rhode Island:
3.4% (4,015)
Italy
North Smithfield:
14.0% (45)
Rhode Island:
3.8% (4,502)
Portugal
North Smithfield:
7.2% (23)
Rhode Island:
17.6% (21,016)
Colombia
North Smithfield:
7.2% (23)
Rhode Island:
5.4% (6,496)
United Kingdom
North Smithfield:
6.2% (20)
Rhode Island:
2.6% (3,120)
Other Western Africa
North Smithfield:
6.2% (20)
Rhode Island:
7.0% (8,389)
Other Eastern Europe
North Smithfield:
3.7% (12)
Rhode Island:
0.7% (789)
Middle Africa
North Smithfield:
2.8% (9)
Rhode Island:
0.2% (282)
Panama
North Smithfield:
2.8% (9)
Rhode Island:
0.1% (157)
South Africa
North Smithfield:
2.5% (8)
Rhode Island:
0.1% (137)
Haiti
North Smithfield:
2.2% (7)
Rhode Island:
1.3% (1,557)
France
North Smithfield:
1.9% (6)
Rhode Island:
0.6% (730)
Germany
North Smithfield:
1.9% (6)
Rhode Island:
1.7% (1,982)
Poland
North Smithfield:
1.9% (6)
Rhode Island:
1.2% (1,473)
Cuba
North Smithfield:
1.9% (6)
Rhode Island:
0.4% (422)
Greece
North Smithfield:
1.6% (5)
Rhode Island:
0.9% (1,014)
China, excluding Hong Kong and Taiwan
North Smithfield:
1.6% (5)
Rhode Island:
1.6% (1,954)
Place of birth for U.S.-born residents:
This state: 8,048
Other state: 2,226
Northeast: 1,872
Midwest: 124
South: 138
West: 92
73% of North Smithfield residents lived in the same house 5 years ago. Out of people who lived in different houses, 75% lived in this county. Out of people who lived in different counties, 25% lived in Rhode Island.
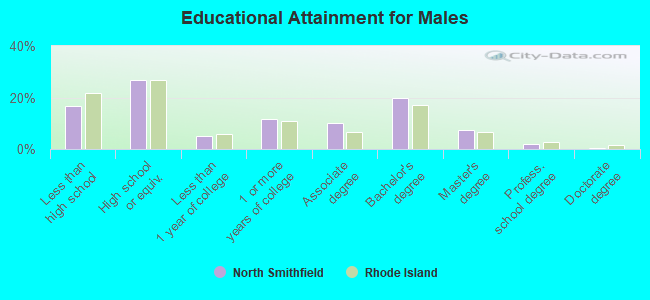
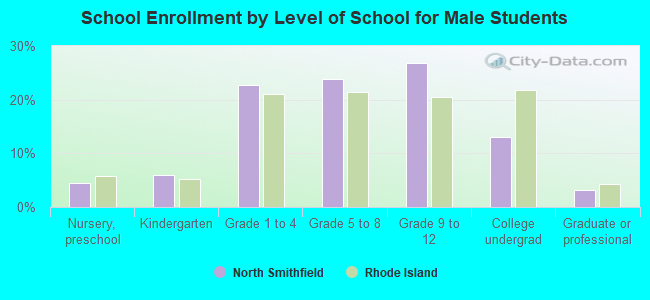
Education attainment for males 25 years and older:
No schooling: 8
Nursery to 4th grade: 0
5th and 6th grade: 15
7th and 8th grade: 183
9th grade: 98
10th grade: 120
11th grade: 47
12th grade, no diploma: 122
High school graduate (or equivalency): 944
Less than 1 year of college: 179
Some college more than 1 year, no degree: 416
Associate degree: 360
Bachelor's degree: 697
Master's degree: 257
Professional school degree: 66
Doctorate degree: 20
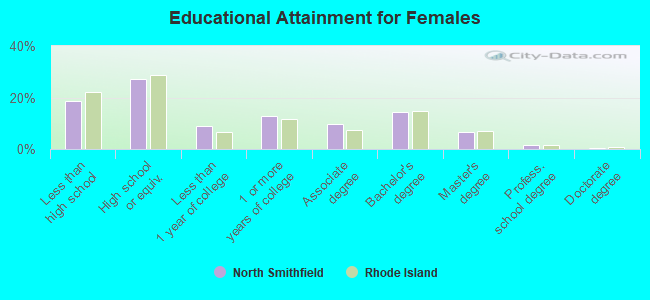
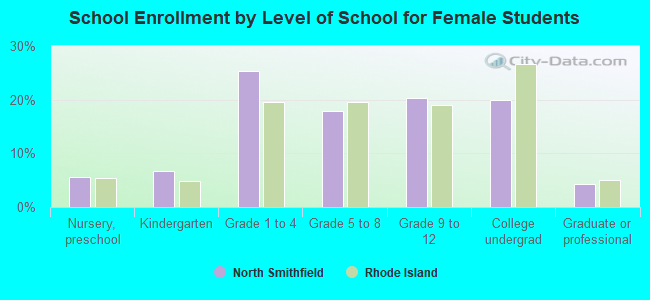
Education attainment for females 25 years and older:
No schooling: 17
Nursery to 4th grade: 6
5th and 6th grade: 86
7th and 8th grade: 177
9th grade: 164
10th grade: 94
11th grade: 105
12th grade, no diploma: 127
High school graduate (or equivalency): 1,126
Less than 1 year of college: 364
Some college more than 1 year, no degree: 532
Associate degree: 396
Bachelor's degree: 592
Master's degree: 270
Professional school degree: 64
Doctorate degree: 24
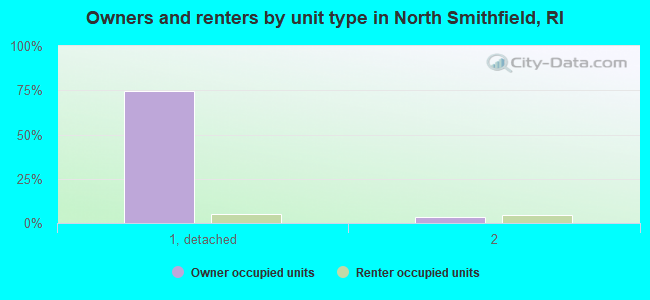
Housing units in structures:
One, detached: 3,231
One, attached: 25
Two: 328
3 or 4: 105
5 to 9: 93
10 to 19: 74
20 to 49: 7
50 or more: 192
Mobile homes: 15
Median worth of mobile homes: $321,477
Housing units lacking complete plumbing facilities: 0.3%