Norwell, MA (Massachusetts) Houses and Residents
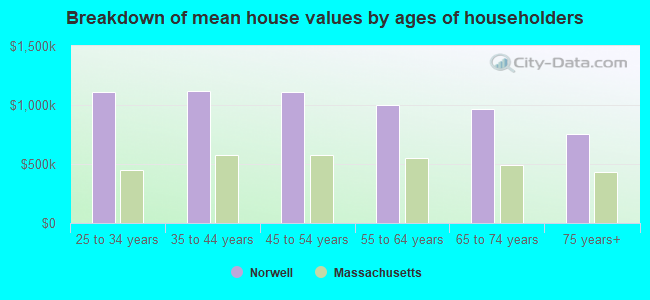
| Norwell: | $1,009,324 |
| Massachusetts: | $534,700 |
Total population: 10,506 (Urban population: 6,564, Rural population: 3,201 (all nonfarm))
Houses: 3,318 (3,250 occupied: 2,991 owner occupied, 259 renter occupied)
| % of renters here: | 8% |
| State: | 38% |
Housing density: 159 houses/condos per square mile
Median price asked for vacant for-sale houses and condos in 2022 in this county: $446,078.
Median contract rent in 2022: $1,307 (lower quartile is $890, upper quartile is over $2,000)
Median gross rent in Norwell, MA in 2022: $1,487
Housing units in Norwell with a mortgage: 2,070 (166 second mortgage, 373 home equity loan, 12 both second mortgage and home equity loan)
Houses without a mortgage: 693
Compare current foreclosures near Norwell, MA:
| Photo | Address | Area | Beds / Baths | Price | Details |
|---|---|---|---|---|---|

|
#1
High St
Norwell, MA 02061
|
1,643 sq. feet
|
1 baths 3 beds |
show details | |

|
#2
Circuit St
Norwell, MA 02061
|
1,773 sq. feet
|
2 baths 3 beds |
show details | |

|
#3
Ridge Hill Rd
Norwell, MA 02061
|
1,825 sq. feet
|
1 baths 3 beds |
show details | |

|
#4
Pine St
Norwell, MA 02061
|
2,036 sq. feet
|
2 baths 3 beds |
show details | |

|
#5
Stetson Shrine Ln
Norwell, MA 02061
|
1,494 sq. feet
|
1 baths 3 beds |
show details | |

|
#6
Park Ave Apt 614
Hull, MA 02045
|
1,109 sq. feet
|
2 baths 2 beds |
$350,000
|
show details |

|
#7
Heritage Ln
Duxbury, MA 02332
|
5,508 sq. feet
|
2 baths 5 beds |
$815,000
|
show details |

|
#8
Johnson Rd
North Weymouth, MA 02191
|
748 sq. feet
|
1 baths 2 beds |
$365,000
|
show details |

|
#9
Porrazzo Rd # 2
Hull, MA 02045
|
1,203 sq. feet
|
2 baths 2 beds |
$339,900
|
show details |

|
#10
Tall Oaks Dr Unit 508
South Weymouth, MA 02190
|
1,300 sq. feet
|
2 baths 2 beds |
$300,000
|
show details |
| Photo | Address | Area | Beds / Baths | Price | Details |
|---|---|---|---|---|---|

|
#11
Church St
Boston, MA 02122
|
3,663 sq. feet
|
3 baths 6 beds |
show details | |

|
#12
Marden Ave # 6
Boston, MA 02124
|
1,639 sq. feet
|
1 baths 3 beds |
show details | |

|
#13
Bloomfield St
Boston, MA 02124
|
2,667 sq. feet
|
2 baths 6 beds |
show details | |

|
#14
Winter St
Hanson, MA 02341
|
1,844 sq. feet
|
3 baths 3 beds |
show details | |

|
#15
Fountain Ln Apt 12
South Weymouth, MA 02190
|
746 sq. feet
|
1 baths 1 beds |
show details | |

|
#16
Commercial St
East Weymouth, MA 02189
|
2,100 sq. feet
|
3 baths 7 beds |
show details | |

|
#17
Ballou St
Quincy, MA 02169
|
1,758 sq. feet
|
1 baths 3 beds |
show details | |

|
#18
S Elm St
West Bridgewater, MA 02379
|
2,546 sq. feet
|
2 baths 4 beds |
show details | |

|
#19
Summer St
Weymouth, MA 02188
|
1,413 sq. feet
|
2 baths 3 beds |
show details | |

|
#20
Great Cedar Dr # 4
Hanson, MA 02341
|
- sq. feet
|
1 baths 2 beds |
show details |
| Photo | Address | Area | Beds / Baths | Price | Details |
|---|---|---|---|---|---|

|
#21
Sunnybank Ave
Rockland, MA 02370
|
963 sq. feet
|
1 baths 2 beds |
show details | |

|
#22
Rockwell Ave
Brockton, MA 02302
|
1,774 sq. feet
|
1 baths 3 beds |
show details | |

|
#23
Cappys Way
Brockton, MA 02302
|
2,128 sq. feet
|
2 baths 4 beds |
show details | |

|
#24
Gay St
Quincy, MA 02169
|
1,330 sq. feet
|
1 baths 4 beds |
show details | |

|
#25
Hubbard Rd
East Bridgewater, MA 02333
|
1,344 sq. feet
|
2 baths 4 beds |
show details | |

|
#26
Barker St
Pembroke, MA 02359
|
3,342 sq. feet
|
3 baths 4 beds |
show details | |

|
#27
Pond St
East Bridgewater, MA 02333
|
864 sq. feet
|
1 baths 2 beds |
show details | |

|
#28
Washington St
Hyde Park, MA 02136
|
2,980 sq. feet
|
3 baths 5 beds |
show details | |

|
#29
Lenox St
Brockton, MA 02301
|
1,548 sq. feet
|
1 baths 2 beds |
show details | |

|
#30
Grand View Ave
Quincy, MA 02170
|
5,036 sq. feet
|
3 baths 7 beds |
show details |
| Photo | Address | Area | Beds / Baths | Price | Details |
|---|---|---|---|---|---|

|
#31
Dorr St
Randolph, MA 02368
|
1,558 sq. feet
|
1 baths 3 beds |
show details | |

|
#32
Magoun Ave
Brockton, MA 02301
|
868 sq. feet
|
1 baths 3 beds |
show details | |

|
#33
Charles St
Randolph, MA 02368
|
984 sq. feet
|
1 baths 2 beds |
show details | |

|
#34
Tony Ter
Bridgewater, MA 02324
|
1,196 sq. feet
|
2 baths 3 beds |
show details | |

|
#35
Chestnut St
Randolph, MA 02368
|
1,512 sq. feet
|
2 baths 3 beds |
show details | |

|
#36
Lafayette St
Randolph, MA 02368
|
1,936 sq. feet
|
1 baths 3 beds |
show details | |

|
#37
Belcher Ave
Brockton, MA 02301
|
2,876 sq. feet
|
2 baths 6 beds |
show details | |

|
#38
Lawson St
Randolph, MA 02368
|
2,630 sq. feet
|
3 baths 3 beds |
show details | |

|
#39
Morse St
Randolph, MA 02368
|
1,939 sq. feet
|
2 baths 3 beds |
show details | |

|
#40
Hillberg Ave
Brockton, MA 02301
|
1,896 sq. feet
|
1 baths 3 beds |
show details |
| Photo | Address | Area | Beds / Baths | Price | Details |
|---|---|---|---|---|---|

|
#41
West St
Randolph, MA 02368
|
1,476 sq. feet
|
1 baths 4 beds |
show details | |

|
#42
Eagle Rock Rd
Randolph, MA 02368
|
1,724 sq. feet
|
1 baths 4 beds |
show details | |

|
#43
Plymouth St
Middleboro, MA 02346
|
1,814 sq. feet
|
1 baths 2 beds |
show details | |

|
#44
Willard St Unit 402
Quincy, MA 02169
|
1,198 sq. feet
|
2 baths 2 beds |
show details | |

|
#45
Harlan Ter
Brockton, MA 02301
|
2,268 sq. feet
|
2 baths 3 beds |
show details | |

|
#46
Green Street Ext
Brockton, MA 02301
|
1,361 sq. feet
|
1 baths 3 beds |
show details | |

|
#47
Pond Ln
Randolph, MA 02368
|
1,992 sq. feet
|
2 baths 3 beds |
show details | |

|
#48
Tucker Dr
Brockton, MA 02301
|
1,040 sq. feet
|
1 baths 3 beds |
show details | |

|
#49
Tucker Dr # H-61
Brockton, MA 02301
|
1,040 sq. feet
|
1 baths 3 beds |
show details | |

|
Check over 1 million property listings on Foreclosure.com!
|
browse all offers | |||
Latest news about housing in Norwell, MA collected exclusively by city-data.com from local newspapers, TV, and radio stations

 | Nicer house in Pembroke or hold out for Norwell scituate duxbury? (72 replies) |
| How Much Massachusetts Households Make Per Year: Census Data (37 replies) |
| 2023 Real Estate Observations (5278 replies) |
| 2021 Real Estate Observations (1729 replies) |
| Under $250k any Massachusetts single family house with yard (117 replies) |
| Norwell, Cohasset, Scituate or Hanover? (26 replies) |

Household type by relationship:
Households: 483,098- In family households: 417,329 (86,307 male householders, 41,618 female householders)
97,089 spouses, 154,870 children (146,729 natural, 3,391 adopted, 4,750 stepchildren), 8,780 grandchildren, 4,455 brothers or sisters, 5,200 parents, foster children, 5,123 other relatives, 10,196 non-relatives
- In nonfamily households: 65,769 (22,929 male householders (17,306 living alone)), 30,272 female householders (25,724 living alone)), 12,568 nonrelatives
- In group quarters: 11,821 (7,645 institutionalized population)
92,167 married couples with children.
24,193 single-parent households (4,628 men, 19,565 women).
94.7% of residents of Norwell speak English at home.
0.6% of residents speak Spanish at home (56% speak English very well, 9% speak English well, 35% speak English not well).
3.2% of residents speak other Indo-European language at home (70% speak English very well, 22% speak English well, 9% speak English not well).
1.1% of residents speak Asian or Pacific Island language at home (83% speak English very well, 4% speak English well, 13% speak English not well).
0.3% of residents speak other language at home (100% speak English very well).
Foreign born population: 666 (6.0%)
(72.2% of them are naturalized citizens)
| Here: | 7.9 |
| State: | 6.5 |
| Here: | 3.0 |
| State: | 4.0 |
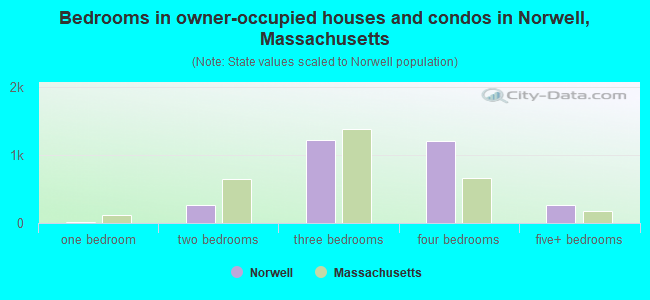
- Bedrooms in owner-occupied houses and condos in Norwell, Massachusetts
- 0no bedroom
- 161 bedroom
- 2692 bedrooms
- 1,2233 bedrooms
- 1,2134 bedrooms
- 2705+ bedrooms
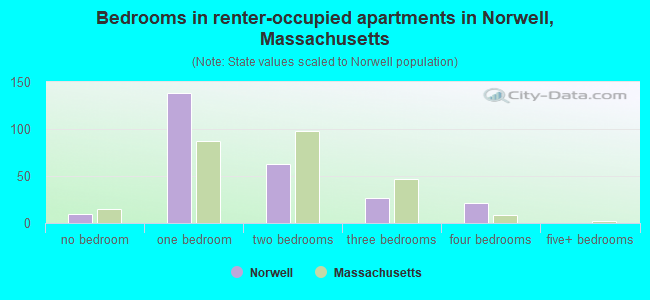
- Bedrooms in renter-occupied apartments in Norwell, Massachusetts
- 10no bedroom
- 1381 bedroom
- 632 bedrooms
- 273 bedrooms
- 214 bedrooms
- 05+ bedrooms
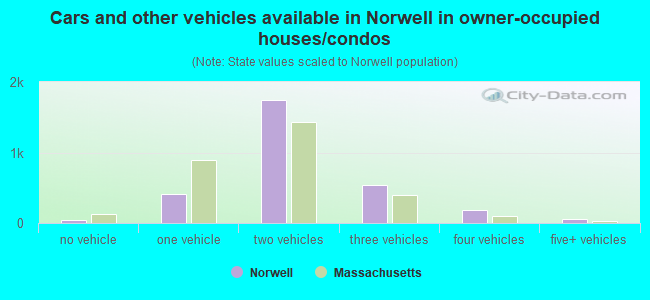
- Cars and other vehicles available in Norwell in owner-occupied houses/condos
- 42no vehicle
- 4181 vehicle
- 1,7502 vehicles
- 5373 vehicles
- 1854 vehicles
- 595+ vehicles
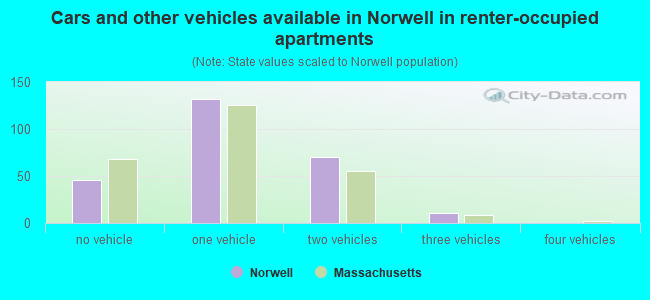
- Cars and other vehicles available in Norwell in renter-occupied apartments
- 46no vehicle
- 1321 vehicle
- 702 vehicles
- 113 vehicles
- 04 vehicles
- 05+ vehicles
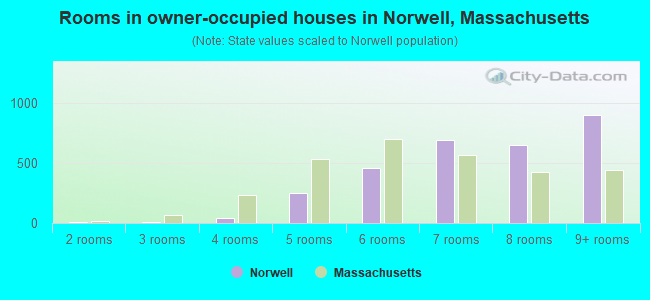
- Rooms in owner-occupied houses in Norwell, Massachusetts
- 01 room
- 52 rooms
- 53 rooms
- 394 rooms
- 2465 rooms
- 4606 rooms
- 6887 rooms
- 6508 rooms
- 8989+ rooms
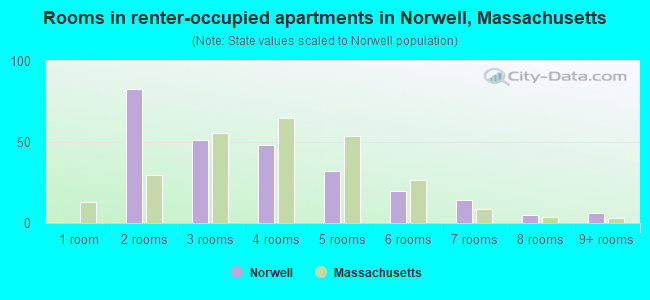
- Rooms in renter-occupied apartments in Norwell, Massachusetts
- 01 room
- 832 rooms
- 513 rooms
- 484 rooms
- 325 rooms
- 206 rooms
- 147 rooms
- 58 rooms
- 69+ rooms
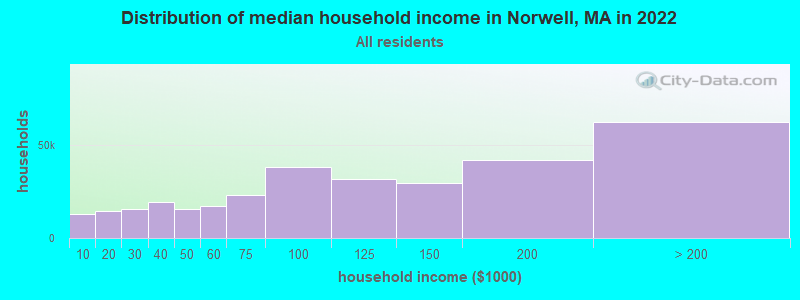
Norwell, MA household income distribution

- 12,985Less than $10,000
- 14,597$10,000 to $19,999
- 15,752$20,000 to $29,999
- 19,358$30,000 to $39,999
- 15,360$40,000 to $49,999
- 17,401$50,000 to $59,999
- 22,958$60,000 to $74,999
- 38,209$75,000 to $99,999
- 31,913$100,000 to $124,999
- 29,610$125,000 to $149,999
- 42,089$150,000 to $199,999
- 62,261$200,000 or more
Percentage of workers working in this county: 52.2%
Number of people working at home: 954 (17.0% of all workers)
Travel time to work (commute)
- Less than 5 minutes: 106
- 5 to 9 minutes: 303
- 10 to 14 minutes: 522
- 15 to 19 minutes: 466
- 20 to 24 minutes: 532
- 25 to 29 minutes: 153
- 30 to 34 minutes: 521
- 35 to 39 minutes: 174
- 40 to 44 minutes: 128
- 45 to 59 minutes: 637
- 60 to 89 minutes: 842
- 90 or more minutes: 181
Means of transportation to work:
- Drove a car alone: 3,785 (78.4%)
- Carpooled: 343 (7.1%)
- Bus or trolley bus: 22 (0.5%)
- Streetcar or trolley car: 14 (0.3%)
- Subway or elevated: 92 (1.9%)
- Railroad: 47 (1.0%)
- Ferryboat: 168 (3.5%)
- Bicycle: 6 (0.1%)
- Walked: 73 (1.5%)
- Other means: 15 (0.3%)
- Worked at home: 260 (5.4%)
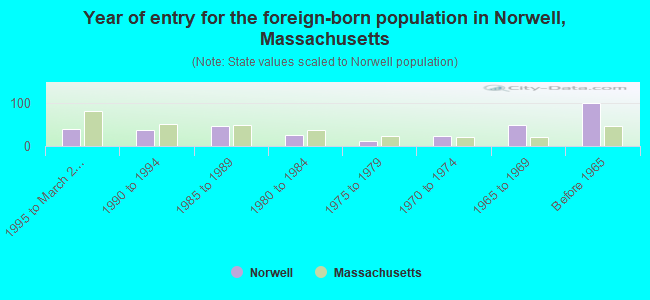
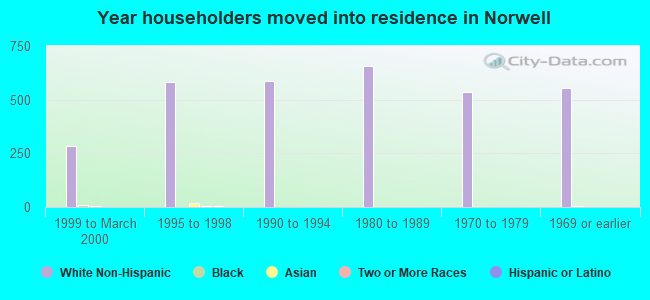
- Year of entry for the foreign-born population in Norwell, Massachusetts
- 401995 to March 2000
- 381990 to 1994
- 471985 to 1989
- 251980 to 1984
- 111975 to 1979
- 231970 to 1974
- 491965 to 1969
- 99Before 1965
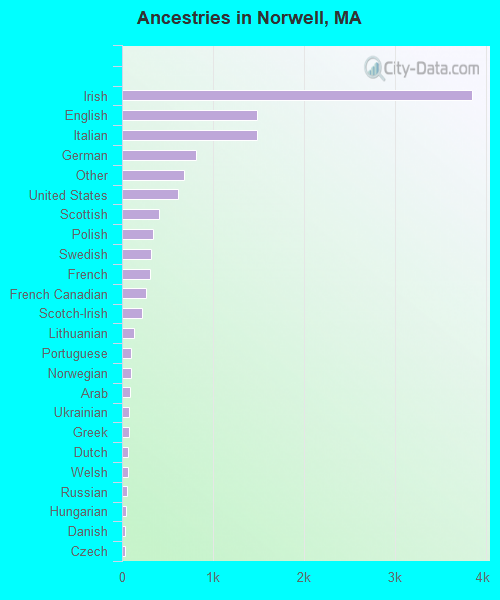
First ancestries reported:
- Irish: 3,844 (32.8%)
- English: 1,489 (12.7%)
- Italian: 1,485 (12.7%)
- German: 815 (7.0%)
- Other: 678 (5.8%)
- United States: 613 (5.2%)
- Scottish: 402 (3.4%)
- Polish: 345 (2.9%)
- Swedish: 314 (2.7%)
- French: 313 (2.7%)
- French Canadian: 263 (2.2%)
- Scotch-Irish: 217 (1.9%)
- Lithuanian: 134 (1.1%)
- Portuguese: 102 (0.9%)
- Norwegian: 100 (0.9%)
- Arab: 89 (0.8%)
- Ukrainian: 81 (0.7%)
- Greek: 72 (0.6%)
- Dutch: 68 (0.6%)
- Welsh: 65 (0.6%)
- Russian: 51 (0.4%)
- Hungarian: 39 (0.3%)
- Danish: 37 (0.3%)
- Czech: 36 (0.3%)
- Swiss: 34 (0.3%)
- Subsaharan African: 11 (0.09%)
- Slovak: 5 (0.04%)
Most common places of birth for foreign-born residents (%):
| Norwell: | 18.1% (60) |
| Massachusetts: | 2.3% (17,987) |
| Norwell: | 17.5% (58) |
| Massachusetts: | 1.0% (7,414) |
| Norwell: | 9.9% (33) |
| Massachusetts: | 5.2% (40,247) |
| Norwell: | 8.1% (27) |
| Massachusetts: | 3.6% (28,086) |
| Norwell: | 6.6% (22) |
| Massachusetts: | 3.3% (25,403) |
| Norwell: | 5.4% (18) |
| Massachusetts: | 1.8% (13,543) |
| Norwell: | 4.2% (14) |
| Massachusetts: | 3.7% (28,319) |
| Norwell: | 3.6% (12) |
| Massachusetts: | 0.4% (3,051) |
| Norwell: | 3.6% (12) |
| Massachusetts: | 1.9% (14,883) |
| Norwell: | 3.6% (12) |
| Massachusetts: | 1.7% (13,456) |
| Norwell: | 3.6% (12) |
| Massachusetts: | 1.0% (7,867) |
| Norwell: | 2.4% (8) |
| Massachusetts: | 1.1% (8,754) |
| Norwell: | 2.4% (8) |
| Massachusetts: | 4.7% (36,669) |
| Norwell: | 2.1% (7) |
| Massachusetts: | 0.3% (1,943) |
| Norwell: | 2.1% (7) |
| Massachusetts: | 1.6% (12,350) |
| Norwell: | 1.8% (6) |
| Massachusetts: | 0.3% (2,242) |
| Norwell: | 1.8% (6) |
| Massachusetts: | 0.2% (1,855) |
| Norwell: | 1.5% (5) |
| Massachusetts: | 0.5% (3,810) |
| Norwell: | 1.5% (5) |
| Massachusetts: | 0.5% (3,834) |
Place of birth for U.S.-born residents:
- This state: 7,914
- Other state: 1,482
- Northeast: 922
- Midwest: 240
- South: 224
- West: 96
72% of Norwell residents lived in the same house 5 years ago.
Out of people who lived in different houses, 45% lived in this county.
Out of people who lived in different counties, 72% lived in Massachusetts.
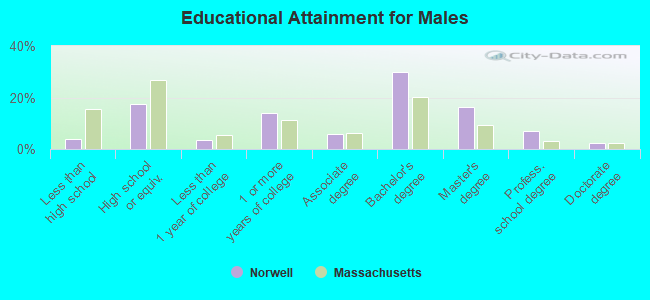
Education attainment for males 25 years and older:
- No schooling: 5
- Nursery to 4th grade: 0
- 5th and 6th grade: 6
- 7th and 8th grade: 16
- 9th grade: 14
- 10th grade: 18
- 11th grade: 11
- 12th grade, no diploma: 52
- High school graduate (or equivalency): 532
- Less than 1 year of college: 103
- Some college more than 1 year, no degree: 434
- Associate degree: 179
- Bachelor's degree: 922
- Master's degree: 495
- Professional school degree: 210
- Doctorate degree: 74
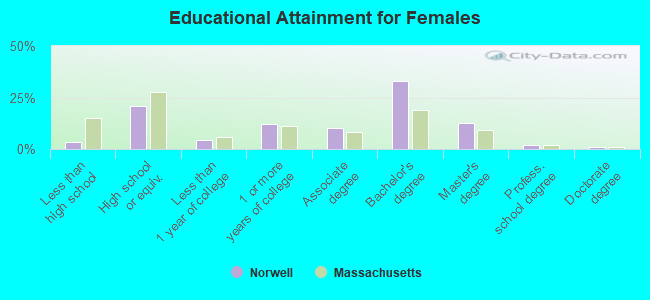
Education attainment for females 25 years and older:
- No schooling: 5
- Nursery to 4th grade: 0
- 5th and 6th grade: 0
- 7th and 8th grade: 27
- 9th grade: 12
- 10th grade: 5
- 11th grade: 37
- 12th grade, no diploma: 35
- High school graduate (or equivalency): 727
- Less than 1 year of college: 149
- Some college more than 1 year, no degree: 431
- Associate degree: 361
- Bachelor's degree: 1,158
- Master's degree: 444
- Professional school degree: 72
- Doctorate degree: 30
Housing units in structures:
- One, detached: 3,085
- One, attached: 32
- Two: 35
- 3 or 4: 41
- 5 to 9: 33
- 10 to 19: 36
- 50 or more: 13
- Mobile homes: 43
Median worth of mobile homes: $153,000
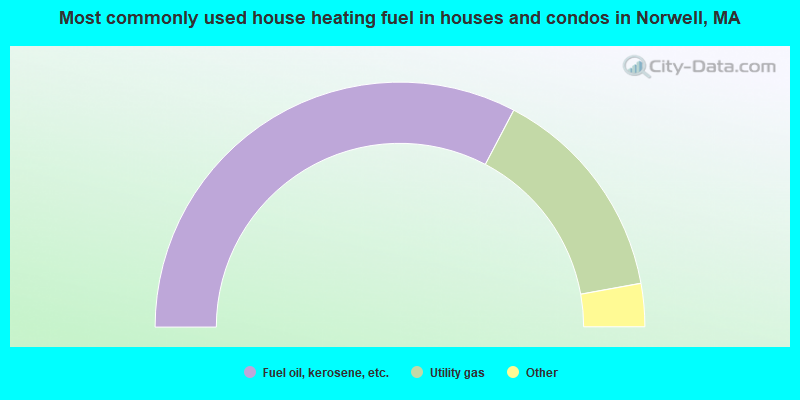
- 65.4%Fuel oil, kerosene, etc.
- 28.9%Utility gas
- 2.8%Electricity
- 1.9%Bottled, tank, or LP gas
- 1.0%Wood
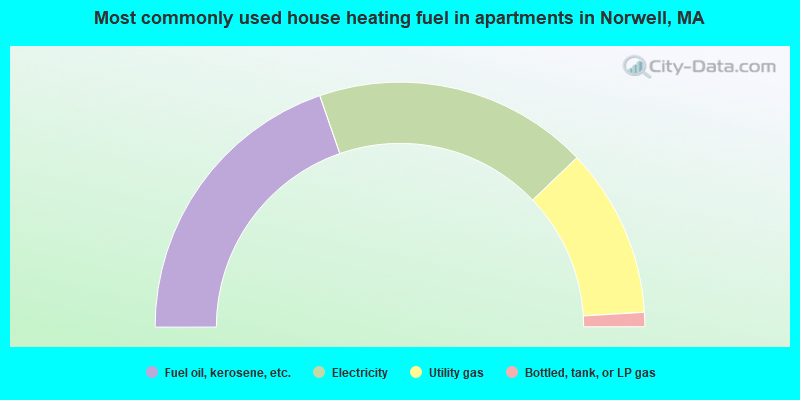
- 39.4%Fuel oil, kerosene, etc.
- 36.3%Electricity
- 22.4%Utility gas
- 1.9%Bottled, tank, or LP gas
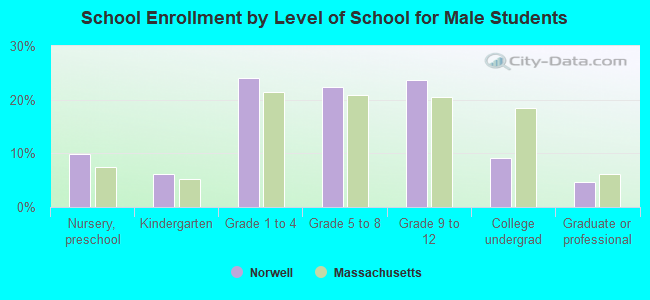
Private vs. public school enrollment:
| Here: | 4.3% |
| Massachusetts: | 10.8% |
| Here: | 12.9% |
| Massachusetts: | 12.2% |
| Here: | 51.6% |
| Massachusetts: | 48.2% |