Numidia, PA (Pennsylvania) Houses and Residents
| Numidia: | $214,785 |
| Pennsylvania: | $245,500 |
Total population: 244 (Urban population: 0, Rural population: 265 (9 farm, 256 nonfarm))
Houses: 156 (138 occupied: 102 owner occupied, 36 renter occupied)
| % of renters here: | 26% |
| State: | 31% |
Housing density: 147 houses/condos per square mile
Median price asked for vacant for-sale houses and condos in 2022 in this county: $112,898.
Median contract rent in 2022: $596 (lower quartile is $569, upper quartile is $1,329)
Median rent asked for vacant for-rent units in 2022: $381
Median gross rent in Numidia, PA in 2022: $795
Housing units in Numidia with a mortgage: 47 (5 second mortgage, 0 home equity loan, 5 both second mortgage and home equity loan)
Houses without a mortgage: 0
Median household income for houses/condos with a mortgage: $95,114
Median household income for apartments without a mortgage: $50,433
Median monthly housing costs: $874
Compare current foreclosures near Numidia, PA:
| Photo | Address | Area | Beds / Baths | Price | Details |
|---|---|---|---|---|---|

|
#1
Avenue F
Danville, PA 17821
|
1,600 sq. feet
|
2 baths 3 beds |
$279,500
|
show details |

|
#2
Ann St
Pottsville, PA 17901
|
1,512 sq. feet
|
2 baths 3 beds |
$3,333
|
show details |

|
#3
Penn St
Minersville, PA 17954
|
1,798 sq. feet
|
1 baths 5 beds |
$53,453
|
show details |

|
#4
North St
Minersville, PA 17954
|
1,479 sq. feet
|
1 baths 4 beds |
$49,885
|
show details |

|
#5
Walnut St
Ashland, PA 17921
|
1,512 sq. feet
|
1 baths 3 beds |
$27,257
|
show details |

|
#6
East Center Street
Mahanoy City, PA 17948
|
1,272 sq. feet
|
1 baths 3 beds |
$25,291
|
show details |

|
#7
W Spruce St
Mahanoy City, PA 17948
|
1,408 sq. feet
|
1 baths 4 beds |
$35,163
|
show details |

|
#8
Virginia Ave
Shenandoah, PA 17976
|
1,311 sq. feet
|
1 baths 3 beds |
$6,313
|
show details |

|
#9
Mill Street
Saint Clair, PA 17970
|
1,419 sq. feet
|
1 baths 3 beds |
$93,483
|
show details |

|
#10
Lytle St
Minersville, PA 17954
|
1,970 sq. feet
|
1 baths 3 beds |
$37,137
|
show details |
| Photo | Address | Area | Beds / Baths | Price | Details |
|---|---|---|---|---|---|

|
#11
Arnots
Saint Clair, PA 17970
|
1,718 sq. feet
|
1 baths 5 beds |
$3,002
|
show details |

|
#12
S 2nd St
Frackville, PA 17931
|
1,260 sq. feet
|
1 baths 3 beds |
$13,246
|
show details |

|
#13
W Mount Vernon St
Shenandoah, PA 17976
|
900 sq. feet
|
1 baths 2 beds |
$6,216
|
show details |

|
#14
S Lehigh Ave
Frackville, PA 17931
|
1,696 sq. feet
|
1 baths 3 beds |
$67,664
|
show details |

|
#15
E Cameron St
Shamokin, PA 17872
|
1,072 sq. feet
|
1 baths 3 beds |
show details | |

|
#16
5th St
Nescopeck, PA 18635
|
- sq. feet
|
1 baths 3 beds |
show details | |

|
#17
Cherry St
Bloomsburg, PA 17815
|
1,488 sq. feet
|
1 baths 3 beds |
show details | |

|
#18
W Library Ave
Danville, PA 17821
|
1,191 sq. feet
|
1 baths 2 beds |
show details | |

|
#19
S Mill St
Saint Clair, PA 17970
|
1,419 sq. feet
|
1 baths 3 beds |
show details | |

|
#20
Broad St
Saint Clair, PA 17970
|
1,536 sq. feet
|
1 baths 2 beds |
show details |
| Photo | Address | Area | Beds / Baths | Price | Details |
|---|---|---|---|---|---|

|
#21
Main St
Orangeville, PA 17859
|
- sq. feet
|
2 baths 4 beds |
show details | |

|
#22
Spruce St
Kulpmont, PA 17834
|
- sq. feet
|
1 baths 3 beds |
show details | |

|
#23
Martzville Rd
Berwick, PA 18603
|
1,865 sq. feet
|
1 baths 2 beds |
show details | |

|
#24
Shamokin St
Ashland, PA 17921
|
3,041 sq. feet
|
1 baths 3 beds |
show details | |

|
#25
Valley Rd
Pottsville, PA 17901
|
1,195 sq. feet
|
1 baths 2 beds |
show details | |

|
#26
Landers Ct
Ashland, PA 17921
|
2,082 sq. feet
|
1 baths 3 beds |
show details | |

|
#27
N 4th St
Minersville, PA 17954
|
1,352 sq. feet
|
1 baths 3 beds |
show details | |

|
#28
Airport Rd
Ashland, PA 17921
|
1,520 sq. feet
|
1 baths 3 beds |
show details | |

|
#29
E Coal St
Shenandoah, PA 17976
|
1,140 sq. feet
|
1 baths 3 beds |
show details | |

|
#30
E Centre St
Mahanoy City, PA 17948
|
1,272 sq. feet
|
1 baths 3 beds |
show details |
| Photo | Address | Area | Beds / Baths | Price | Details |
|---|---|---|---|---|---|

|
#31
N Broad Mountain Ave
Frackville, PA 17931
|
- sq. feet
|
- baths - beds |
$45,226
|
show details |

|
#32
Forest Ln
Pottsville, PA 17901
|
2,016 sq. feet
|
2 baths 3 beds |
show details | |

|
#33
E Coal St
Shenandoah, PA 17976
|
3,502 sq. feet
|
1 baths 3 beds |
show details | |

|
#34
W Oak St
Shenandoah, PA 17976
|
1,806 sq. feet
|
1 baths 5 beds |
show details | |

|
#35
W Wood St
Coal Township, PA 17866
|
896 sq. feet
|
1 baths 1 beds |
show details | |

|
#36
Hedge Row
Bloomsburg, PA 17815
|
1,974 sq. feet
|
2 baths 3 beds |
show details | |

|
#37
W Arlington St
Shenandoah, PA 17976
|
- sq. feet
|
- baths - beds |
$3,382
|
show details |

|
#38
N Broad Mountain Ave
Frackville, PA 17931
|
1,440 sq. feet
|
1 baths 3 beds |
show details | |

|
#39
Florida Ave
Shenandoah, PA 17976
|
1,224 sq. feet
|
1 baths 3 beds |
show details | |

|
#40
N Centre St
Pottsville, PA 17901
|
- sq. feet
|
- baths - beds |
$7,289
|
show details |
| Photo | Address | Area | Beds / Baths | Price | Details |
|---|---|---|---|---|---|

|
#41
Arnot St
Saint Clair, PA 17970
|
1,718 sq. feet
|
1 baths 5 beds |
show details | |

|
#42
Bunting St
Pottsville, PA 17901
|
1,454 sq. feet
|
1 baths 2 beds |
show details | |

|
#43
W Norwegian St
Pottsville, PA 17901
|
1,394 sq. feet
|
1 baths 3 beds |
show details | |

|
#44
Elk Ave
Pottsville, PA 17901
|
1,120 sq. feet
|
1 baths 2 beds |
show details | |

|
#45
E Saylor St
Mount Carmel, PA 17851
|
- sq. feet
|
1 baths 3 beds |
show details | |

|
#46
Trenton
Mahanoy City, PA 17948
|
928 sq. feet
|
1 baths 2 beds |
show details | |

|
#47
S Mill St
Saint Clair, PA 17970
|
- sq. feet
|
- baths - beds |
$3,821
|
show details |

|
#48
S Front St
Saint Clair, PA 17970
|
- sq. feet
|
- baths - beds |
$3,113
|
show details |

|
#49
Ridge Rd
Klingerstown, PA 17941
|
1,248 sq. feet
|
1 baths 3 beds |
show details | |

|
Check over 1 million property listings on Foreclosure.com!
|
browse all offers | |||

Latest news about housing in Numidia, PA collected exclusively by city-data.com from local newspapers, TV, and radio stations

 | Places to hike or snowshoe around Schuylkill County? (3 replies) |
| Columbia County voted best rural place to live (12 replies) |

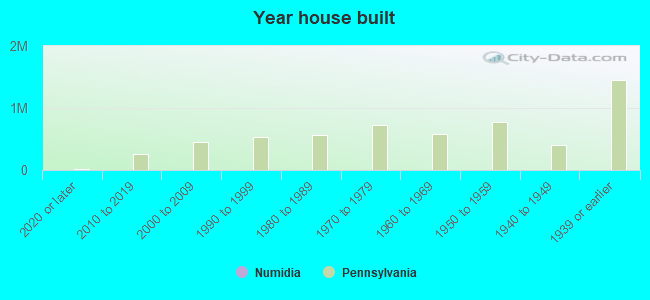
Median year apartment built: 1977
Household type by relationship:
Households: 321- Male householders: 84 (7 living alone), Female householders: 51 (21 living alone)
89 spouses (89 opposite-sex spouses), 2 unmarried partners, (0 opposite-sex unmarried partners), 77 children (73 natural, 0 adopted, 3 stepchildren), 0 grandchildren, 0 brothers or sisters, 2 parents, 0 foster children, 0 other relatives, 10 non-relatives
Size of family households: 58 2-persons, 17 3-persons, 3 4-persons, 15 5-persons.
Size of nonfamily households: 30 1-person, 14 2-persons.
58 married couples with children.
0 single-parent households (0 men, 0 women).
99.7% of residents of Numidia speak English at home.
| Here: | 6.1 |
| State: | 6.8 |
| Here: | 5.0 |
| State: | 4.3 |
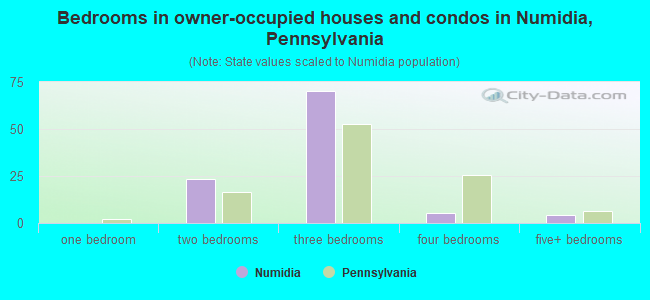
- Bedrooms in owner-occupied houses and condos in Numidia, Pennsylvania
- 0no bedroom
- 01 bedroom
- 232 bedrooms
- 703 bedrooms
- 54 bedrooms
- 45+ bedrooms
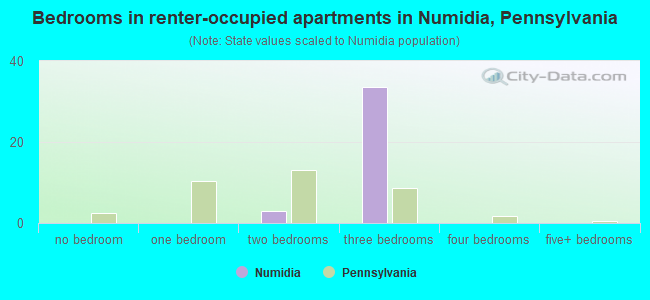
- Bedrooms in renter-occupied apartments in Numidia, Pennsylvania
- 0no bedroom
- 01 bedroom
- 32 bedrooms
- 343 bedrooms
- 04 bedrooms
- 05+ bedrooms
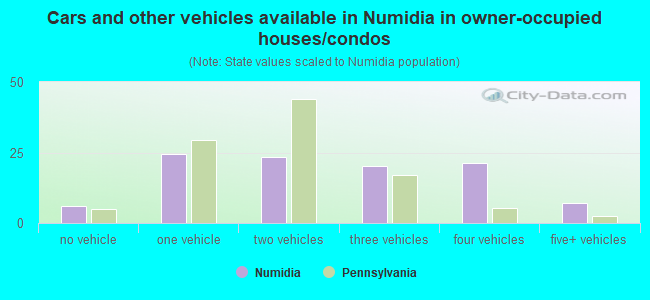
- Cars and other vehicles available in Numidia in owner-occupied houses/condos
- 6no vehicle
- 241 vehicle
- 232 vehicles
- 203 vehicles
- 214 vehicles
- 75+ vehicles
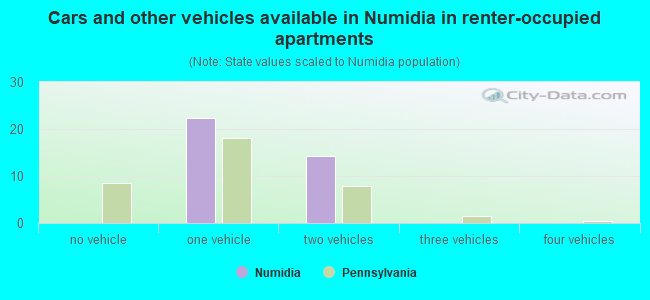
- Cars and other vehicles available in Numidia in renter-occupied apartments
- 0no vehicle
- 221 vehicle
- 142 vehicles
- 03 vehicles
- 04 vehicles
- 05+ vehicles
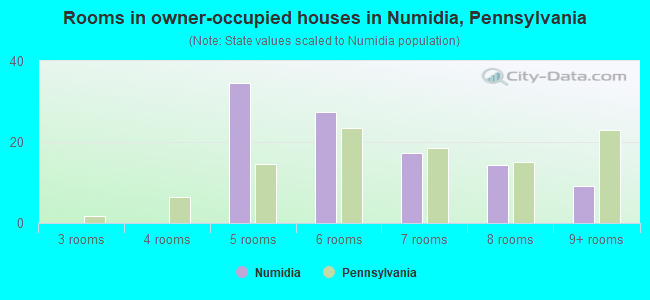
- Rooms in owner-occupied houses in Numidia, Pennsylvania
- 01 room
- 02 rooms
- 03 rooms
- 04 rooms
- 355 rooms
- 286 rooms
- 177 rooms
- 148 rooms
- 99+ rooms
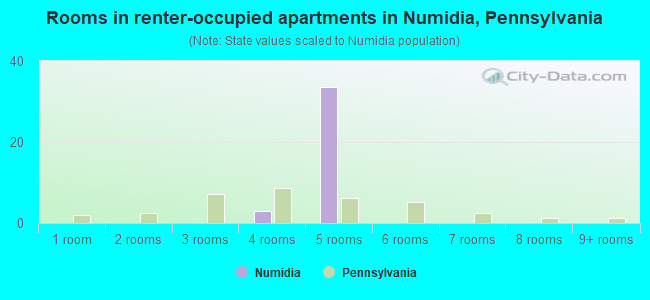
- Rooms in renter-occupied apartments in Numidia, Pennsylvania
- 01 room
- 02 rooms
- 03 rooms
- 34 rooms
- 345 rooms
- 06 rooms
- 07 rooms
- 08 rooms
- 09+ rooms
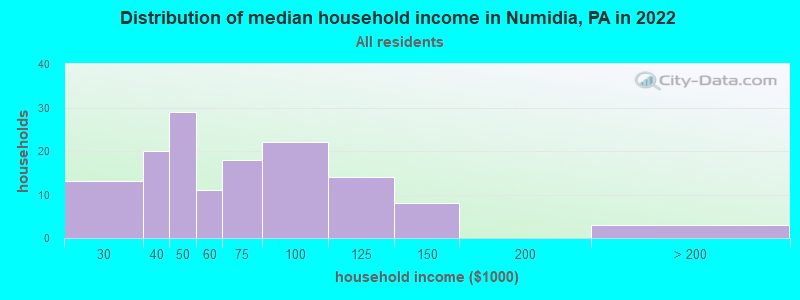
Numidia, PA household income distribution

- 13$20,000 to $29,999
- 20$30,000 to $39,999
- 29$40,000 to $49,999
- 11$50,000 to $59,999
- 18$60,000 to $74,999
- 22$75,000 to $99,999
- 14$100,000 to $124,999
- 8$125,000 to $149,999
- 3$200,000 or more
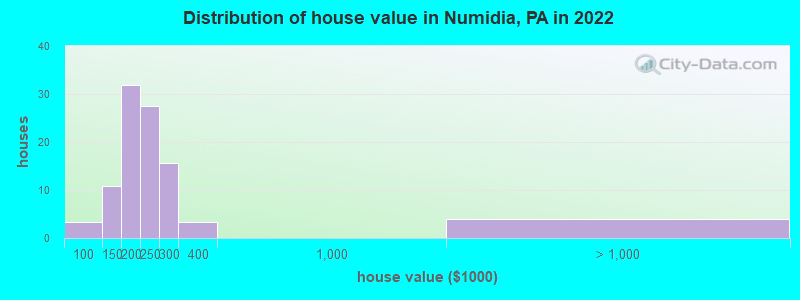
Home value of owner - occupied houses in 2022 in Numidia, PA
-
- 3$90,000 to $99,999
- 1$100,000 to $124,999
- 9$125,000 to $149,999
- 26$150,000 to $174,999
- 5$175,000 to $199,999
- 27$200,000 to $249,999
- 15$250,000 to $299,999
- 3$300,000 to $399,999
- 3$2,000,000 or more
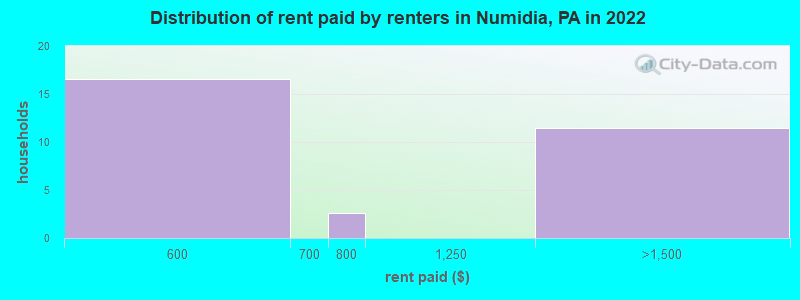
Rent paid by renters in 2022 in Numidia, PA
-
- 16$550 to $599
- 2$700 to $749
- 11$1,250 to $1,499
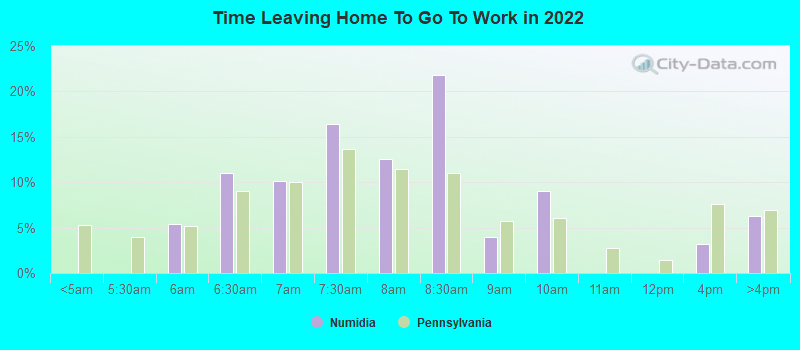
Percentage of workers working in this county: 47.9%
Number of people working at home: 19 (13.4% of all workers)
Travel time to work (commute)
- Less than 5 minutes: 0
- 5 to 9 minutes: 2
- 10 to 14 minutes: 0
- 15 to 19 minutes: 23
- 20 to 24 minutes: 17
- 25 to 29 minutes: 23
- 30 to 34 minutes: 33
- 35 to 39 minutes: 3
- 40 to 44 minutes: 13
- 45 to 59 minutes: 3
- 60 to 89 minutes: 0
- 90 or more minutes: 0
Means of transportation to work:
- Drove a car alone: 102 (86.4%)
- Carpooled: 13 (11.0%)
- Walked: 2 (1.7%)
- Other means: 1 (0.8%)
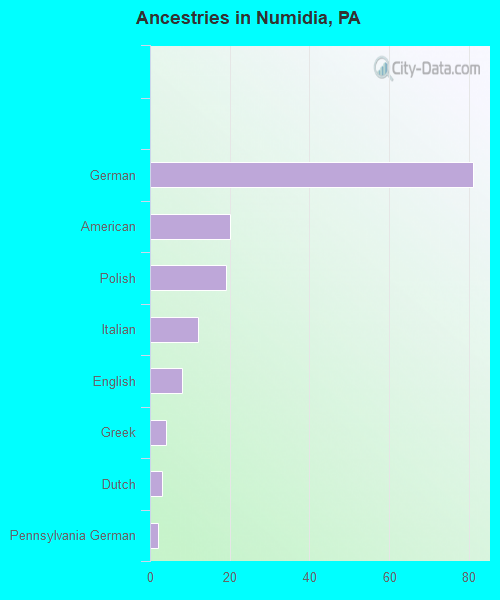
First ancestries reported:
- German: 81 (51.7%)
- American: 20 (12.8%)
- Polish: 19 (12.1%)
- Italian: 12 (7.7%)
- English: 8 (5.1%)
- Greek: 4 (2.6%)
- Dutch: 3 (1.9%)
- Pennsylvania German: 2 (1.3%)
Place of birth for U.S.-born residents:
- This state: 263
- Other state: 45
- Northeast: 35
- Midwest: 0
- South: 6
- West: 3
92.0% of Numidia residents lived in the same house 1 years ago.
Out of people who lived in different houses, 50.0% lived in this county.
| Numidia: | 92.0% |
| State average: | 89.3% |
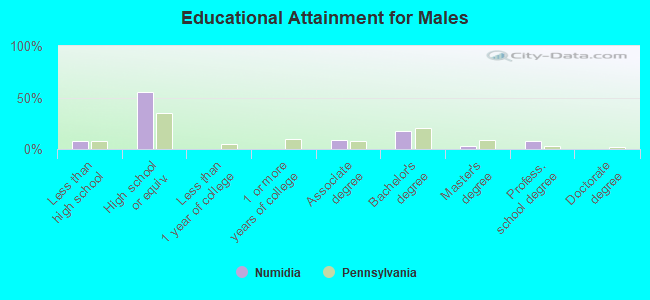
Education attainment for males 25 years and older:
- No schooling: 0
- Nursery to 4th grade: 0
- 5th and 6th grade: 0
- 7th and 8th grade: 0
- 9th grade: 7
- 10th grade: 0
- 11th grade: 0
- 12th grade, no diploma: 2
- High school graduate (or equivalency): 66
- Less than 1 year of college: 0
- Some college more than 1 year, no degree: 0
- Associate degree: 10
- Bachelor's degree: 21
- Master's degree: 4
- Professional school degree: 9
- Doctorate degree: 0
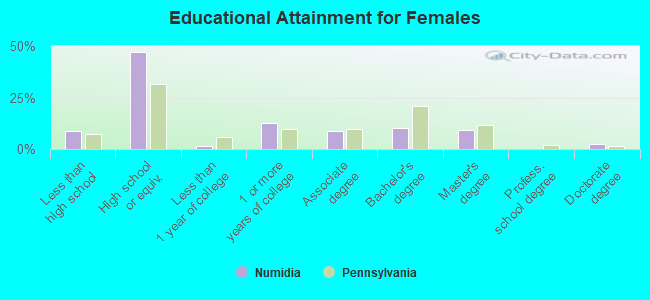
Education attainment for females 25 years and older:
- No schooling: 0
- Nursery to 4th grade: 0
- 5th and 6th grade: 0
- 7th and 8th grade: 0
- 9th grade: 7
- 10th grade: 0
- 11th grade: 1
- 12th grade, no diploma: 3
- High school graduate (or equivalency): 60
- Less than 1 year of college: 2
- Some college more than 1 year, no degree: 16
- Associate degree: 11
- Bachelor's degree: 13
- Master's degree: 12
- Professional school degree: 0
- Doctorate degree: 3


Housing units in structures:
- One, detached: 135
- Two: 18
- Mobile homes: 3
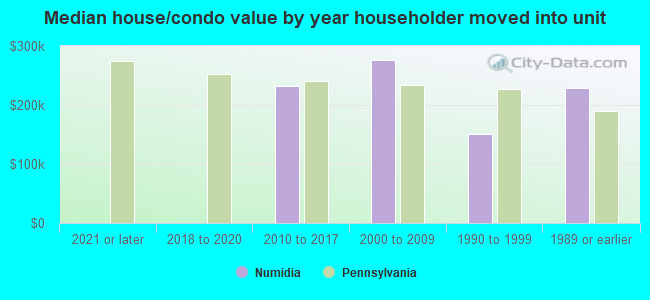
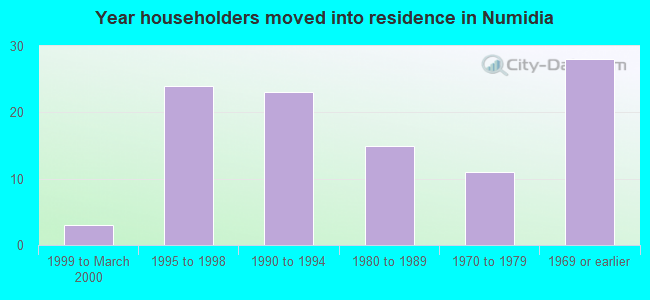
House/condo owner moved in on average 11 years ago
Renter moved in on average 6 years ago
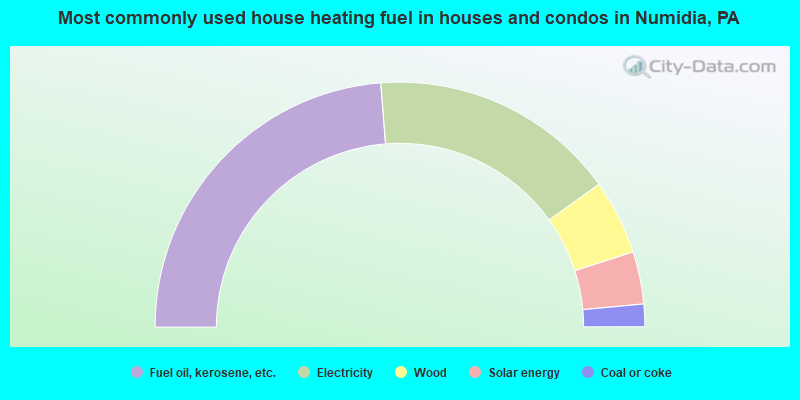
- 47.5%Fuel oil, kerosene, etc.
- 32.7%Electricity
- 9.9%Wood
- 6.9%Solar energy
- 3.0%Coal or coke
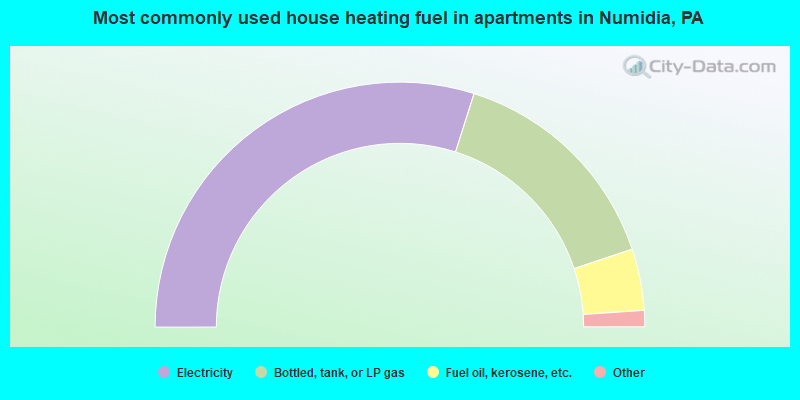
- 61.1%Electricity
- 30.6%Bottled, tank, or LP gas
- 8.3%Fuel oil, kerosene, etc.
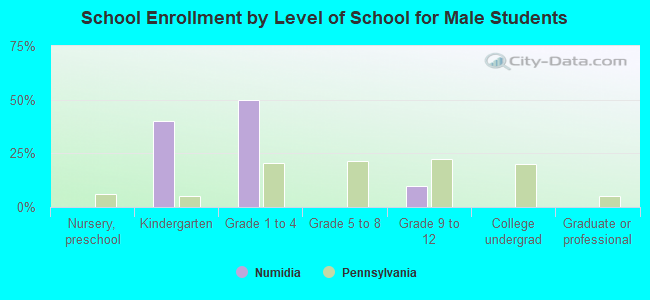
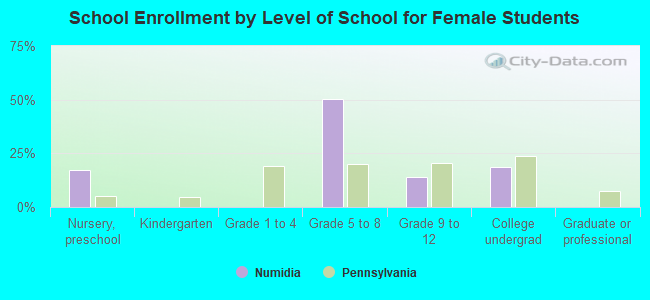
Private vs. public school enrollment:
| Here: | 0.0% |
| Pennsylvania: | 15.7% |
| Here: | 0.0% |
| Pennsylvania: | 13.4% |
| Here: | 0.0% |
| Pennsylvania: | 39.8% |