Parole, MD (Maryland) Houses and Residents
| Parole: | $519,874 |
| Maryland: | $398,100 |
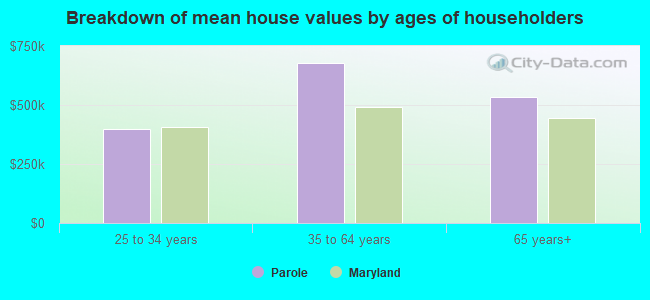
Mean price in 2022:
Detached houses: $904,896
Here: $904,896 State: $526,819 Townhouses or other attached units: $552,667
Here: $552,667 State: $328,305 In 5-or-more-unit structures: $464,912
Here: $464,912 State: $350,378
Total population: 15,922 (Urban population: 13,951, Rural population: 0)
Houses: 10,269 (9,842 occupied: 6,258 owner occupied, 3,645 renter occupied)
| % of renters here: | 37% |
| State: | 32% |
Housing density: 999 houses/condos per square mile
Median price asked for vacant for-sale houses and condos in 2022: $996,244.
Median contract rent in 2022: $1,886 (lower quartile is $1,473, upper quartile is over $2,000)
Median rent asked for vacant for-rent units in 2022: $3,328
Median gross rent in Parole, MD in 2022: over $2,000
Housing units in Parole with a mortgage: 3,864 (334 second mortgage, 0 home equity loan, 222 both second mortgage and home equity loan)
Houses without a mortgage: 79
Median household income for houses/condos with a mortgage: $158,590
Median household income for apartments without a mortgage: $94,212
Median monthly housing costs: $1,896
Compare current foreclosures near Parole, MD:
| Photo | Address | Area | Beds / Baths | Price | Details |
|---|---|---|---|---|---|

|
#1
Ensleigh Ln
Bowie, MD 20716
|
1,656 sq. feet
|
2 baths 3 beds |
$389,900
|
show details |

|
#2
Heming Ln
Bowie, MD 20716
|
1,800 sq. feet
|
2 baths 3 beds |
$400,000
|
show details |

|
#3
Elm Ave
Glen Burnie, MD 21061
|
1,092 sq. feet
|
2 baths 3 beds |
$399,900
|
show details |

|
#4
Gladys Retreat Cir
Bowie, MD 20720
|
2,880 sq. feet
|
3 baths 3 beds |
$409,900
|
show details |

|
#5
Lake Heron Dr # 1b
Annapolis, MD 21403
|
1,089 sq. feet
|
2 baths 2 beds |
show details | |

|
#6
Braden Loop
Glen Burnie, MD 21061
|
2,513 sq. feet
|
2 baths 3 beds |
show details | |

|
#7
Willow Leaf Ct
Odenton, MD 21113
|
1,476 sq. feet
|
2 baths 2 beds |
show details | |

|
#8
Eddy Rd
Crownsville, MD 21032
|
1,100 sq. feet
|
2 baths 2 beds |
show details | |

|
#9
Doris Ave
Brooklyn, MD 21225
|
1,122 sq. feet
|
2 baths 2 beds |
show details | |

|
#10
Norge Ct
Bowie, MD 20716
|
1,160 sq. feet
|
1 baths 3 beds |
show details |
| Photo | Address | Area | Beds / Baths | Price | Details |
|---|---|---|---|---|---|

|
#11
209th St
Pasadena, MD 21122
|
1,536 sq. feet
|
3 baths 3 beds |
show details | |

|
#12
Newton Ct
Upper Marlboro, MD 20772
|
1,092 sq. feet
|
2 baths 3 beds |
show details | |

|
#13
Pine Ridge Rd
Pasadena, MD 21122
|
1,052 sq. feet
|
3 baths 4 beds |
show details | |

|
#14
Benhill Ave
Curtis Bay, MD 21226
|
1,034 sq. feet
|
1 baths 2 beds |
show details | |

|
#15
Olen Dr
Glen Burnie, MD 21061
|
1,170 sq. feet
|
2 baths 3 beds |
show details | |

|
#16
Dennis Rd
Shady Side, MD 20764
|
1,376 sq. feet
|
2 baths 3 beds |
show details | |

|
#17
Nancy Ave
Linthicum Heights, MD 21090
|
1,170 sq. feet
|
2 baths 3 beds |
show details | |

|
#18
Water Fountain Ct Unit 302
Glen Burnie, MD 21060
|
1,100 sq. feet
|
2 baths 3 beds |
show details | |

|
#19
Sherman Dr
Chester, MD 21619
|
1,560 sq. feet
|
2 baths 4 beds |
show details | |

|
#20
Coronella Ct
Upper Marlboro, MD 20774
|
3,386 sq. feet
|
6 baths 6 beds |
show details |
| Photo | Address | Area | Beds / Baths | Price | Details |
|---|---|---|---|---|---|

|
#21
D Queen Mary Ct.
Chester, MD 21619
|
1,380 sq. feet
|
2 baths 2 beds |
show details | |

|
#22
Bishops Content Rd
Bowie, MD 20721
|
2,504 sq. feet
|
3 baths 3 beds |
show details | |

|
#23
1st Ave
Edgewater, MD 21037
|
2,496 sq. feet
|
3 baths 4 beds |
show details | |

|
#24
Dery Rd
Upper Marlboro, MD 20772
|
816 sq. feet
|
1 baths 3 beds |
show details | |

|
#25
Pennington Ave
Curtis Bay, MD 21226
|
960 sq. feet
|
1 baths 2 beds |
show details | |

|
#26
Burkes Promise Dr
Bowie, MD 20720
|
2,984 sq. feet
|
4 baths 5 beds |
show details | |

|
#27
Brock Bridge Rd
Laurel, MD 20724
|
1,428 sq. feet
|
1 baths 4 beds |
show details | |

|
#28
Brooklyn Ave
Brooklyn, MD 21225
|
1,080 sq. feet
|
1 baths 2 beds |
show details | |

|
#29
Deale Rd
Tracys Landing, MD 20779
|
1,472 sq. feet
|
1 baths 3 beds |
show details | |

|
#30
Parke West Dr
Glen Burnie, MD 21061
|
1,488 sq. feet
|
2 baths 3 beds |
show details |
| Photo | Address | Area | Beds / Baths | Price | Details |
|---|---|---|---|---|---|

|
#31
Crelin Pl
Lanham, MD 20706
|
1,932 sq. feet
|
3 baths 4 beds |
show details | |

|
#32
Glenn Dale Rd
Bowie, MD 20720
|
3,072 sq. feet
|
5 baths - beds |
show details | |

|
#33
Rexford Way
Upper Marlboro, MD 20774
|
3,334 sq. feet
|
3 baths - beds |
show details | |

|
#34
2nd Ave
Edgewater, MD 21037
|
1,916 sq. feet
|
2 baths - beds |
show details | |

|
#35
Diablo Ave
Lanham, MD 20706
|
1,972 sq. feet
|
3 baths - beds |
show details | |

|
#36
Patrick Henry Dr
Brooklyn, MD 21225
|
1,092 sq. feet
|
1 baths - beds |
show details | |

|
#37
Forest Lake Ct
Bowie, MD 20721
|
3,214 sq. feet
|
2 baths - beds |
show details | |

|
#38
Teal Ct # B
Chester, MD 21619
|
1,073 sq. feet
|
2 baths - beds |
show details | |

|
#39
D St SW
Glen Burnie, MD 21061
|
1,503 sq. feet
|
1 baths - beds |
show details | |

|
#40
Stewarton Ct
Severn, MD 21144
|
1,307 sq. feet
|
1 baths - beds |
show details |
| Photo | Address | Area | Beds / Baths | Price | Details |
|---|---|---|---|---|---|

|
#41
Main Ave SW
Glen Burnie, MD 21061
|
2,037 sq. feet
|
2 baths - beds |
show details | |

|
#42
Crutchfield Ave
Bowie, MD 20720
|
4,480 sq. feet
|
3 baths - beds |
show details | |

|
#43
Larch Pl
Stevensville, MD 21666
|
2,092 sq. feet
|
2 baths - beds |
show details | |

|
#44
Joyceton Way
Upper Marlboro, MD 20774
|
1,248 sq. feet
|
2 baths - beds |
show details | |

|
#45
Colonels Choice
Upper Marlboro, MD 20772
|
2,482 sq. feet
|
2 baths - beds |
show details | |

|
#46
Gabriel St
Bowie, MD 20720
|
2,710 sq. feet
|
2 baths - beds |
show details | |

|
#47
Citrus Ln
Upper Marlboro, MD 20774
|
2,912 sq. feet
|
2 baths - beds |
show details | |

|
#48
Meadow Drive
Glen Burnie, MD 21060
|
1,512 sq. feet
|
1 baths - beds |
show details | |

|
#49
Dorchester Rd
Glen Burnie, MD 21060
|
1,586 sq. feet
|
1 baths - beds |
show details | |

|
Check over 1 million property listings on Foreclosure.com!
|
browse all offers | |||

Latest news about housing in Parole, MD collected exclusively by city-data.com from local newspapers, TV, and radio stations

 | Areas Near Annapolis to Retire? (36 replies) |
| Does anybody have any examples of highrise condo/apartment buildings over a mall? (5 replies) |
| Boring 30s Gay Couple Looking to Relocate (16 replies) |
| Bowie vs Crofton vs Laurel (31 replies) |
| 90's Annapolis(west st,annapolis mall) (8 replies) |
| Could Preakness Leave Baltimore? (119 replies) |

Median year apartment built: 2000
Household type by relationship:
Households: 18,690- Male householders: 4,570 (1,316 living alone), Female householders: 5,218 (3,143 living alone)
3,913 spouses (3,895 opposite-sex spouses), 542 unmarried partners, (542 opposite-sex unmarried partners), 2,589 children (2,522 natural, 47 adopted, 20 stepchildren), 23 grandchildren, 108 brothers or sisters, 173 parents, 0 foster children, 122 other relatives, 737 non-relatives
- In group quarters: 690
Size of family households: 3,116 2-persons, 502 3-persons, 638 4-persons, 138 5-persons, 46 6-persons, 28 7-or-more-persons.
Size of nonfamily households: 4,672 1-person, 772 2-persons, 125 3-persons, 33 4-persons, 7 7-or-more-persons.
1,522 married couples with children.
295 single-parent households (56 men, 239 women).
90.1% of residents of Parole speak English at home.
4.2% of residents speak Spanish at home (72% speak English very well, 14% speak English well, 14% speak English not well).
3.8% of residents speak other Indo-European language at home (73% speak English very well, 5% speak English well, 22% speak English not well).
1.5% of residents speak Asian or Pacific Island language at home (75% speak English very well, 12% speak English well, 9% speak English not well, 4% don't speak English at all).
0.6% of residents speak other language at home (38% speak English very well, 62% speak English well).
Foreign born population: 1,686 (9.0%)
(76.9% of them are naturalized citizens)
| Here: | 6.4 |
| State: | 7.3 |
| Here: | 3.5 |
| State: | 4.2 |
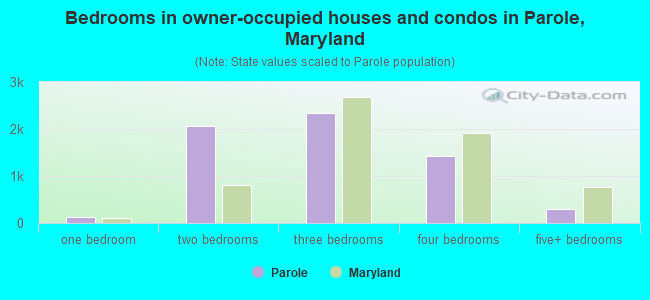
- Bedrooms in owner-occupied houses and condos in Parole, Maryland
- 0no bedroom
- 1221 bedroom
- 2,0732 bedrooms
- 2,3483 bedrooms
- 1,4184 bedrooms
- 2985+ bedrooms
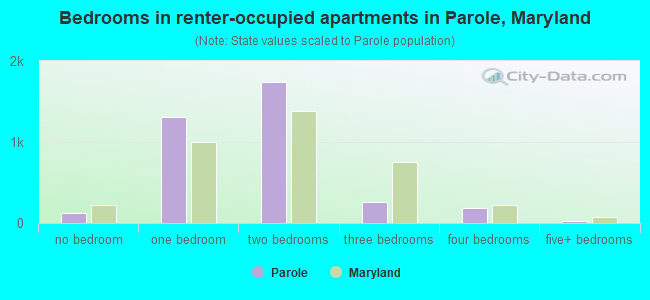
- Bedrooms in renter-occupied apartments in Parole, Maryland
- 124no bedroom
- 1,3061 bedroom
- 1,7392 bedrooms
- 2613 bedrooms
- 1864 bedrooms
- 305+ bedrooms
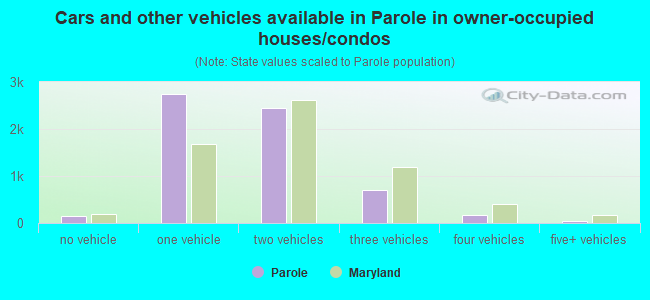
- Cars and other vehicles available in Parole in owner-occupied houses/condos
- 143no vehicle
- 2,7481 vehicle
- 2,4522 vehicles
- 7053 vehicles
- 1644 vehicles
- 475+ vehicles
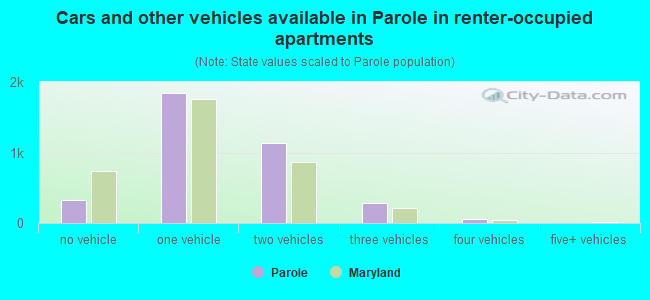
- Cars and other vehicles available in Parole in renter-occupied apartments
- 330no vehicle
- 1,8471 vehicle
- 1,1382 vehicles
- 2783 vehicles
- 534 vehicles
- 05+ vehicles
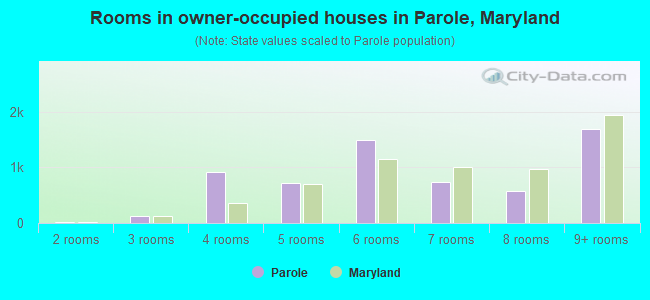
- Rooms in owner-occupied houses in Parole, Maryland
- 01 room
- 192 rooms
- 1243 rooms
- 9084 rooms
- 7245 rooms
- 1,4836 rooms
- 7427 rooms
- 5758 rooms
- 1,6849+ rooms
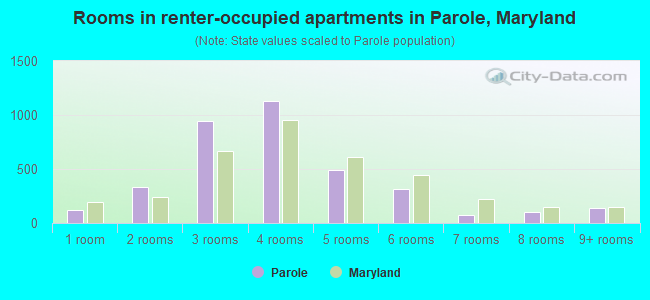
- Rooms in renter-occupied apartments in Parole, Maryland
- 1241 room
- 3292 rooms
- 9403 rooms
- 1,1294 rooms
- 4915 rooms
- 3196 rooms
- 767 rooms
- 1008 rooms
- 1399+ rooms
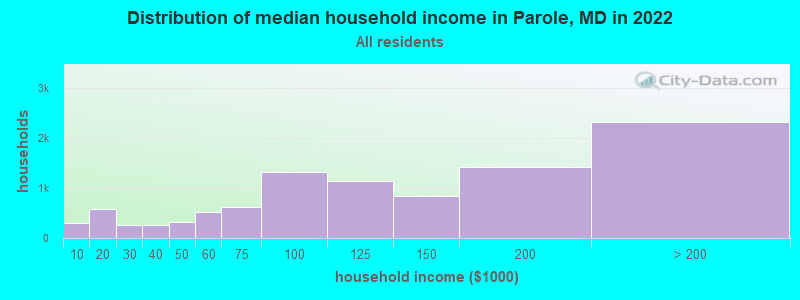
Parole, MD household income distribution

- 293Less than $10,000
- 577$10,000 to $19,999
- 259$20,000 to $29,999
- 251$30,000 to $39,999
- 312$40,000 to $49,999
- 523$50,000 to $59,999
- 624$60,000 to $74,999
- 1,329$75,000 to $99,999
- 1,151$100,000 to $124,999
- 843$125,000 to $149,999
- 1,417$150,000 to $199,999
- 2,327$200,000 or more
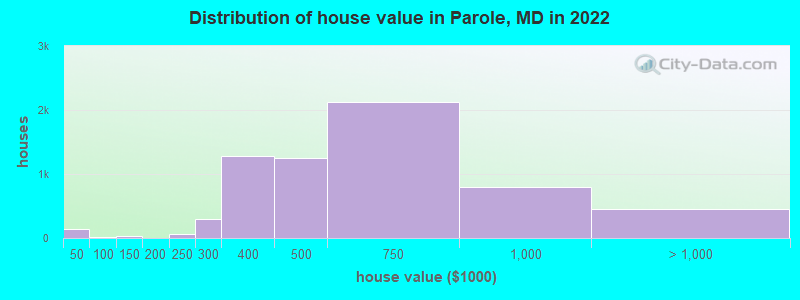
Home value of owner - occupied houses in 2022 in Parole, MD
-
- 133Less than $10,000
- 13$50,000 to $59,999
- 34$100,000 to $124,999
- 69$200,000 to $249,999
- 304$250,000 to $299,999
- 1,277$300,000 to $399,999
- 1,255$400,000 to $499,999
- 2,126$500,000 to $749,999
- 794$750,000 to $999,999
- 332$1,000,000 to $1,499,999
- 37$1,500,000 to $1,999,999
- 86$2,000,000 or more
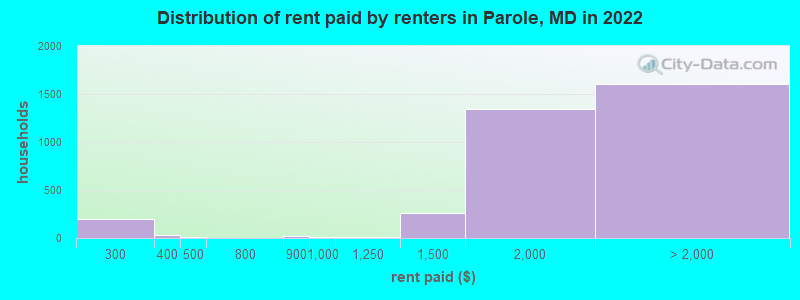
Rent paid by renters in 2022 in Parole, MD
-
- 136$200 to $249
- 62$250 to $299
- 27$350 to $399
- 15$400 to $449
- 20$800 to $899
- 9$900 to $999
- 10$1,000 to $1,249
- 257$1,250 to $1,499
- 1,343$1,500 to $1,999
- 733$2,000 to $2,499
- 502$2,500 to $2,999
- 141$3,000 to $3,499
- 172$3,500 or more
- 53No cash rent
Percentage of workers working in this county: 73.2%
Number of people working at home: 2,543 (25.9% of all workers)
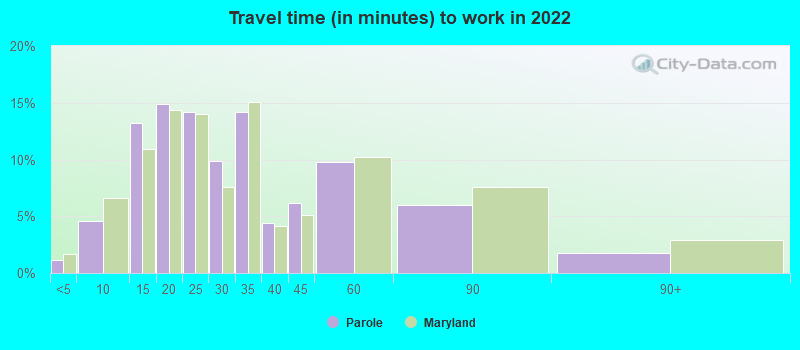
Travel time to work (commute)
- Less than 5 minutes: 124
- 5 to 9 minutes: 874
- 10 to 14 minutes: 813
- 15 to 19 minutes: 1,198
- 20 to 24 minutes: 804
- 25 to 29 minutes: 327
- 30 to 34 minutes: 863
- 35 to 39 minutes: 219
- 40 to 44 minutes: 314
- 45 to 59 minutes: 744
- 60 to 89 minutes: 756
- 90 or more minutes: 320
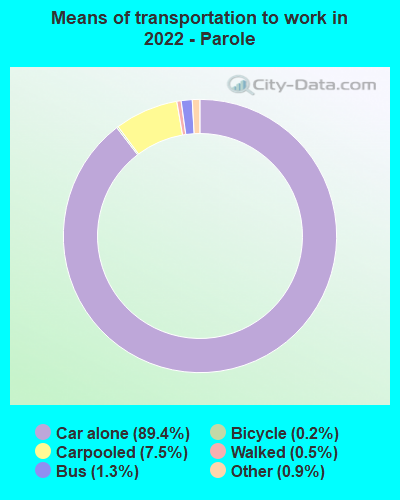
Means of transportation to work:
- Drove a car alone: 18,985 (78.2%)
- Carpooled: 1,610 (6.6%)
- Bus: 157 (0.6%)
- Subway or elevated rail: 11 (0.0%)
- Long-distance train or commuter rail: 6 (0.0%)
- Taxi: 238 (1.0%)
- Bicycle: 45 (0.2%)
- Walked: 98 (0.4%)
- Worked at home: 2,543 (10.5%)
- Unemployment by race in 2022
- Unemployment rate for White non-Hispanic residents
- 2.1%Males
- 3.1%Females
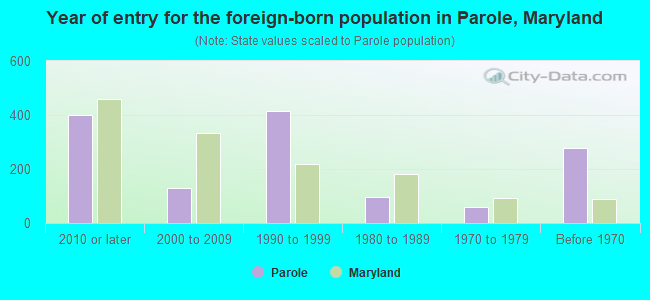
- Year of entry for the foreign-born population in Parole, Maryland
- 3992010 or later
- 1312000 to 2009
- 4151990 to 1999
- 961980 to 1989
- 601970 to 1979
- 278Before 1970
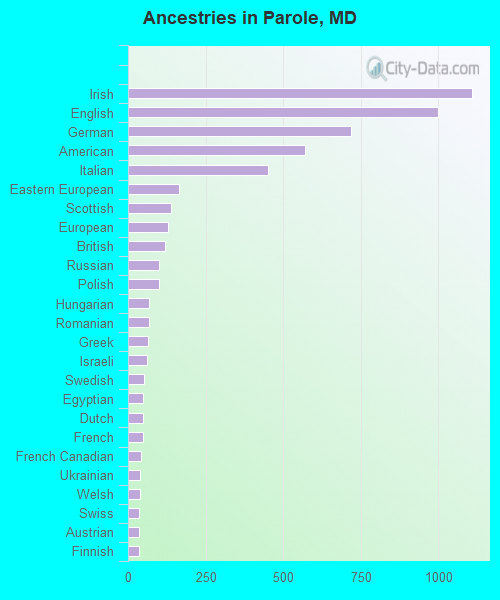
First ancestries reported:
- Irish: 1,109 (14.4%)
- English: 999 (12.9%)
- German: 718 (9.3%)
- American: 571 (7.4%)
- Italian: 450 (5.8%)
- Eastern European: 164 (2.1%)
- Scottish: 138 (1.8%)
- European: 129 (1.7%)
- British: 119 (1.5%)
- Russian: 101 (1.3%)
- Polish: 101 (1.3%)
- Hungarian: 69 (0.9%)
- Romanian: 67 (0.9%)
- Greek: 64 (0.8%)
- Israeli: 61 (0.8%)
- Swedish: 52 (0.7%)
- Egyptian: 48 (0.6%)
- Dutch: 47 (0.6%)
- French: 47 (0.6%)
- French Canadian: 42 (0.5%)
- Ukrainian: 39 (0.5%)
- Welsh: 38 (0.5%)
- Swiss: 36 (0.5%)
- Austrian: 34 (0.4%)
- Finnish: 34 (0.4%)
- Latvian: 33 (0.4%)
- Croatian: 25 (0.3%)
- Northern European: 23 (0.3%)
- Iranian: 22 (0.3%)
- Jamaican: 21 (0.3%)
- Syrian: 18 (0.2%)
- Scotch-Irish: 18 (0.2%)
- Basque: 16 (0.2%)
- African: 16 (0.2%)
- Lebanese: 12 (0.2%)
- Lithuanian: 11 (0.1%)
- Estonian: 8 (0.1%)
Most common places of birth for foreign-born residents (%):
| Parole: | 11.4% (199) |
| Maryland: | 1.2% (11,265) |
| Parole: | 8.5% (148) |
| Maryland: | 0.6% (5,828) |
| Parole: | 8.0% (140) |
| Maryland: | 6.4% (61,725) |
| Parole: | 7.4% (129) |
| Maryland: | 0.4% (3,756) |
| Parole: | 6.7% (116) |
| Maryland: | 0.7% (6,724) |
| Parole: | 4.8% (83) |
| Maryland: | 0.9% (8,603) |
| Parole: | 4.6% (81) |
| Maryland: | 0.3% (3,203) |
| Parole: | 3.2% (55) |
| Maryland: | 0.5% (4,901) |
| Parole: | 2.9% (50) |
| Maryland: | 1.3% (12,898) |
| Parole: | 2.6% (46) |
| Maryland: | 2.5% (24,026) |
| Parole: | 2.3% (40) |
| Maryland: | 3.5% (34,065) |
| Parole: | 2.3% (40) |
| Maryland: | 0.5% (4,596) |
| Parole: | 2.2% (38) |
| Maryland: | 3.4% (32,635) |
| Parole: | 2.1% (37) |
| Maryland: | 1.0% (9,481) |
| Parole: | 2.0% (34) |
| Maryland: | 0.4% (3,874) |
| Parole: | 2.0% (34) |
| Maryland: | 4.6% (44,742) |
| Parole: | 1.7% (30) |
| Maryland: | 0.4% (4,118) |
| Parole: | 1.7% (30) |
| Maryland: | 0.3% (2,576) |
| Parole: | 1.7% (29) |
| Maryland: | 0.1% (713) |
| Parole: | 1.6% (28) |
| Maryland: | 0.1% (778) |
| Parole: | 1.5% (27) |
| Maryland: | 12.0% (115,412) |
Place of birth for U.S.-born residents:
- This state: 6,918
- Other state: 9,836
- Northeast: 3,322
- Midwest: 2,051
- South: 3,395
- West: 960
79.4% of Parole residents lived in the same house 1 years ago.
Out of people who lived in different houses, 35.1% lived in this county.
Out of people who lived in different counties, 50.6% lived in Maryland.
| Parole: | 79.4% |
| State average: | 88.5% |
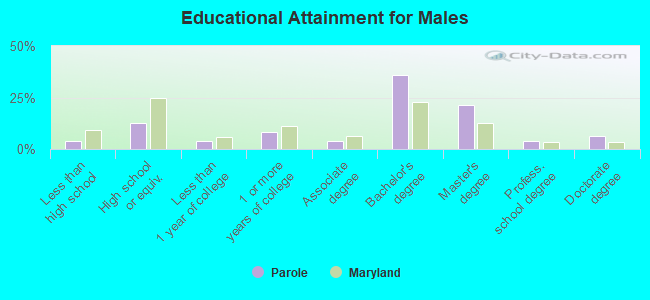
Education attainment for males 25 years and older:
- No schooling: 71
- Nursery to 4th grade: 0
- 5th and 6th grade: 0
- 7th and 8th grade: 26
- 9th grade: 57
- 10th grade: 33
- 11th grade: 44
- 12th grade, no diploma: 44
- High school graduate (or equivalency): 924
- Less than 1 year of college: 291
- Some college more than 1 year, no degree: 598
- Associate degree: 290
- Bachelor's degree: 2,612
- Master's degree: 1,552
- Professional school degree: 297
- Doctorate degree: 442
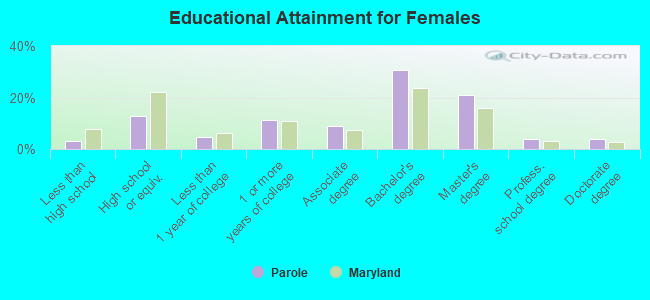
Education attainment for females 25 years and older:
- No schooling: 94
- Nursery to 4th grade: 0
- 5th and 6th grade: 0
- 7th and 8th grade: 3
- 9th grade: 19
- 10th grade: 50
- 11th grade: 25
- 12th grade, no diploma: 81
- High school graduate (or equivalency): 1,118
- Less than 1 year of college: 395
- Some college more than 1 year, no degree: 1,004
- Associate degree: 788
- Bachelor's degree: 2,683
- Master's degree: 1,845
- Professional school degree: 342
- Doctorate degree: 338


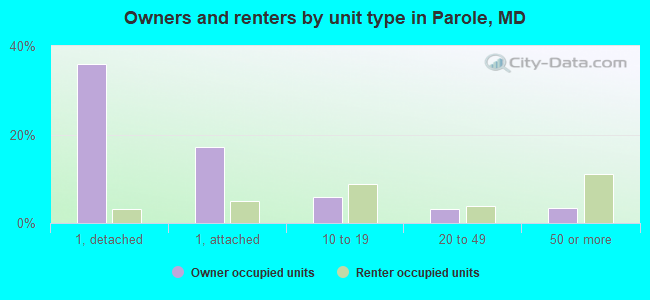
Housing units in structures:
- One, detached: 3,580
- One, attached: 2,433
- Two: 74
- 3 or 4: 100
- 5 to 9: 276
- 10 to 19: 1,453
- 20 to 49: 480
- 50 or more: 1,840
- Mobile homes: 29
Housing units lacking complete kitchen facilities in 2022: 1.9%
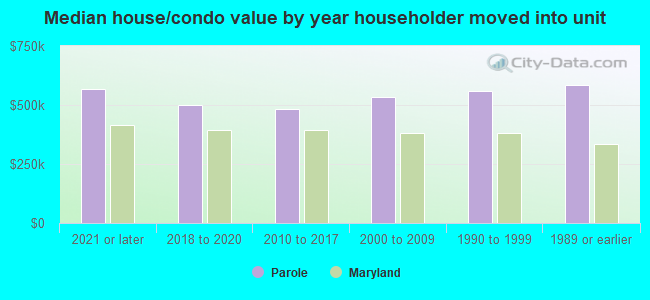
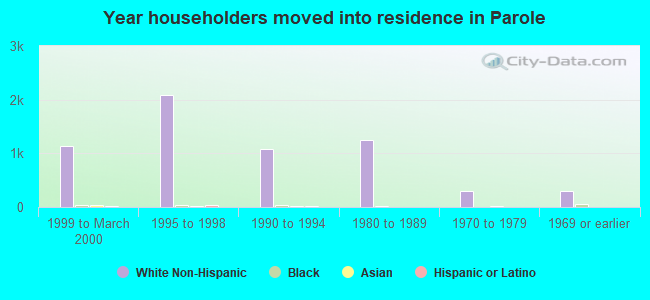
House/condo owner moved in on average 9 years ago
Renter moved in on average 3 years ago
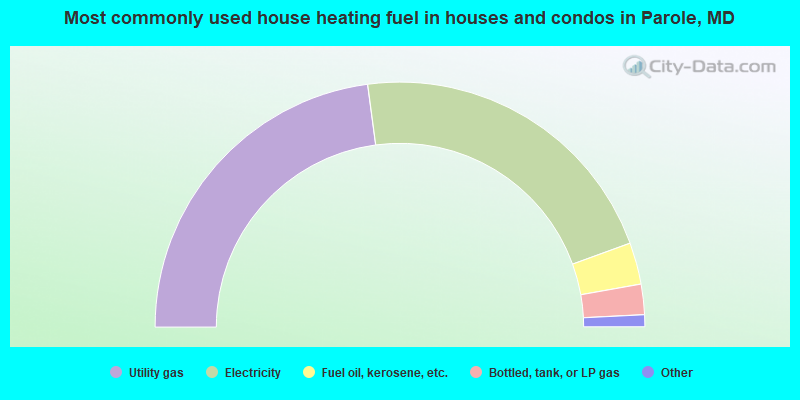
- 45.8%Utility gas
- 43.1%Electricity
- 5.5%Fuel oil, kerosene, etc.
- 4.0%Bottled, tank, or LP gas
- 0.4%Wood
- 0.4%Other fuel
- 0.4%Coal or coke
- 0.3%No fuel used
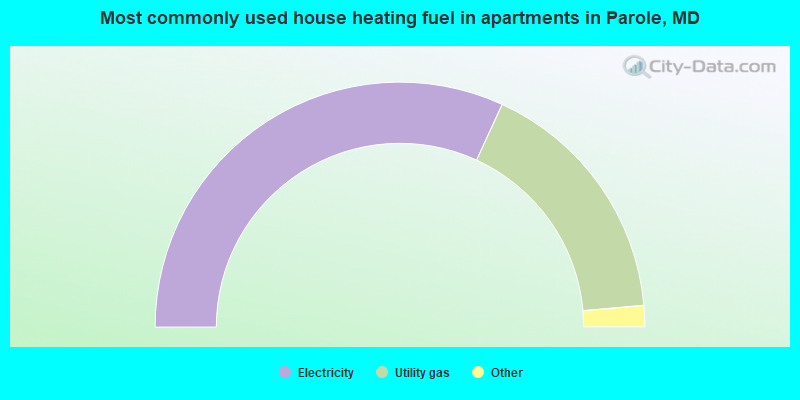
- 63.7%Electricity
- 33.5%Utility gas
- 1.1%Solar energy
- 0.9%Fuel oil, kerosene, etc.
- 0.4%No fuel used
- 0.4%Bottled, tank, or LP gas
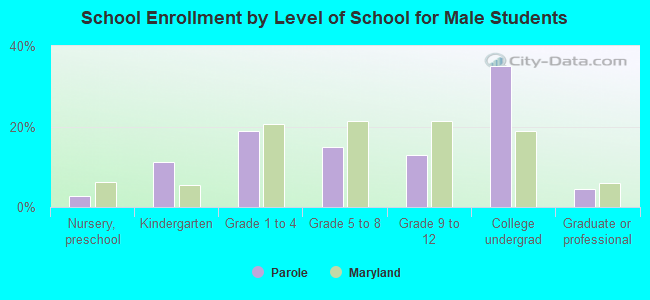
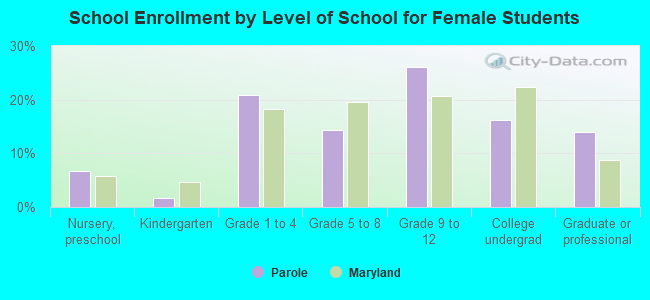
Private vs. public school enrollment:
| Here: | 25.6% |
| Maryland: | 15.2% |
| Here: | 31.2% |
| Maryland: | 14.4% |
| Here: | 10.2% |
| Maryland: | 20.2% |