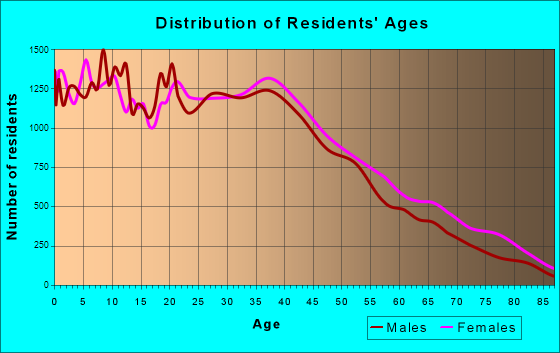
Paterson, NJ (New Jersey) Houses and Residents
Estimated median house or condo value in 2022: $324,800 (it was $148,500 in 2000 )
Paterson:
$324,800New Jersey:
$428,900
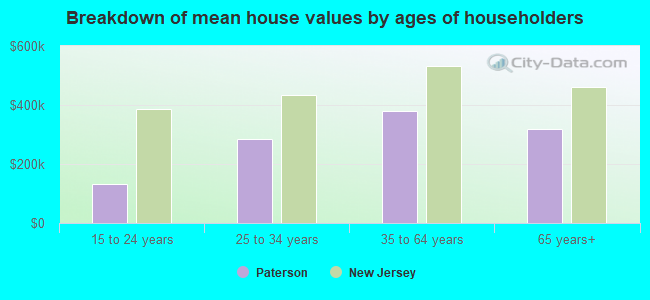
Lower value quartile - upper value quartile: $215,000 - $400,400Mean price in 2022: Detached houses: $336,232 Here:
$336,232State:
$537,591
Townhouses or other attached units: $247,237 Here:
$247,237State:
$381,113
In 2-unit structures: $595,376 Here:
$595,376State:
$444,476
In 3-to-4-unit structures: $405,185 Here:
$405,185State:
$457,463
In 5-or-more-unit structures: $161,168 Here:
$161,168State:
$368,745
Total population: 146,753 (All urban)
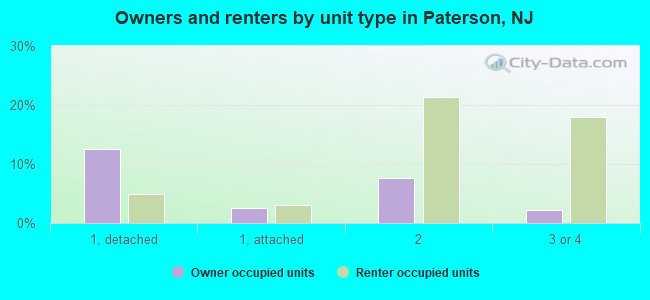
Houses: 53,159 (50,054 occupied: 13,581 owner occupied, 36,473 renter occupied )
% of renters here:
73%State:
35%
Housing density: 6,297 houses/condos per square mile
Median price asked for vacant for-sale houses and condos in 2022: $260,015.
Median contract rent in 2022: $1,227 (lower quartile is $852, upper quartile is $1,509)
Median rent asked for vacant for-rent units in 2022: $2,960
Median gross rent in Paterson, NJ in 2022: $1,391
Housing units in Paterson with a mortgage: 9,050 (262 second mortgage, 39 home equity loan, 156 both second mortgage and home equity loan )Houses without a mortgage: 108
Median household income for houses/condos with a mortgage: $99,208
Median household income for apartments without a mortgage: $64,288
Median monthly housing costs: $1,491
Data:
Median house or condo value ($)
Median house or condo value ($ change since 2000)
Median house or condo value ($) - White
Median house or condo value ($) - Black or African American
Median house or condo value ($) - Asian
Median house or condo value ($) - Hispanic or Latino
Median house or condo value ($) - American Indian and Alaska Native
Median house or condo value ($) - Multirace
Median house or condo value ($) - Other Race
Median price asked for mobile homes ($)
Household density (households per square mile)
Mean house or condo value by units in structure - 1, detached ($)
Mean house or condo value by units in structure - 1, attached ($)
Mean house or condo value by units in structure - 2 ($)
Mean house or condo value by units in structure by units in structure - 3 or 4 ($)
Mean house or condo value by units in structure - 5 or more ($)
Mean house or condo value by units in structure - Boat, RV, van, etc. ($)
Mean house or condo value by units in structure - Mobile home ($)
Median contract rent ($)
Median contract rent - Lower quartile ($)
Median contract rent - Upper quartile ($)
Median gross rent ($)
Urban houses (%)
Rural houses (%)
Houses occupied (%)
Houses occupied (% change since 2000)
Houses owner occupied (%)
Houses owner occupied (% change since 2000)
Houses renter occupied (%)
Houses renter occupied (% change since 2000)
Vacant housing units - For rent (%)
Vacant housing units - For rent (% change since 2000)
Vacant housing units - For sale only (%)
Vacant housing units - For sale only (% change since 2000)
Vacant housing units - Rented or sold, not occupied (%)
Vacant housing units - Rented or sold, not occupied (% change since 2000)
Vacant housing units - For seasonal, recreational, or occasional use (%)
Vacant housing units - For seasonal, recreational, or occasional use (% change since 2000)
Vacant housing units - For migrant workers (%)
Vacant housing units - For migrant workers (% change since 2000)
Vacant housing units - Other vacant (%)
Vacant housing units - Other vacant (% change since 2000)
Median monthly housing costs ($)
Median household income for houses/condos with a mortgage ($)
Median household income for houses/condos without a mortgage ($)
Median household income ($)
Median household income ($) - White
Median household income ($) - Black or African American
Median household income ($) - Asian
Median household income ($) - Hispanic or Latino
Median household income ($) - American Indian and Alaska Native
Median household income ($) - Multirace
Median household income ($) - Other Race
Mortgage status - with mortgage (%)
Mortgage status - with second mortgage (%)
Mortgage status - with home equity loan (%)
Mortgage status - with both second mortgage and home equity loan (%)
Mortgage status - without a mortgage (%)
Median year house/condo built
Median year apartment built
Household type by relationship - Male householder living alone (%)
Household type by relationship - Male householder not living alone (%)
Household type by relationship - Female householder living alone (%)
Household type by relationship - Female householder not living alone (%)
Household type by relationship - Opposite-Sex spouse (%)
Household type by relationship - Same-Sex spouse (%)
Household type by relationship - Opposite-Sex unmarried partner (%)
Household type by relationship - Same-Sex unmarried partner (%)
Household type by relationship - In group quarters (%)
Size of family households - 2-person household (%)
Size of family households - 3-person household (%)
Size of family households - 4-person household (%)
Size of family households - 5-person household (%)
Size of family households - 6-person household (%)
Size of family households - 7-or-more-person household (%)
Size of nonfamily households - 1-person household (%)
Size of nonfamily households - 2-person household (%)
Size of nonfamily households - 3-person household (%)
Size of nonfamily households - 4-person household (%)
Size of nonfamily households - 5-person household (%)
Size of nonfamily households - 6-person household (%)
Size of nonfamily households - 7-or-moreperson household (%)
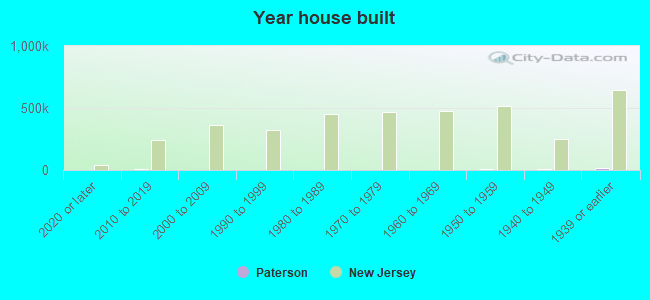
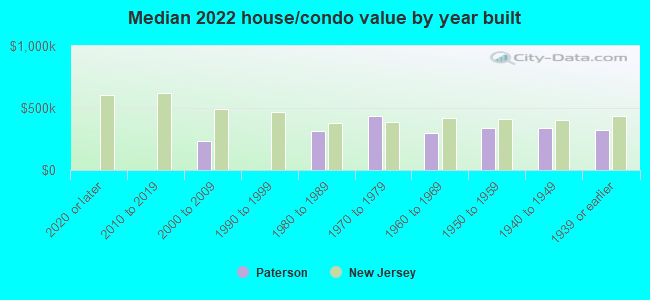
Year house built - Built 2010 or later (%)
Year house built - Built 2000 to 2009 (%)
Year house built - Built 1990 to 1999 (%)
Year house built - Built 1980 to 1989 (%)
Year house built - Built 1970 to 1979 (%)
Year house built - Built 1960 to 1969 (%)
Year house built - Built 1950 to 1959 (%)
Year house built - Built 1940 to 1949 (%)
Year house built - Built 1939 or earlier (%)
Median number of rooms in houses and condos
Median number of rooms in apartments
Median number of bedrooms in owner occupied houses
Mean number of bedrooms in owner occupied houses
Median number of bedrooms in renter occupied houses
Mean number of bedrooms in renter occupied houses
Median number of vehichles in owner occupied houses
Mean number of vehichles in owner occupied houses
Median number of vehichles in renter occupied houses
Mean number of vehichles in renter occupied houses
Rooms in owner-occupied houses - 1 room (%)
Rooms in owner-occupied houses - 2 rooms (%)
Rooms in owner-occupied houses - 3 rooms (%)
Rooms in owner-occupied houses - 4 rooms (%)
Rooms in owner-occupied houses - 5 rooms (%)
Rooms in owner-occupied houses - 6 rooms (%)
Rooms in owner-occupied houses - 7 rooms (%)
Rooms in owner-occupied houses - 8 rooms (%)
Rooms in owner-occupied houses - 9+ rooms (%)
Rooms in renter-occupied houses - 1 room (%)
Rooms in renter-occupied houses - 2 rooms (%)
Rooms in renter-occupied houses - 3 rooms (%)
Rooms in renter-occupied houses - 4 rooms (%)
Rooms in renter-occupied houses - 5 rooms (%)
Rooms in renter-occupied houses - 6 rooms (%)
Rooms in renter-occupied houses - 7 rooms (%)
Rooms in renter-occupied houses - 8 rooms (%)
Rooms in renter-occupied houses - 9+ rooms (%)
Bedrooms in owner-occupied houses - no bedrooms (%)
Bedrooms in owner-occupied houses - 1 bedroom (%)
Bedrooms in owner-occupied houses - 2 bedrooms (%)
Bedrooms in owner-occupied houses - 3 bedrooms (%)
Bedrooms in owner-occupied houses - 4 bedrooms (%)
Bedrooms in owner-occupied houses - 5+ bedrooms (%)
Bedrooms in renter-occupied houses - no bedrooms (%)
Bedrooms in renter-occupied houses - 1 bedroom (%)
Bedrooms in renter-occupied houses - 2 bedrooms (%)
Bedrooms in renter-occupied houses - 3 bedrooms (%)
Bedrooms in renter-occupied houses - 4 bedrooms (%)
Bedrooms in renter-occupied houses - 5+ bedrooms (%)
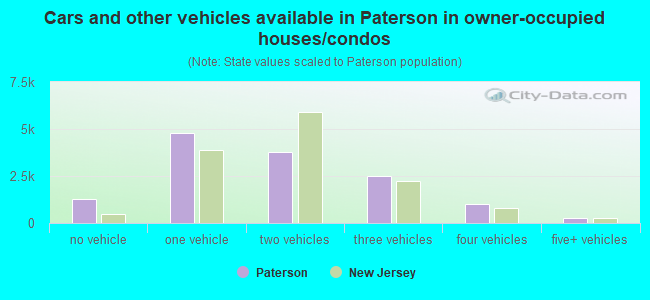
Vehicles available in owner-occupied houses - no vehicle available (%)
Vehicles available in owner-occupied houses - 1 vehicle available(%)
Vehicles available in owner-occupied houses - 2 Vehicles available (%)
Vehicles available in owner-occupied houses - 3 Vehicles available (%)
Vehicles available in owner-occupied houses - 4 Vehicles available (%)
Vehicles available in owner-occupied houses - 5+ Vehicles available (%)
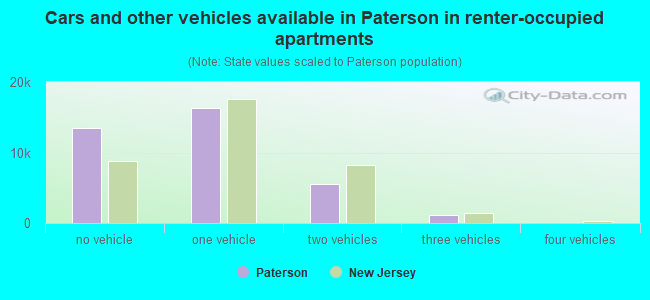
Vehicles available in renter-occupied houses - no vehicle available (%)
Vehicles available in renter-occupied houses - 1 vehicle available (%)
Vehicles available in renter-occupied houses - 2 Vehicles available (%)
Vehicles available in renter-occupied houses - 3 Vehicles available (%)
Vehicles available in renter-occupied houses - 4 Vehicles available (%)
Vehicles available in renter-occupied houses - 5+ Vehicles available (%)
Housing units in structures - 1, detached (%)
Housing units in structures - 1, attached (%)
Housing units in structures - 2 (%)
Housing units in structures - 3 or 4 (%)
Housing units in structures - 5 to 9 (%)
Housing units in structures - 10 to 19 (%)
Housing units in structures - 20 to 49 (%)
Housing units in structures - 50 or more (%)
Housing units in structures - Mobile home (%)
Housing units in structures - Boat, RV, van, etc. (%)
Housing units in structures - Owners - 1, detached (%)
Housing units in structures - Owners - 1, attached (%)
Housing units in structures - Owners - 2 (%)
Housing units in structures - Owners - 3 or 4 (%)
Housing units in structures - Owners - 5 to 9 (%)
Housing units in structures - Owners - 10 to 19 (%)
Housing units in structures - Owners - 20 to 49 (%)
Housing units in structures - Owners - 50 or more (%)
Housing units in structures - Owners - Mobile home (%)
Housing units in structures - Owners - Boat, RV, van, etc. (%)
Housing units in structures - Renters - 1, detached (%)
Housing units in structures - Renters - 1, attached (%)
Housing units in structures - Renters - 2 (%)
Housing units in structures - Renters - 3 or 4 (%)
Housing units in structures - Renters - 5 to 9 (%)
Housing units in structures - Renters - 10 to 19 (%)
Housing units in structures - Renters - 20 to 49 (%)
Housing units in structures - Renters - 50 or more (%)
Housing units in structures - Renters - Mobile home (%)
Housing units in structures - Renters - Boat, RV, van, etc. (%)
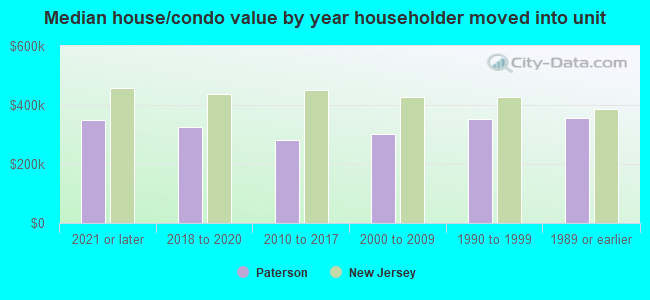
House/condo owner moved in on average (years ago)
Renter moved in on average (years ago)
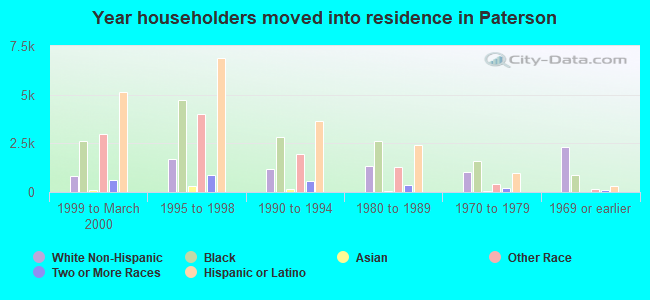
Year householder moved into unit - Moved in 1999 to March 2000 (%)
Year householder moved into unit - Moved in 1999 to March 2000 (%) - White
Year householder moved into unit - Moved in 1999 to March 2000 (%) - Black or African American
Year householder moved into unit - Moved in 1999 to March 2000 (%) - Asian
Year householder moved into unit - Moved in 1999 to March 2000 (%) - Hispanic or Latino
Year householder moved into unit - Moved in 1999 to March 2000 (%) - American Indian and Alaska Native
Year householder moved into unit - Moved in 1999 to March 2000 (%) - Multirace
Year householder moved into unit - Moved in 1999 to March 2000 (%) - Other Race
Year householder moved into unit - Moved in 1995 to 1998 (%)
Year householder moved into unit - Moved in 1995 to 1998 (%) - White
Year householder moved into unit - Moved in 1995 to 1998 (%) - Black or African American
Year householder moved into unit - Moved in 1995 to 1998 (%) - Asian
Year householder moved into unit - Moved in 1995 to 1998 (%) - Hispanic or Latino
Year householder moved into unit - Moved in 1995 to 1998 (%) - American Indian and Alaska Native
Year householder moved into unit - Moved in 1995 to 1998 (%) - Multirace
Year householder moved into unit - Moved in 1995 to 1998 (%) - Other Race
Year householder moved into unit - Moved in 1990 to 1994 (%)
Year householder moved into unit - Moved in 1990 to 1994 (%) - White
Year householder moved into unit - Moved in 1990 to 1994 (%) - Black or African American
Year householder moved into unit - Moved in 1990 to 1994 (%) - Asian
Year householder moved into unit - Moved in 1990 to 1994 (%) - Hispanic or Latino
Year householder moved into unit - Moved in 1990 to 1994 (%) - American Indian and Alaska Native
Year householder moved into unit - Moved in 1990 to 1994 (%) - Multirace
Year householder moved into unit - Moved in 1990 to 1994 (%) - Other Race
Year householder moved into unit - Moved in 1980 to 1989 (%)
Year householder moved into unit - Moved in 1980 to 1989 (%) - White
Year householder moved into unit - Moved in 1980 to 1989 (%) - Black or African American
Year householder moved into unit - Moved in 1980 to 1989 (%) - Asian
Year householder moved into unit - Moved in 1980 to 1989 (%) - Hispanic or Latino
Year householder moved into unit - Moved in 1980 to 1989 (%) - American Indian and Alaska Native
Year householder moved into unit - Moved in 1980 to 1989 (%) - Multirace
Year householder moved into unit - Moved in 1980 to 1989 (%) - Other Race
Year householder moved into unit - Moved in 1970 to 1979 (%)
Year householder moved into unit - Moved in 1970 to 1979 (%) - White
Year householder moved into unit - Moved in 1970 to 1979 (%) - Black or African American
Year householder moved into unit - Moved in 1970 to 1979 (%) - Asian
Year householder moved into unit - Moved in 1970 to 1979 (%) - Hispanic or Latino
Year householder moved into unit - Moved in 1970 to 1979 (%) - American Indian and Alaska Native
Year householder moved into unit - Moved in 1970 to 1979 (%) - Multirace
Year householder moved into unit - Moved in 1970 to 1979 (%) - Other Race
Year householder moved into unit - Moved in 1969 or earlier (%)
Year householder moved into unit - Moved in 1969 or earlier (%) - White
Year householder moved into unit - Moved in 1969 or earlier (%) - Black or African American
Year householder moved into unit - Moved in 1969 or earlier (%) - Asian
Year householder moved into unit - Moved in 1969 or earlier (%) - Hispanic or Latino
Year householder moved into unit - Moved in 1969 or earlier (%) - American Indian and Alaska Native
Year householder moved into unit - Moved in 1969 or earlier (%) - Multirace
Year householder moved into unit - Moved in 1969 or earlier (%) - Other Race
Housing units lacking complete plumbing facilities (%)
Housing units lacking complete kitchen facilities (%)
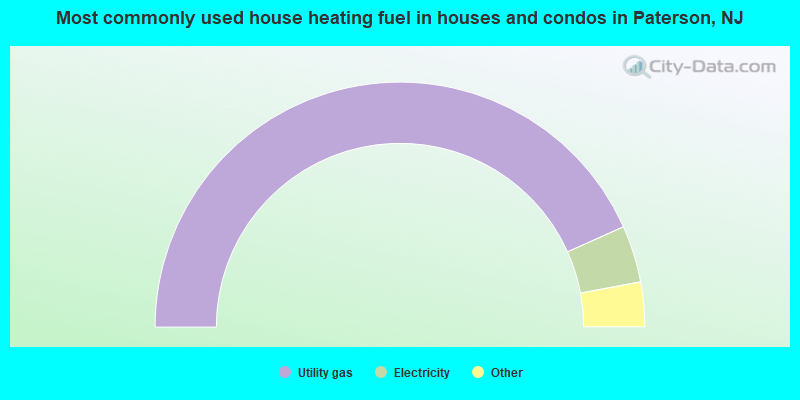
House heating fuel used in houses and condos - Utility gas (%)
House heating fuel used in houses and condos - Bottled, tank, or LP gas (%)
House heating fuel used in houses and condos - Electricity (%)
House heating fuel used in houses and condos - Fuel oil, kerosene, etc. (%)
House heating fuel used in houses and condos - Coal or coke (%)
House heating fuel used in houses and condos - Wood (%)
House heating fuel used in houses and condos - Solar energy (%)
House heating fuel used in houses and condos - Other fuel (%)
House heating fuel used in houses and condos - No fuel used (%)
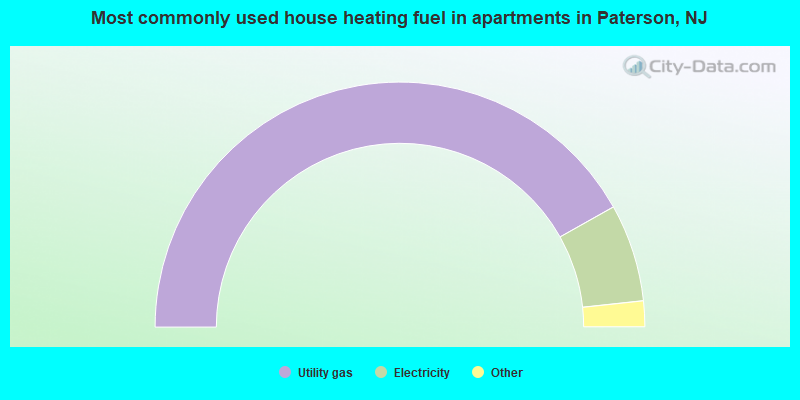
House heating fuel used in apartments - Utility gas (%)
House heating fuel used in apartments - Bottled, tank, or LP gas (%)
House heating fuel used in apartments - Electricity (%)
House heating fuel used in apartments - Fuel oil, kerosene, etc. (%)
House heating fuel used in apartments - Coal or coke (%)
House heating fuel used in apartments - Wood (%)
House heating fuel used in apartments - Solar energy (%)
House heating fuel used in apartments - Other fuel (%)
House heating fuel used in apartments - No fuel used (%)
Latest news about housing in Paterson, NJ collected exclusively by city-data.com from local newspapers, TV, and radio stations
Median year house/condo built: 1949Median year apartment built: 1953Household type by relationship:
Households: 156,639
Male householders: 20,478 (6,906 living alone ), Female householders: 29,576 (7,330 living alone )15,904 spouses (15,904 opposite-sex spouses ), 5,846 unmarried partners , (5,846 opposite-sex unmarried partners ), 55,264 children (54,316 natural , 108 adopted , 840 stepchildren ), 6,257 grandchildren , 4,690 brothers or sisters , 6,202 parents , 0 foster children , 6,340 other relatives , 4,482 non-relatives In group quarters: 1,600
Size of family households: 7,991 2-persons , 8,296 3-persons , 9,133 4-persons , 3,667 5-persons , 2,467 6-persons , 1,997 7-or-more-persons .
Size of nonfamily households: 14,236 1-person , 2,003 2-persons , 67 3-persons , 68 4-persons , 129 7-or-more-persons .
17,997 married couples with children. single-parent households (2,527 men , 14,858 women ).
33.9% of residents of Paterson speak English at home. of residents speak Spanish at home (44% speak English very well , 16% speak English well , 18% speak English not well , 22% don't speak English at all ).of residents speak other Indo-European language at home (53% speak English very well , 20% speak English well , 20% speak English not well , 6% don't speak English at all ).of residents speak Asian or Pacific Island language at home (51% speak English very well , 14% speak English well , 32% speak English not well , 3% don't speak English at all ).of residents speak other language at home (49% speak English very well , 35% speak English well , 14% speak English not well , 3% don't speak English at all ).
Foreign born population: 64,680 (41.3%)of them are naturalized citizens )
Median number of rooms in houses and condos:
Median number of rooms in apartments
Owner-occupied Renter-occupied
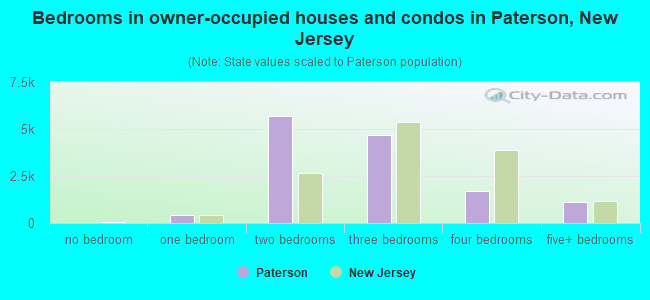
Bedrooms in owner-occupied houses and condos in Paterson, New Jersey
0 no bedroom 414 1 bedroom 5,691 2 bedrooms 4,669 3 bedrooms 1,683 4 bedrooms 1,124 5+ bedrooms
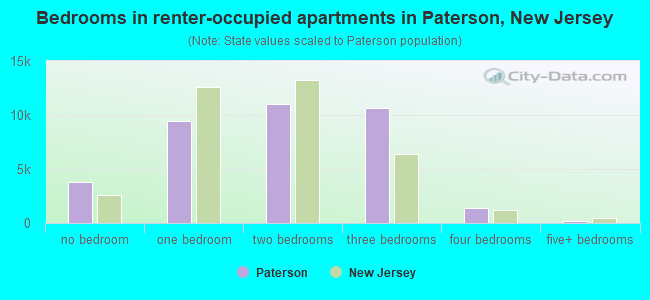
Bedrooms in renter-occupied apartments in Paterson, New Jersey
3,811 no bedroom 9,413 1 bedroom 11,040 2 bedrooms 10,652 3 bedrooms 1,376 4 bedrooms 181 5+ bedrooms
Owner-occupied Renter-occupied
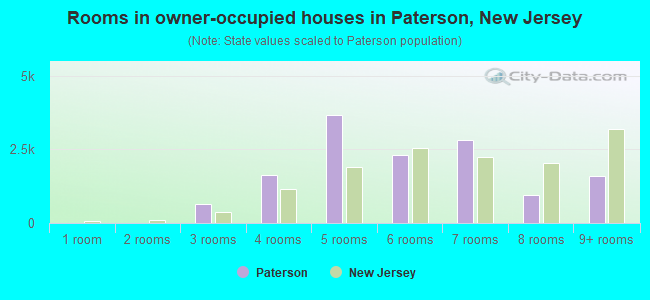
Rooms in owner-occupied houses in Paterson, New Jersey
0 1 room 0 2 rooms 634 3 rooms 1,637 4 rooms 3,662 5 rooms 2,308 6 rooms 2,800 7 rooms 940 8 rooms 1,600 9+ rooms
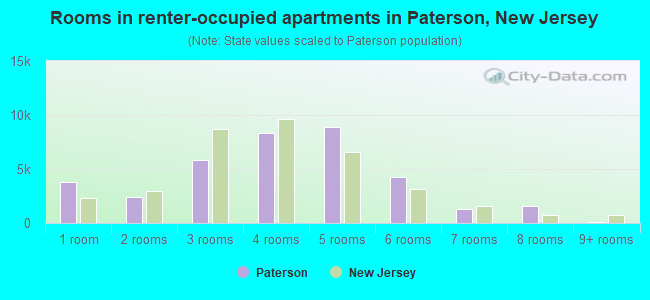
Rooms in renter-occupied apartments in Paterson, New Jersey
3,764 1 room 2,417 2 rooms 5,823 3 rooms 8,359 4 rooms 8,892 5 rooms 4,301 6 rooms 1,265 7 rooms 1,529 8 rooms 123 9+ rooms
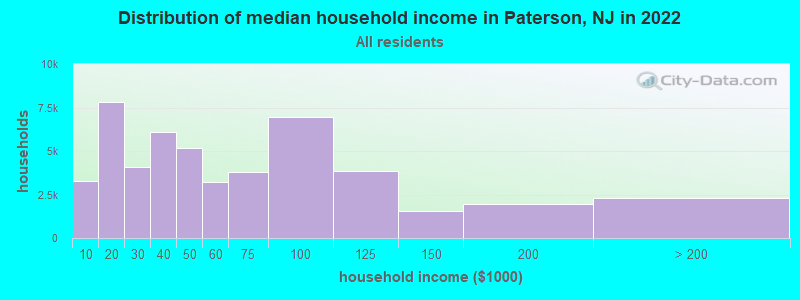
Paterson, NJ household income distribution 3,283 Less than $10,0007,815 $10,000 to $19,9994,057 $20,000 to $29,9996,093 $30,000 to $39,9995,184 $40,000 to $49,9993,224 $50,000 to $59,9993,777 $60,000 to $74,9996,963 $75,000 to $99,9993,822 $100,000 to $124,9991,572 $125,000 to $149,9991,945 $150,000 to $199,9992,319 $200,000 or more
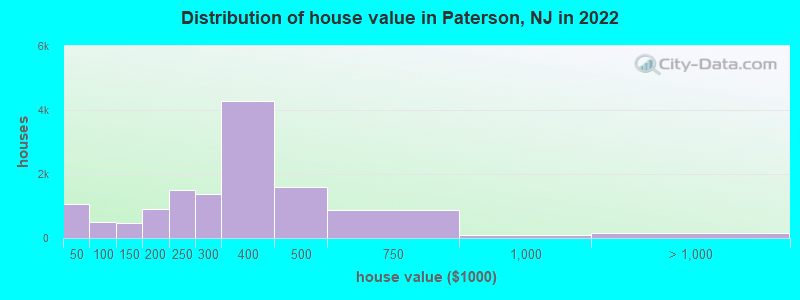
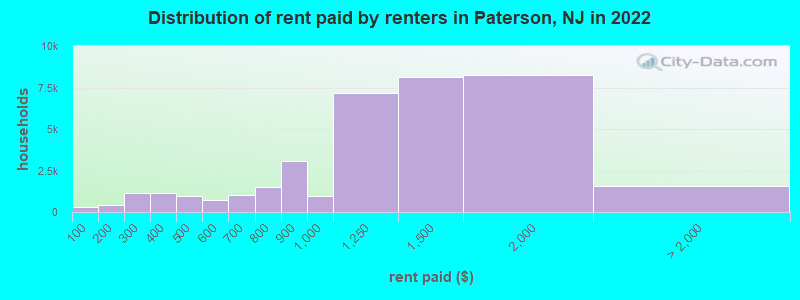
Home value of owner - occupied houses in 2022 in Paterson, NJ 467 Less than $10,000163 $10,000 to $14,99923 $15,000 to $19,99957 $25,000 to $29,999284 $30,000 to $34,99927 $35,000 to $39,99923 $40,000 to $49,999216 $50,000 to $59,99915 $60,000 to $69,99959 $80,000 to $89,999171 $90,000 to $99,999351 $100,000 to $124,999117 $125,000 to $149,999671 $150,000 to $174,999222 $175,000 to $199,9991,506 $200,000 to $249,9991,389 $250,000 to $299,9994,277 $300,000 to $399,9991,592 $400,000 to $499,999878 $500,000 to $749,999104 $750,000 to $999,99926 $1,000,000 to $1,499,99943 $1,500,000 to $1,999,99994 $2,000,000 or moreRent paid by renters in 2022 in Paterson, NJ 318 Less than $100248 $100 to $149180 $150 to $199415 $200 to $249749 $250 to $299277 $300 to $349893 $350 to $399416 $400 to $449533 $450 to $499524 $500 to $549225 $550 to $599279 $600 to $649736 $650 to $6991,279 $700 to $749254 $750 to $7993,100 $800 to $899942 $900 to $9997,168 $1,000 to $1,2498,120 $1,250 to $1,4998,228 $1,500 to $1,999627 $2,000 to $2,49939 $2,500 to $2,999125 $3,000 to $3,49966 $3,500 or more732 No cash rent
Percentage of workers working in this county: 59.8%Number of people working at home: 3,045 (4.6% of all workers )
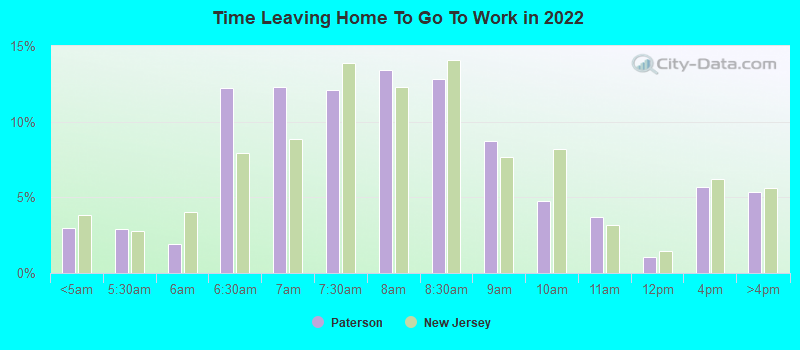
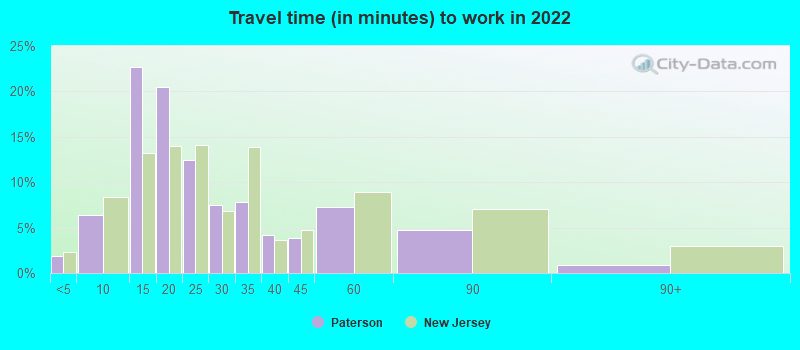
Travel time to work (commute)
Less than 5 minutes: 3535 to 9 minutes: 2,96410 to 14 minutes: 12,32515 to 19 minutes: 14,03520 to 24 minutes: 10,36425 to 29 minutes: 4,60630 to 34 minutes: 8,45135 to 39 minutes: 33940 to 44 minutes: 1,21245 to 59 minutes: 3,28460 to 89 minutes: 4,54490 or more minutes: 484
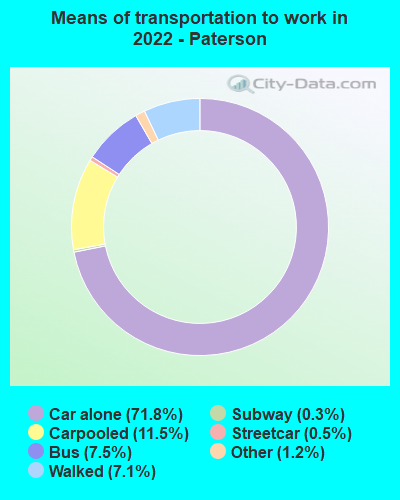
Means of transportation to work:
Drove a car alone: 33,111 (64.3%)Carpooled: 5,589 (10.8%)Bus : 4,234 (8.2%)Subway or elevated rail : 217 (0.4%)Long-distance train or commuter rail : 157 (0.3%)Taxi: 608 (1.2%)Bicycle: 18 (0.0%)Walked: 3,960 (7.7%)Worked at home: 3,149 (6.1%)
Unemployment by race in 2022
Unemployment rate for White non-Hispanic residents 7.6% Males5.2% FemalesUnemployment rate for Black residents 12.7% Males13.6% FemalesUnemployment rate for American Indian and Alaska Native residents 24.6% FemalesUnemployment rate for Asian residents 4.1% Males4.9% FemalesUnemployment rate for other race residents 5.9% Males8.5% FemalesUnemployment rate for two or more race residents 6.3% Males7.9% FemalesUnemployment rate for Hispanic or Latino residents 6.7% Males10.3% Females
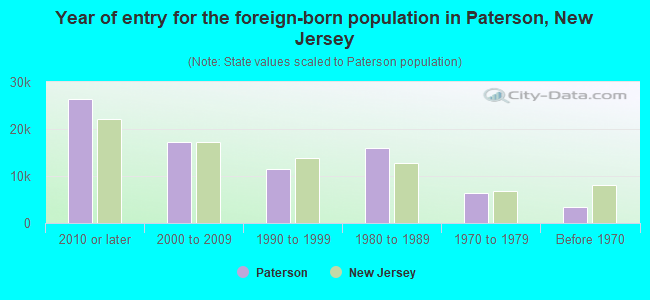
Year of entry for the foreign-born population in Paterson, New Jersey
26,484 2010 or later 17,272 2000 to 2009 11,462 1990 to 1999 15,981 1980 to 1989 6,401 1970 to 1979 3,346 Before 1970
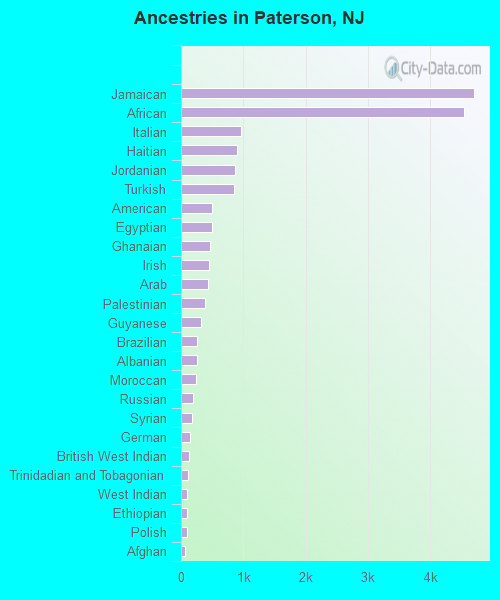
First ancestries reported:
Jamaican: 4,710 (3.9%)
African: 4,540 (3.7%)
Italian: 968 (0.8%)
Haitian: 892 (0.7%)
Jordanian: 865 (0.7%)
Turkish: 851 (0.7%)
American: 504 (0.4%)
Egyptian: 490 (0.4%)
Ghanaian: 466 (0.4%)
Irish: 454 (0.4%)
Arab: 434 (0.4%)
Palestinian: 387 (0.3%)
Guyanese: 328 (0.3%)
Brazilian: 253 (0.2%)
Albanian: 252 (0.2%)
Moroccan: 238 (0.2%)
Russian: 186 (0.2%)
Syrian: 171 (0.1%)
German: 149 (0.1%)
British West Indian: 133 (0.1%)
Trinidadian and Tobagonian: 105 (0.09%)
West Indian: 102 (0.08%)
Ethiopian: 100 (0.08%)
Polish: 97 (0.08%)
Afghan: 70 (0.06%)
Nigerian: 69 (0.06%)
English: 69 (0.06%)
Serbian: 61 (0.05%)
Yugoslavian: 54 (0.04%)
Hungarian: 49 (0.04%)
Portuguese: 46 (0.04%)
Canadian: 40 (0.03%)
Iraqi: 38 (0.03%)
Macedonian: 33 (0.03%)
Greek: 31 (0.03%)
Slovak: 29 (0.02%)
Czechoslovakian: 27 (0.02%)
Norwegian: 23 (0.02%)
Lebanese: 20 (0.02%)
Lithuanian: 16 (0.01%)
Romanian: 15 (0.01%)
Ugandan: 13 (0.01%)
Scottish: 12 (0.01%)
European: 11 (0.01%)
Armenian: 11 (0.01%)
French Canadian: 8 (0.01%)
Dutch: 7 (0.01%)
Most common places of birth for foreign-born residents (%): Dominican Republic Paterson:
45.0% (31,511)New Jersey:
9.7% (209,055)
Peru Paterson:
9.5% (6,669)New Jersey:
2.7% (58,563)
Colombia Paterson:
8.3% (5,801)New Jersey:
4.2% (90,817)
Bangladesh Paterson:
7.1% (4,962)New Jersey:
0.7% (14,405)
Mexico Paterson:
5.7% (4,014)New Jersey:
4.8% (102,527)
Jamaica Paterson:
5.7% (4,000)New Jersey:
2.2% (47,365)
Ecuador Paterson:
2.8% (1,973)New Jersey:
4.4% (95,275)
El Salvador Paterson:
1.7% (1,211)New Jersey:
2.3% (48,885)
Place of birth for U.S.-born residents:
This state: 67,205Other state: 17,239Northeast: 10,652Midwest: 259South: 5,960West: 368 92.6% of Paterson residents lived in the same house 1 years ago.
Out of people who lived in different houses, 41.5% lived in this county.
Out of people who lived in different counties, 72.1% lived in New Jersey.
Paterson:
92.6%State average:
90.4%
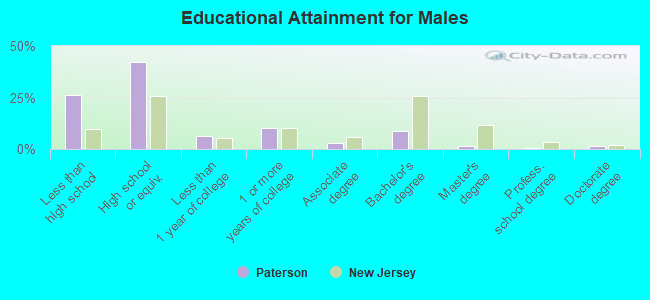
Education attainment for males 25 years and older:
No schooling: 1,215Nursery to 4th grade: 6375th and 6th grade: 2,2527th and 8th grade: 2,9459th grade: 58410th grade: 1,40311th grade: 1,90312th grade, no diploma: 1,752High school graduate (or equivalency): 20,268Less than 1 year of college: 3,016Some college more than 1 year, no degree: 5,010Associate degree: 1,404Bachelor's degree: 4,258Master's degree: 646Professional school degree: 178Doctorate degree: 682
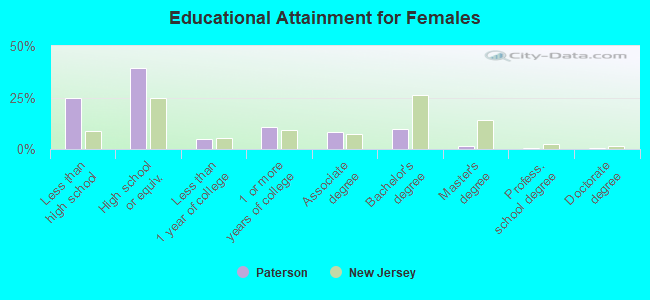
Education attainment for females 25 years and older:
No schooling: 1,817Nursery to 4th grade: 1,2625th and 6th grade: 1,8767th and 8th grade: 2,3339th grade: 80310th grade: 1,73711th grade: 1,17812th grade, no diploma: 1,130High school graduate (or equivalency): 19,449Less than 1 year of college: 2,295Some college more than 1 year, no degree: 5,231Associate degree: 4,098Bachelor's degree: 4,870Master's degree: 780Professional school degree: 191Doctorate degree: 232
Housing units in structures:
One, detached: 8,915One, attached: 2,929Two: 15,5823 or 4: 11,1195 to 9: 3,16210 to 19: 3,75420 to 49: 2,13050 or more: 5,474Mobile homes: 94Housing units lacking complete plumbing facilities in 2022: 1.5%Housing units lacking complete kitchen facilities in 2022: 4.5%House/condo owner moved in on average 13 years ago
Renter moved in on average 5 years ago
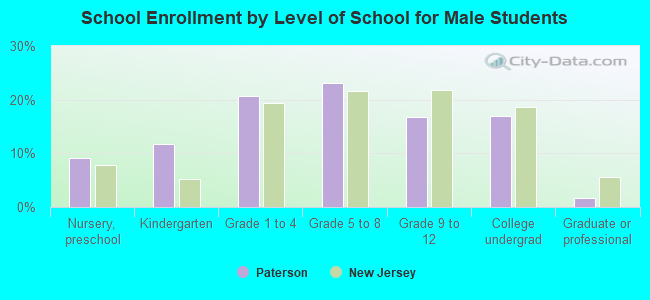
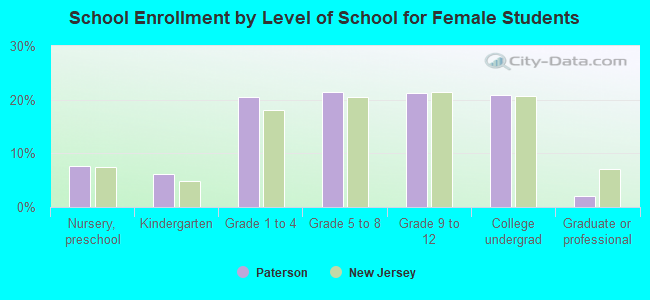
Private vs. public school enrollment:
Students in private schools in grades 1 to 8 (elementary and middle school): 389 Here:
2.0%New Jersey:
12.3%
Students in private schools in grades 9 to 12 (high school): 375 Here:
4.3%New Jersey:
13.1%
Students in private undergraduate colleges: 1,310 Here:
15.2%New Jersey:
33.2%