Pittsburgh, PA (Pennsylvania) Houses and Residents
| Pittsburgh: | $209,200 |
| Pennsylvania: | $245,500 |
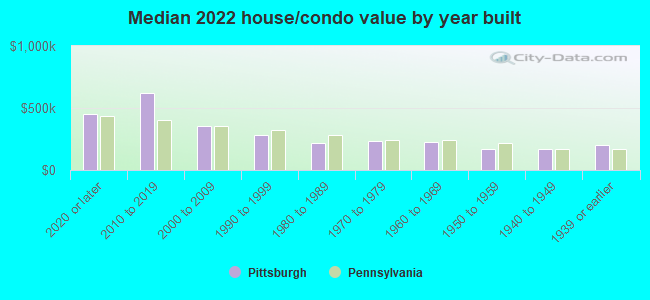
Mean price in 2022:
Detached houses: $252,137
Here: $252,137 State: $317,202 Townhouses or other attached units: $300,901
Here: $300,901 State: $254,369 In 2-unit structures: $262,039
Here: $262,039 State: $249,182 In 3-to-4-unit structures: $320,264
Here: $320,264 State: $297,446 In 5-or-more-unit structures: $371,640
Here: $371,640 State: $320,068 Mobile homes: $98,852
Here: $98,852 State: $92,414
Total population: 305,412 (All urban)
Houses: 161,999 (136,444 occupied: 67,305 owner occupied, 69,139 renter occupied)
| % of renters here: | 51% |
| State: | 31% |
Housing density: 2,914 houses/condos per square mile
Median price asked for vacant for-sale houses and condos in 2022: $189,466.
Median contract rent in 2022: $981 (lower quartile is $722, upper quartile is $1,378)
Median rent asked for vacant for-rent units in 2022: $1,212
Median gross rent in Pittsburgh, PA in 2022: $1,180
Housing units in Pittsburgh with a mortgage: 38,180 (4,814 second mortgage, 201 home equity loan, 4,074 both second mortgage and home equity loan)
Houses without a mortgage: 1,978
Median household income for houses/condos with a mortgage: $102,064
Median household income for apartments without a mortgage: $68,259
Median monthly housing costs: $1,096
Compare current foreclosures in Pittsburgh, PA:
| Photo | Address | Area | Beds / Baths | Price | Details |
|---|---|---|---|---|---|

|
#1
Semicir St
Pittsburgh, PA 15214
|
537 sq. feet
|
1 baths 1 beds |
$21,000
|
show details |

|
#2
Brinwood Ave
Pittsburgh, PA 15227
|
1,000 sq. feet
|
2 baths 3 beds |
$239,900
|
show details |

|
#3
Kirk Ave
Pittsburgh, PA 15227
|
1,500 sq. feet
|
2 baths 3 beds |
$217,500
|
show details |

|
#4
Wedgewood Dr
Pittsburgh, PA 15229
|
835 sq. feet
|
1 baths 2 beds |
$138,500
|
show details |

|
#5
Triana St
Pittsburgh, PA 15210
|
1,184 sq. feet
|
1 baths 3 beds |
$163,500
|
show details |

|
#6
Joan Dr
Pittsburgh, PA 15235
|
1,725 sq. feet
|
2 baths 3 beds |
$219,900
|
show details |

|
#7
Marbury Rd
Pittsburgh, PA 15221
|
- sq. feet
|
2 baths 3 beds |
$267,900
|
show details |

|
#8
Crucible St
Pittsburgh, PA 15220
|
1,980 sq. feet
|
2 baths 4 beds |
show details | |

|
#9
North Ave Apt 1
Pittsburgh, PA 15221
|
1,759 sq. feet
|
2 baths 2 beds |
show details | |

|
#10
Long Rd
Pittsburgh, PA 15235
|
1,780 sq. feet
|
1 baths 3 beds |
show details |
| Photo | Address | Area | Beds / Baths | Price | Details |
|---|---|---|---|---|---|

|
#11
Idlewild St
Pittsburgh, PA 15208
|
1,730 sq. feet
|
1 baths 4 beds |
show details | |

|
#12
Ruthwood Ave
Pittsburgh, PA 15227
|
1,019 sq. feet
|
1 baths 3 beds |
show details | |

|
#13
Hatfield St
Pittsburgh, PA 15201
|
1,798 sq. feet
|
1 baths 2 beds |
show details | |

|
#14
Oakleaf Rd
Pittsburgh, PA 15227
|
1,163 sq. feet
|
1 baths 3 beds |
show details | |

|
#15
Lehr Ave
Pittsburgh, PA 15223
|
1,242 sq. feet
|
1 baths 3 beds |
show details | |

|
#16
Fallowfield Ave
Pittsburgh, PA 15216
|
888 sq. feet
|
1 baths 2 beds |
show details | |

|
#17
Edgewood Dr
Pittsburgh, PA 15241
|
2,256 sq. feet
|
2 baths 4 beds |
show details | |

|
#18
Elwood Dr
Pittsburgh, PA 15235
|
970 sq. feet
|
1 baths 3 beds |
show details | |

|
#19
Patterson St
Pittsburgh, PA 15203
|
1,296 sq. feet
|
2 baths 3 beds |
show details | |

|
#20
Catskill Ave
Pittsburgh, PA 15227
|
1,382 sq. feet
|
2 baths 3 beds |
show details |
| Photo | Address | Area | Beds / Baths | Price | Details |
|---|---|---|---|---|---|

|
#21
Amanda Ave
Pittsburgh, PA 15210
|
1,993 sq. feet
|
1 baths 3 beds |
show details | |

|
#22
Osage Dr
Pittsburgh, PA 15235
|
1,421 sq. feet
|
1 baths 2 beds |
show details | |

|
#23
Black Oak Dr
Pittsburgh, PA 15235
|
1,508 sq. feet
|
3 baths 4 beds |
show details | |

|
#24
Berkshire Ave
Pittsburgh, PA 15226
|
1,774 sq. feet
|
1 baths 2 beds |
show details | |

|
#25
Good Ln
Pittsburgh, PA 15237
|
988 sq. feet
|
1 baths 3 beds |
show details | |

|
#26
Lucerne Ave
Pittsburgh, PA 15214
|
1,937 sq. feet
|
1 baths 3 beds |
show details | |

|
#27
Veronica Dr
Pittsburgh, PA 15235
|
920 sq. feet
|
1 baths 2 beds |
show details | |

|
#28
Dawson St
Pittsburgh, PA 15213
|
1,462 sq. feet
|
1 baths 2 beds |
show details | |

|
#29
Cloverlea St
Pittsburgh, PA 15227
|
1,200 sq. feet
|
1 baths 3 beds |
show details | |

|
#30
Woodbine St
Pittsburgh, PA 15201
|
1,668 sq. feet
|
1 baths 3 beds |
show details |
| Photo | Address | Area | Beds / Baths | Price | Details |
|---|---|---|---|---|---|

|
#31
Western Ave
Pittsburgh, PA 15233
|
4,800 sq. feet
|
3 baths 5 beds |
show details | |

|
#32
Rodgers St
Pittsburgh, PA 15207
|
2,048 sq. feet
|
2 baths 4 beds |
show details | |

|
#33
E Cherryhill St
Pittsburgh, PA 15210
|
626 sq. feet
|
1 baths 2 beds |
show details | |

|
#34
Baptist Rd
Pittsburgh, PA 15236
|
1,499 sq. feet
|
1 baths 3 beds |
show details | |

|
#35
S 18th St
Pittsburgh, PA 15203
|
1,240 sq. feet
|
1 baths 2 beds |
show details | |

|
#36
North Ave
Pittsburgh, PA 15209
|
1,386 sq. feet
|
1 baths 3 beds |
show details | |

|
#37
Cypress Hill Dr
Pittsburgh, PA 15235
|
2,080 sq. feet
|
2 baths 4 beds |
show details | |

|
#38
Spring Garden Rd
Pittsburgh, PA 15212
|
1,088 sq. feet
|
1 baths 2 beds |
show details | |

|
#39
Union Ave
Pittsburgh, PA 15202
|
1,948 sq. feet
|
2 baths 5 beds |
show details | |

|
#40
Mckenzie Dr
Pittsburgh, PA 15235
|
1,428 sq. feet
|
1 baths 3 beds |
show details |
| Photo | Address | Area | Beds / Baths | Price | Details |
|---|---|---|---|---|---|

|
#41
Mccully Rd
Pittsburgh, PA 15234
|
1,750 sq. feet
|
2 baths 5 beds |
show details | |

|
#42
Johnston Rd
Pittsburgh, PA 15235
|
1,228 sq. feet
|
1 baths 2 beds |
show details | |

|
#43
W Run Rd
Pittsburgh, PA 15207
|
1,997 sq. feet
|
1 baths 3 beds |
show details | |

|
#44
Azalea Dr
Pittsburgh, PA 15235
|
956 sq. feet
|
2 baths 3 beds |
show details | |

|
#45
Morton Ln
Pittsburgh, PA 15226
|
1,015 sq. feet
|
1 baths 3 beds |
show details | |

|
#46
Lakewood Ave
Pittsburgh, PA 15220
|
1,852 sq. feet
|
2 baths 4 beds |
show details | |

|
#47
Dawson Ave
Pittsburgh, PA 15202
|
2,186 sq. feet
|
1 baths 4 beds |
show details | |

|
#48
Chalfant St
Pittsburgh, PA 15221
|
1,272 sq. feet
|
1 baths 2 beds |
show details | |

|
#49
Eiler Ave
Pittsburgh, PA 15210
|
1,775 sq. feet
|
1 baths 3 beds |
show details | |

|
Check over 1 million property listings on Foreclosure.com!
|
browse all offers | |||

Latest news about housing in Pittsburgh, PA collected exclusively by city-data.com from local newspapers, TV, and radio stations


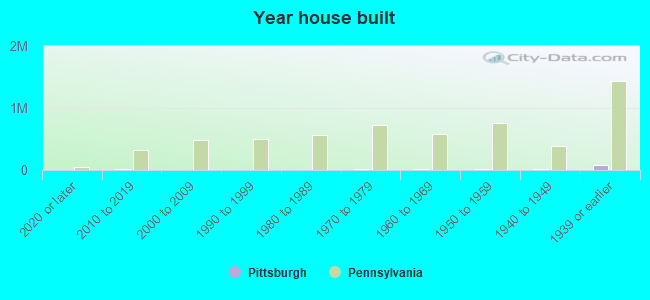
Median year apartment built: 1955
Household type by relationship:
Households: 302,905- Male householders: 67,034 (31,447 living alone), Female householders: 69,410 (31,447 living alone)
37,002 spouses (36,244 opposite-sex spouses), 13,244 unmarried partners, (11,721 opposite-sex unmarried partners), 57,906 children (55,409 natural, 910 adopted, 1,587 stepchildren), 3,359 grandchildren, 3,196 brothers or sisters, 1,696 parents, 446 foster children, 3,629 other relatives, 21,844 non-relatives
- In group quarters: 24,139
Size of family households: 29,351 2-persons, 12,327 3-persons, 8,023 4-persons, 3,505 5-persons, 469 6-persons, 1,028 7-or-more-persons.
Size of nonfamily households: 62,894 1-person, 15,301 2-persons, 1,884 3-persons, 684 4-persons, 498 5-persons, 362 6-persons, 118 7-or-more-persons.
22,048 married couples with children.
18,390 single-parent households (5,289 men, 13,101 women).
88.2% of residents of Pittsburgh speak English at home.
2.8% of residents speak Spanish at home (72% speak English very well, 16% speak English well, 9% speak English not well, 3% don't speak English at all).
4.0% of residents speak other Indo-European language at home (73% speak English very well, 14% speak English well, 10% speak English not well, 3% don't speak English at all).
3.6% of residents speak Asian or Pacific Island language at home (63% speak English very well, 28% speak English well, 8% speak English not well, 2% don't speak English at all).
1.3% of residents speak other language at home (70% speak English very well, 18% speak English well, 8% speak English not well, 5% don't speak English at all).
Foreign born population: 24,916 (8.2%)
(39.1% of them are naturalized citizens)
| Here: | 6.4 |
| State: | 6.8 |
| Here: | 3.9 |
| State: | 4.3 |
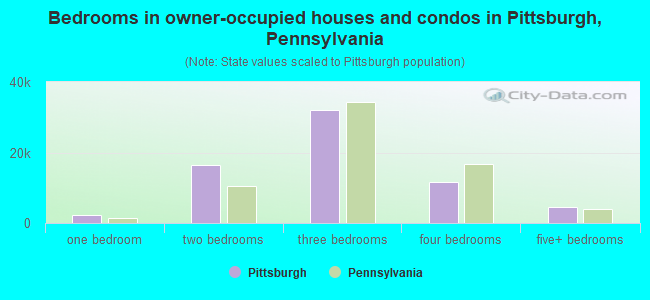
- Bedrooms in owner-occupied houses and condos in Pittsburgh, Pennsylvania
- 192no bedroom
- 2,3121 bedroom
- 16,5452 bedrooms
- 32,1393 bedrooms
- 11,5764 bedrooms
- 4,5415+ bedrooms
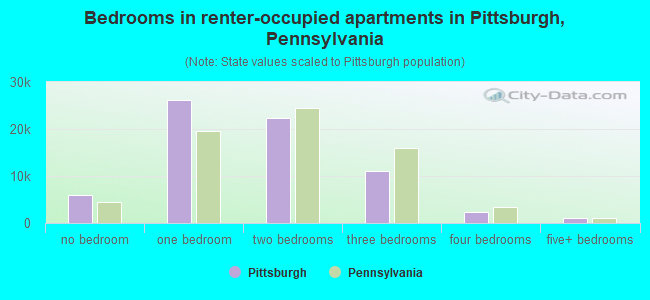
- Bedrooms in renter-occupied apartments in Pittsburgh, Pennsylvania
- 5,975no bedroom
- 26,1691 bedroom
- 22,3512 bedrooms
- 11,1563 bedrooms
- 2,4054 bedrooms
- 1,0835+ bedrooms
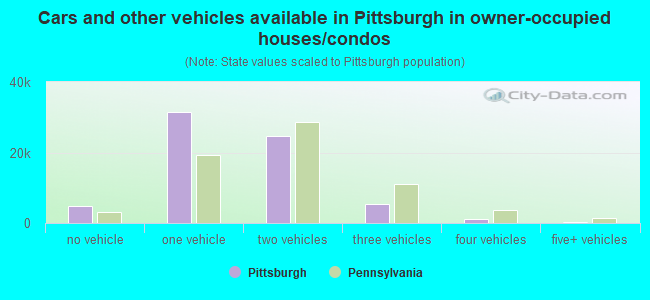
- Cars and other vehicles available in Pittsburgh in owner-occupied houses/condos
- 4,683no vehicle
- 31,4481 vehicle
- 24,5422 vehicles
- 5,2503 vehicles
- 1,0804 vehicles
- 3025+ vehicles
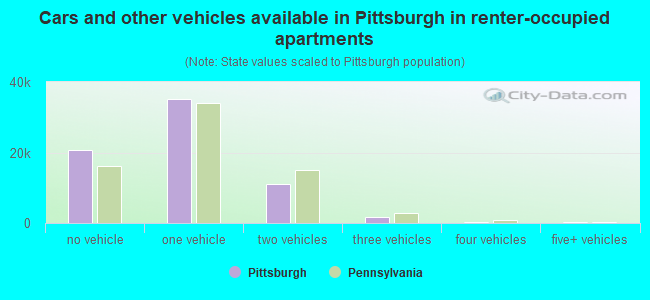
- Cars and other vehicles available in Pittsburgh in renter-occupied apartments
- 20,595no vehicle
- 35,2631 vehicle
- 10,9802 vehicles
- 1,7673 vehicles
- 3574 vehicles
- 1775+ vehicles
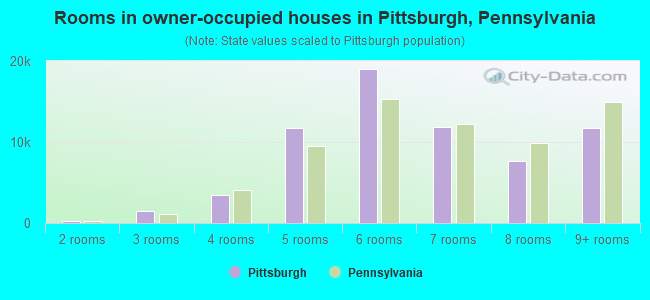
- Rooms in owner-occupied houses in Pittsburgh, Pennsylvania
- 1021 room
- 3052 rooms
- 1,5053 rooms
- 3,4884 rooms
- 11,7295 rooms
- 18,9676 rooms
- 11,8187 rooms
- 7,6048 rooms
- 11,7879+ rooms
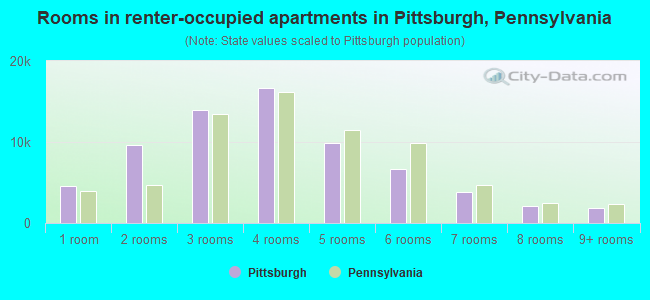
- Rooms in renter-occupied apartments in Pittsburgh, Pennsylvania
- 4,5511 room
- 9,6092 rooms
- 13,9083 rooms
- 16,6964 rooms
- 9,8605 rooms
- 6,6686 rooms
- 3,8517 rooms
- 2,1548 rooms
- 1,8429+ rooms
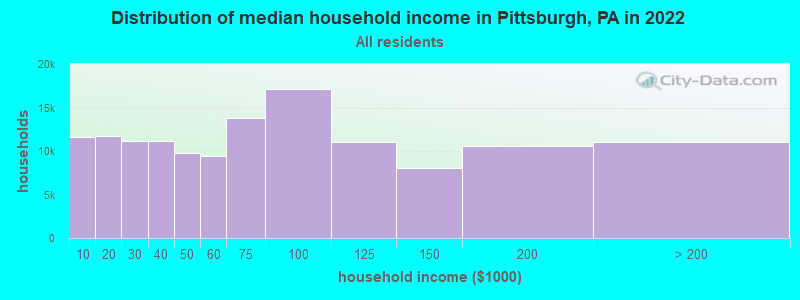
Pittsburgh, PA household income distribution

- 11,637Less than $10,000
- 11,703$10,000 to $19,999
- 11,145$20,000 to $29,999
- 11,202$30,000 to $39,999
- 9,767$40,000 to $49,999
- 9,462$50,000 to $59,999
- 13,783$60,000 to $74,999
- 17,140$75,000 to $99,999
- 11,011$100,000 to $124,999
- 8,038$125,000 to $149,999
- 10,554$150,000 to $199,999
- 11,002$200,000 or more
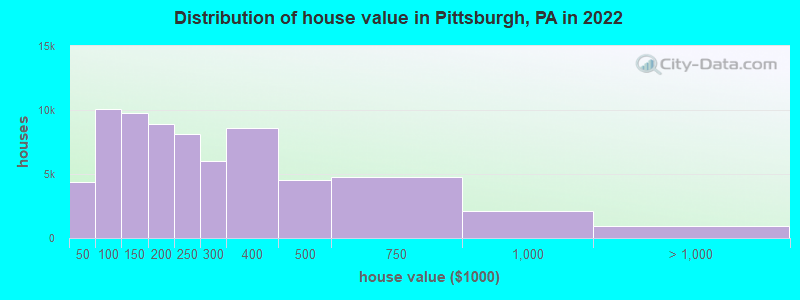
Home value of owner - occupied houses in 2022 in Pittsburgh, PA
-
- 305Less than $10,000
- 205$10,000 to $14,999
- 421$15,000 to $19,999
- 446$20,000 to $24,999
- 799$25,000 to $29,999
- 755$30,000 to $34,999
- 463$35,000 to $39,999
- 964$40,000 to $49,999
- 1,797$50,000 to $59,999
- 1,598$60,000 to $69,999
- 2,009$70,000 to $79,999
- 1,752$80,000 to $89,999
- 1,990$90,000 to $99,999
- 6,415$100,000 to $124,999
- 3,377$125,000 to $149,999
- 4,979$150,000 to $174,999
- 3,894$175,000 to $199,999
- 8,097$200,000 to $249,999
- 6,025$250,000 to $299,999
- 8,571$300,000 to $399,999
- 4,544$400,000 to $499,999
- 4,801$500,000 to $749,999
- 2,133$750,000 to $999,999
- 788$1,000,000 to $1,499,999
- 72$1,500,000 to $1,999,999
- 105$2,000,000 or more
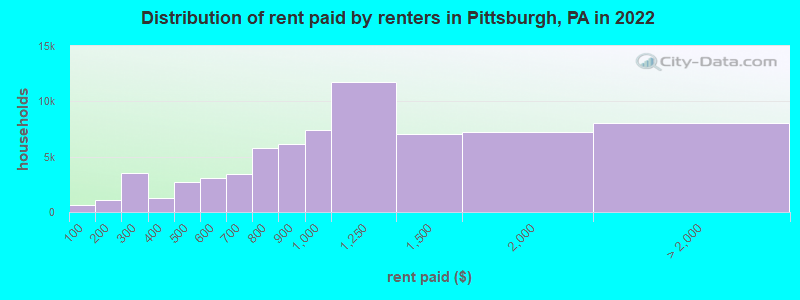
Rent paid by renters in 2022 in Pittsburgh, PA
-
- 647Less than $100
- 304$100 to $149
- 806$150 to $199
- 2,177$200 to $249
- 1,325$250 to $299
- 725$300 to $349
- 516$350 to $399
- 1,453$400 to $449
- 1,216$450 to $499
- 1,964$500 to $549
- 1,137$550 to $599
- 1,659$600 to $649
- 1,785$650 to $699
- 2,411$700 to $749
- 3,341$750 to $799
- 6,138$800 to $899
- 7,393$900 to $999
- 11,741$1,000 to $1,249
- 7,089$1,250 to $1,499
- 7,228$1,500 to $1,999
- 4,196$2,000 to $2,499
- 1,305$2,500 to $2,999
- 323$3,000 to $3,499
- 277$3,500 or more
- 1,983No cash rent
Percentage of workers working in this county: 95.6%
Number of people working at home: 35,888 (22.9% of all workers)
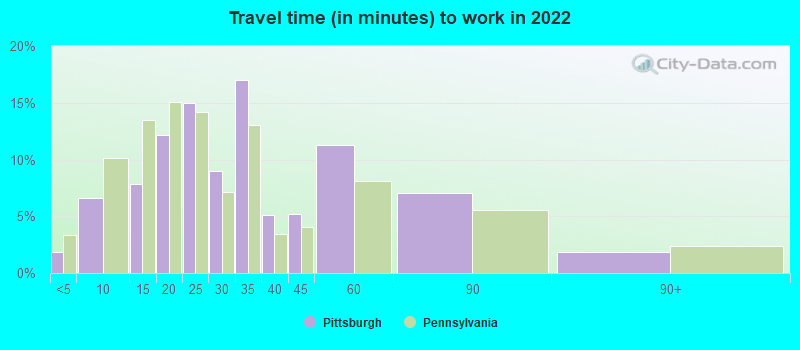
Travel time to work (commute)
- Less than 5 minutes: 3,090
- 5 to 9 minutes: 13,113
- 10 to 14 minutes: 15,015
- 15 to 19 minutes: 23,537
- 20 to 24 minutes: 22,019
- 25 to 29 minutes: 10,262
- 30 to 34 minutes: 17,067
- 35 to 39 minutes: 3,200
- 40 to 44 minutes: 3,763
- 45 to 59 minutes: 6,313
- 60 to 89 minutes: 3,116
- 90 or more minutes: 355
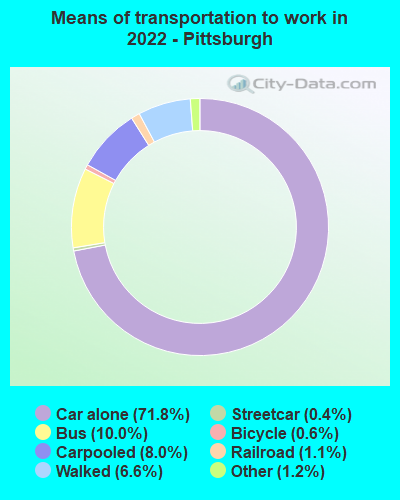
Means of transportation to work:
- Drove a car alone: 169,897 (62.3%)
- Carpooled: 19,049 (7.0%)
- Bus: 23,761 (8.7%)
- Subway or elevated rail: 1,030 (0.4%)
- Light rail, streetcar or trolley: 2,703 (1.0%)
- Ferryboat: 70 (0.0%)
- Taxi: 2,877 (1.1%)
- Bicycle: 1,516 (0.6%)
- Walked: 15,735 (5.8%)
- Worked at home: 35,888 (13.2%)
- Unemployment by race in 2022
- Unemployment rate for White non-Hispanic residents
- 5.2%Males
- 3.6%Females
- Unemployment rate for Black residents
- 8.9%Males
- 9.7%Females
- Unemployment rate for American Indian and Alaska Native residents
- 29.1%Males
- 1.2%Females
- Unemployment rate for Asian residents
- 1.5%Males
- 2.8%Females
- Unemployment rate for other race residents
- 4.9%Males
- 2.2%Females
- Unemployment rate for two or more race residents
- 7.6%Males
- 10.2%Females
- Unemployment rate for Hispanic or Latino residents
- 6.7%Males
- 2.8%Females
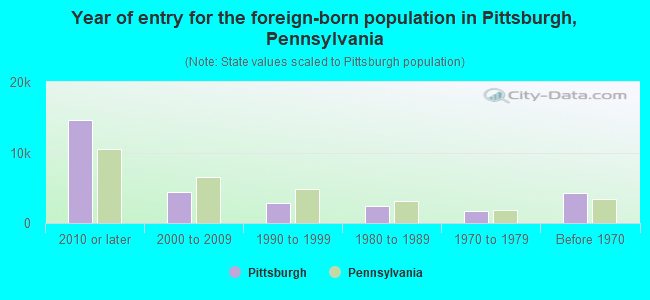
- Year of entry for the foreign-born population in Pittsburgh, Pennsylvania
- 14,6082010 or later
- 4,3442000 to 2009
- 2,8631990 to 1999
- 2,3821980 to 1989
- 1,6881970 to 1979
- 4,296Before 1970
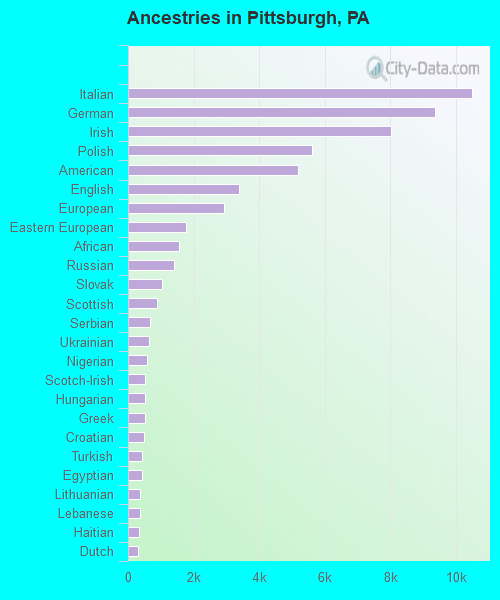
First ancestries reported:
- Italian: 10,496 (8.3%)
- German: 9,364 (7.4%)
- Irish: 8,043 (6.3%)
- Polish: 5,615 (4.4%)
- American: 5,194 (4.1%)
- English: 3,379 (2.7%)
- European: 2,917 (2.3%)
- Eastern European: 1,759 (1.4%)
- African: 1,549 (1.2%)
- Russian: 1,397 (1.1%)
- Slovak: 1,029 (0.8%)
- Scottish: 885 (0.7%)
- Serbian: 683 (0.5%)
- Ukrainian: 632 (0.5%)
- Nigerian: 571 (0.5%)
- Scotch-Irish: 521 (0.4%)
- Hungarian: 512 (0.4%)
- Greek: 507 (0.4%)
- Croatian: 500 (0.4%)
- Turkish: 429 (0.3%)
- Egyptian: 417 (0.3%)
- Lithuanian: 362 (0.3%)
- Lebanese: 352 (0.3%)
- Haitian: 328 (0.3%)
- Dutch: 315 (0.2%)
- Norwegian: 299 (0.2%)
- Arab: 286 (0.2%)
- French Canadian: 279 (0.2%)
- Iranian: 278 (0.2%)
- French: 238 (0.2%)
- British: 227 (0.2%)
- Somali: 221 (0.2%)
- Brazilian: 214 (0.2%)
- Bahamian: 212 (0.2%)
- Jamaican: 210 (0.2%)
- Swedish: 194 (0.2%)
- Slovene: 193 (0.2%)
- Israeli: 184 (0.1%)
- Slavic: 180 (0.1%)
- Czech: 161 (0.1%)
- Northern European: 152 (0.1%)
- Ethiopian: 140 (0.1%)
- Canadian: 140 (0.1%)
- Kenyan: 134 (0.1%)
- Austrian: 133 (0.1%)
- Czechoslovakian: 130 (0.1%)
- Trinidadian and Tobagonian: 130 (0.1%)
- Romanian: 127 (0.1%)
- Swiss: 119 (0.09%)
- Sudanese: 106 (0.08%)
- Jordanian: 102 (0.08%)
- Bulgarian: 96 (0.08%)
- Ghanaian: 90 (0.07%)
- Welsh: 89 (0.07%)
- Macedonian: 88 (0.07%)
- Danish: 75 (0.06%)
- Armenian: 72 (0.06%)
- Albanian: 63 (0.05%)
- Carpatho Rusyn: 61 (0.05%)
- Australian: 57 (0.04%)
- Syrian: 56 (0.04%)
- Guyanese: 52 (0.04%)
- Senegalese: 45 (0.04%)
- Iraqi: 44 (0.03%)
- Yugoslavian: 44 (0.03%)
- Scandinavian: 36 (0.03%)
- Moroccan: 31 (0.02%)
- Pennsylvania German: 24 (0.02%)
- U.S. Virgin Islander: 23 (0.02%)
- Belgian: 21 (0.02%)
- Cape Verdean: 20 (0.02%)
- Basque: 19 (0.01%)
- Barbadian: 19 (0.01%)
- Finnish: 18 (0.01%)
- Latvian: 16 (0.01%)
- Palestinian: 14 (0.01%)
- Celtic: 14 (0.01%)
- Afghan: 12 (0.01%)
- Portuguese: 11 (0.01%)
Most common places of birth for foreign-born residents (%):
| Pittsburgh: | 15.2% (4,306) |
| Pennsylvania: | 7.2% (67,704) |
| Pittsburgh: | 8.6% (2,450) |
| Pennsylvania: | 10.7% (100,596) |
| Pittsburgh: | 3.8% (1,066) |
| Pennsylvania: | 5.8% (54,190) |
| Pittsburgh: | 3.4% (978) |
| Pennsylvania: | 1.8% (17,032) |
| Pittsburgh: | 2.9% (837) |
| Pennsylvania: | 2.9% (27,433) |
| Pittsburgh: | 2.9% (824) |
| Pennsylvania: | 1.6% (15,272) |
| Pittsburgh: | 2.7% (764) |
| Pennsylvania: | 1.9% (18,065) |
| Pittsburgh: | 2.0% (556) |
| Pennsylvania: | 1.1% (10,709) |
| Pittsburgh: | 1.9% (546) |
| Pennsylvania: | 1.8% (16,884) |
| Pittsburgh: | 1.9% (543) |
| Pennsylvania: | 0.8% (7,882) |
| Pittsburgh: | 1.8% (515) |
| Pennsylvania: | 0.5% (4,648) |
| Pittsburgh: | 1.8% (512) |
| Pennsylvania: | 0.5% (4,946) |
| Pittsburgh: | 1.8% (503) |
| Pennsylvania: | 1.1% (10,331) |
| Pittsburgh: | 1.7% (480) |
| Pennsylvania: | 0.6% (5,742) |
| Pittsburgh: | 1.7% (476) |
| Pennsylvania: | 3.3% (31,542) |
| Pittsburgh: | 1.6% (459) |
| Pennsylvania: | 1.4% (13,077) |
| Pittsburgh: | 1.6% (457) |
| Pennsylvania: | 0.5% (4,491) |
| Pittsburgh: | 1.6% (449) |
| Pennsylvania: | 2.2% (21,039) |
Place of birth for U.S.-born residents:
- This state: 199,492
- Other state: 74,046
- Northeast: 20,836
- Midwest: 20,199
- South: 23,955
- West: 9,056
79.3% of Pittsburgh residents lived in the same house 1 years ago.
Out of people who lived in different houses, 36.1% lived in this county.
Out of people who lived in different counties, 40.1% lived in Pennsylvania.
| Pittsburgh: | 79.3% |
| State average: | 89.3% |
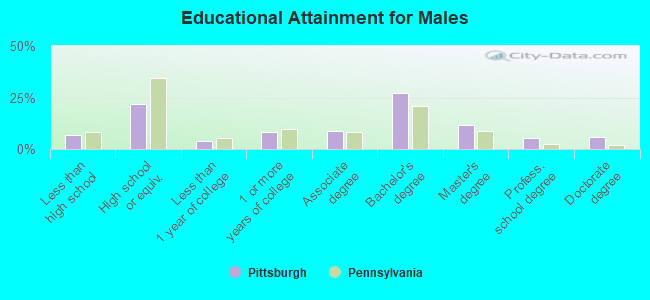
Education attainment for males 25 years and older:
- No schooling: 953
- Nursery to 4th grade: 108
- 5th and 6th grade: 255
- 7th and 8th grade: 371
- 9th grade: 816
- 10th grade: 1,367
- 11th grade: 2,302
- 12th grade, no diploma: 1,069
- High school graduate (or equivalency): 22,740
- Less than 1 year of college: 3,939
- Some college more than 1 year, no degree: 8,631
- Associate degree: 9,112
- Bachelor's degree: 27,792
- Master's degree: 12,216
- Professional school degree: 5,264
- Doctorate degree: 6,103
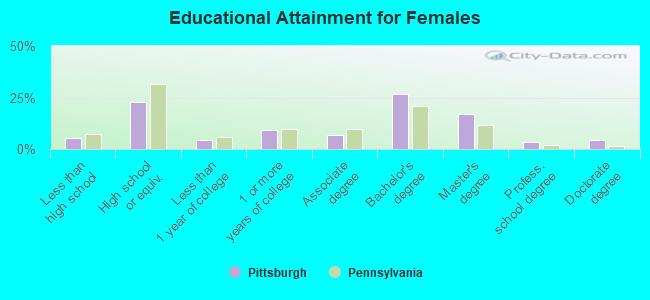
Education attainment for females 25 years and older:
- No schooling: 1,126
- Nursery to 4th grade: 0
- 5th and 6th grade: 204
- 7th and 8th grade: 805
- 9th grade: 177
- 10th grade: 895
- 11th grade: 1,361
- 12th grade, no diploma: 873
- High school graduate (or equivalency): 23,730
- Less than 1 year of college: 4,699
- Some college more than 1 year, no degree: 9,713
- Associate degree: 7,009
- Bachelor's degree: 27,550
- Master's degree: 17,303
- Professional school degree: 3,316
- Doctorate degree: 4,402
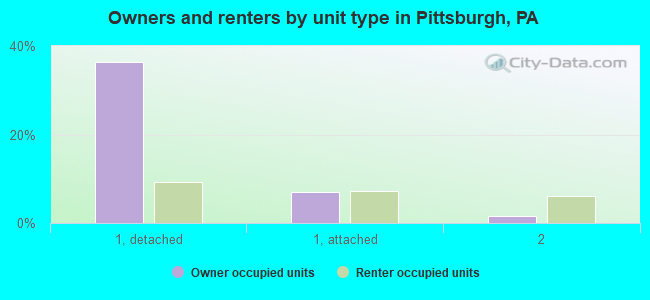
Housing units in structures:
- One, detached: 72,777
- One, attached: 22,063
- Two: 11,059
- 3 or 4: 10,210
- 5 to 9: 8,018
- 10 to 19: 7,633
- 20 to 49: 7,809
- 50 or more: 21,658
- Mobile homes: 772
Housing units lacking complete kitchen facilities in 2022: 3.6%
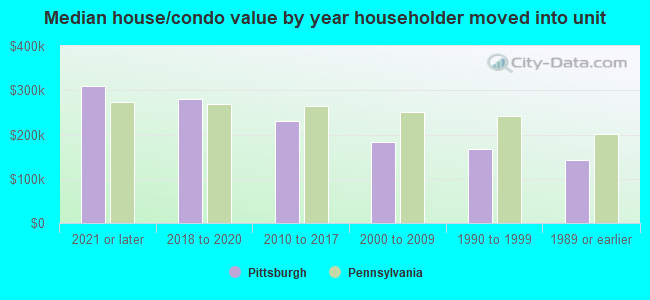
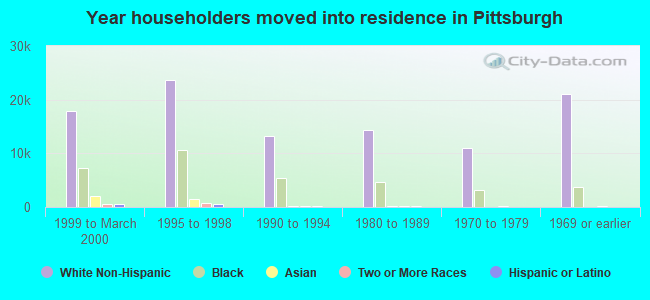
House/condo owner moved in on average 15 years ago
Renter moved in on average 2 years ago
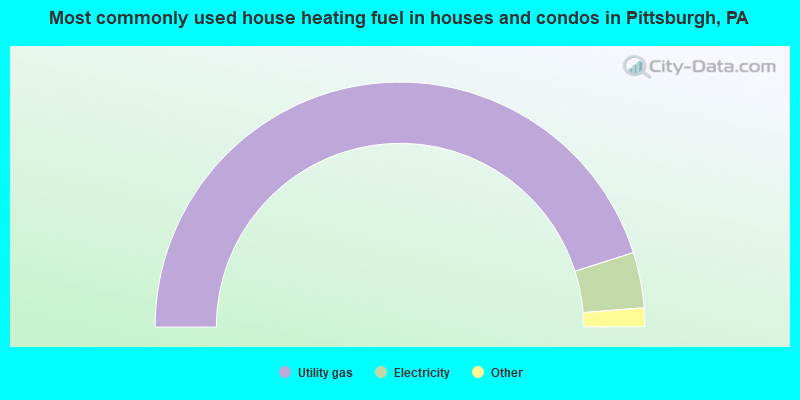
- 90.3%Utility gas
- 7.3%Electricity
- 1.8%Bottled, tank, or LP gas
- 0.4%Fuel oil, kerosene, etc.
- 0.3%Other fuel
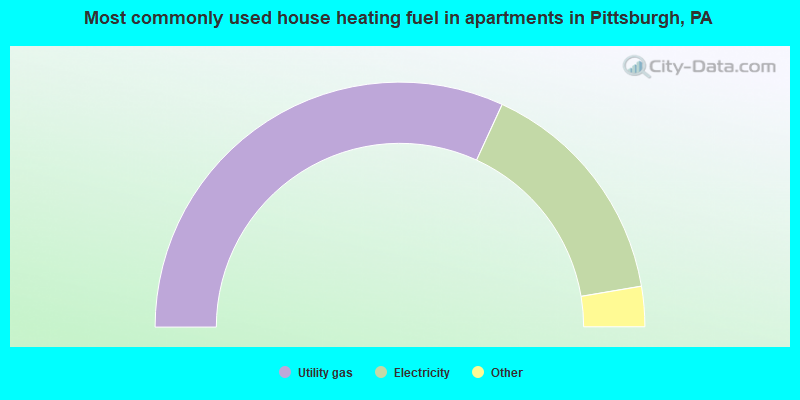
- 63.7%Utility gas
- 31.0%Electricity
- 2.8%Bottled, tank, or LP gas
- 1.5%No fuel used
- 0.5%Solar energy
- 0.3%Other fuel
- 0.2%Fuel oil, kerosene, etc.
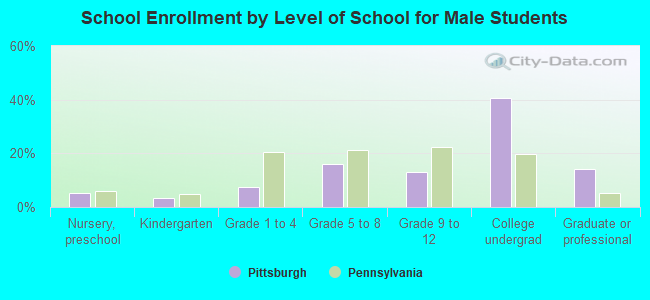
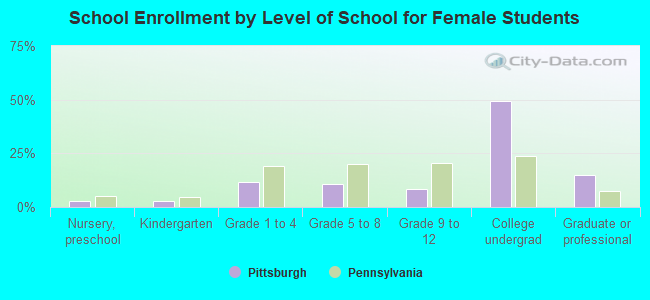
Private vs. public school enrollment:
| Here: | 18.5% |
| Pennsylvania: | 15.7% |
| Here: | 19.5% |
| Pennsylvania: | 13.4% |
| Here: | 39.5% |
| Pennsylvania: | 39.8% |