Plainfield, IN (Indiana) Houses and Residents
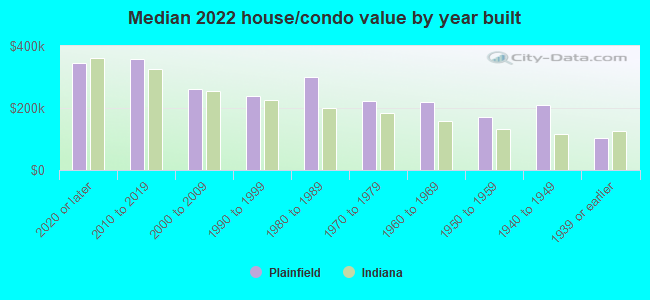
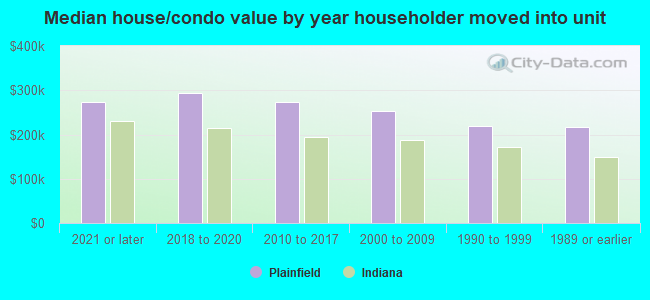
Estimated median house or condo value in 2022: $264,783 (it was $120,700 in 2000 )
Plainfield:
$264,783Indiana:
$208,700
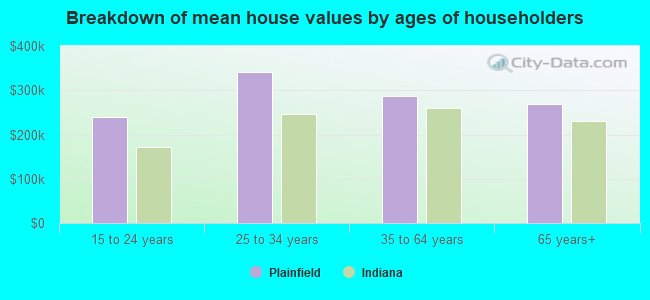
Lower value quartile - upper value quartile: $205,927 - $349,114Mean price in 2022: Detached houses: $291,473 Here:
$291,473State:
$257,916
Townhouses or other attached units: $257,045 Here:
$257,045State:
$224,114
In 2-unit structures: $188,930 Here:
$188,930State:
$175,375
Total population: 30,409 (Urban population: 18,318, Rural population: 565 (41 farm, 524 nonfarm ))
Houses: 13,813 (13,320 occupied: 8,395 owner occupied, 4,862 renter occupied )
% of renters here:
37%State:
29%
Housing density: 768 houses/condos per square mile
Median price asked for vacant for-sale houses and condos in 2022: $442,116.
Median contract rent in 2022: $1,132 (lower quartile is $828, upper quartile is $1,396)
Median rent asked for vacant for-rent units in 2022: $880
Median gross rent in Plainfield, IN in 2022: $1,293
Housing units in Plainfield with a mortgage: 5,653 (789 second mortgage, 25 home equity loan, 545 both second mortgage and home equity loan )Houses without a mortgage: 197
Median household income for houses/condos with a mortgage: $97,161
Median household income for apartments without a mortgage: $54,467
Median monthly housing costs: $1,190
Data:
Median house or condo value ($)
Median house or condo value ($ change since 2000)
Median house or condo value ($) - White
Median house or condo value ($) - Black or African American
Median house or condo value ($) - Asian
Median house or condo value ($) - Hispanic or Latino
Median house or condo value ($) - American Indian and Alaska Native
Median house or condo value ($) - Multirace
Median house or condo value ($) - Other Race
Median price asked for mobile homes ($)
Household density (households per square mile)
Mean house or condo value by units in structure - 1, detached ($)
Mean house or condo value by units in structure - 1, attached ($)
Mean house or condo value by units in structure - 2 ($)
Mean house or condo value by units in structure by units in structure - 3 or 4 ($)
Mean house or condo value by units in structure - 5 or more ($)
Mean house or condo value by units in structure - Boat, RV, van, etc. ($)
Mean house or condo value by units in structure - Mobile home ($)
Median contract rent ($)
Median contract rent - Lower quartile ($)
Median contract rent - Upper quartile ($)
Median gross rent ($)
Urban houses (%)
Rural houses (%)
Houses occupied (%)
Houses occupied (% change since 2000)
Houses owner occupied (%)
Houses owner occupied (% change since 2000)
Houses renter occupied (%)
Houses renter occupied (% change since 2000)
Vacant housing units - For rent (%)
Vacant housing units - For rent (% change since 2000)
Vacant housing units - For sale only (%)
Vacant housing units - For sale only (% change since 2000)
Vacant housing units - Rented or sold, not occupied (%)
Vacant housing units - Rented or sold, not occupied (% change since 2000)
Vacant housing units - For seasonal, recreational, or occasional use (%)
Vacant housing units - For seasonal, recreational, or occasional use (% change since 2000)
Vacant housing units - For migrant workers (%)
Vacant housing units - For migrant workers (% change since 2000)
Vacant housing units - Other vacant (%)
Vacant housing units - Other vacant (% change since 2000)
Median monthly housing costs ($)
Median household income for houses/condos with a mortgage ($)
Median household income for houses/condos without a mortgage ($)
Median household income ($)
Median household income ($) - White
Median household income ($) - Black or African American
Median household income ($) - Asian
Median household income ($) - Hispanic or Latino
Median household income ($) - American Indian and Alaska Native
Median household income ($) - Multirace
Median household income ($) - Other Race
Mortgage status - with mortgage (%)
Mortgage status - with second mortgage (%)
Mortgage status - with home equity loan (%)
Mortgage status - with both second mortgage and home equity loan (%)
Mortgage status - without a mortgage (%)
Median year house/condo built
Median year apartment built
Household type by relationship - Male householder living alone (%)
Household type by relationship - Male householder not living alone (%)
Household type by relationship - Female householder living alone (%)
Household type by relationship - Female householder not living alone (%)
Household type by relationship - Opposite-Sex spouse (%)
Household type by relationship - Same-Sex spouse (%)
Household type by relationship - Opposite-Sex unmarried partner (%)
Household type by relationship - Same-Sex unmarried partner (%)
Household type by relationship - In group quarters (%)
Size of family households - 2-person household (%)
Size of family households - 3-person household (%)
Size of family households - 4-person household (%)
Size of family households - 5-person household (%)
Size of family households - 6-person household (%)
Size of family households - 7-or-more-person household (%)
Size of nonfamily households - 1-person household (%)
Size of nonfamily households - 2-person household (%)
Size of nonfamily households - 3-person household (%)
Size of nonfamily households - 4-person household (%)
Size of nonfamily households - 5-person household (%)
Size of nonfamily households - 6-person household (%)
Size of nonfamily households - 7-or-moreperson household (%)
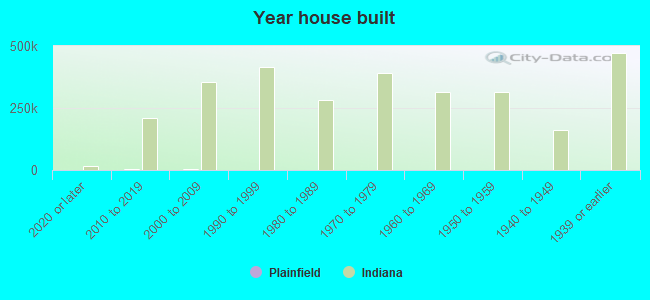
Year house built - Built 2010 or later (%)
Year house built - Built 2000 to 2009 (%)
Year house built - Built 1990 to 1999 (%)
Year house built - Built 1980 to 1989 (%)
Year house built - Built 1970 to 1979 (%)
Year house built - Built 1960 to 1969 (%)
Year house built - Built 1950 to 1959 (%)
Year house built - Built 1940 to 1949 (%)
Year house built - Built 1939 or earlier (%)
Median number of rooms in houses and condos
Median number of rooms in apartments
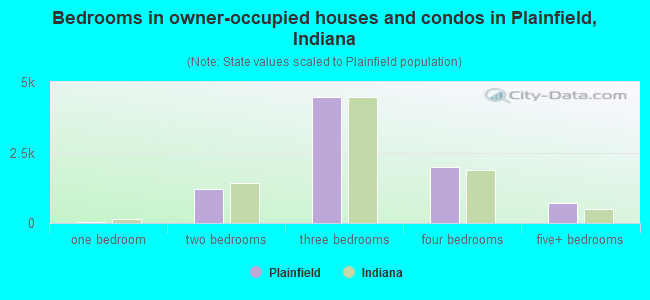
Median number of bedrooms in owner occupied houses
Mean number of bedrooms in owner occupied houses
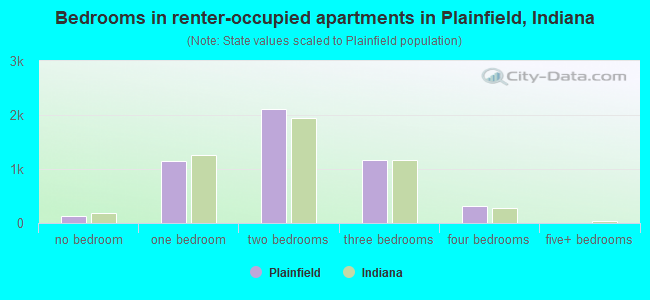
Median number of bedrooms in renter occupied houses
Mean number of bedrooms in renter occupied houses
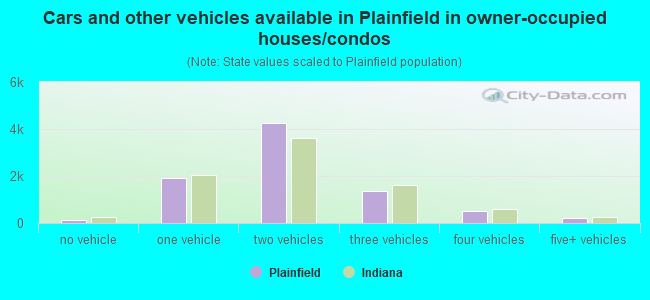
Median number of vehichles in owner occupied houses
Mean number of vehichles in owner occupied houses
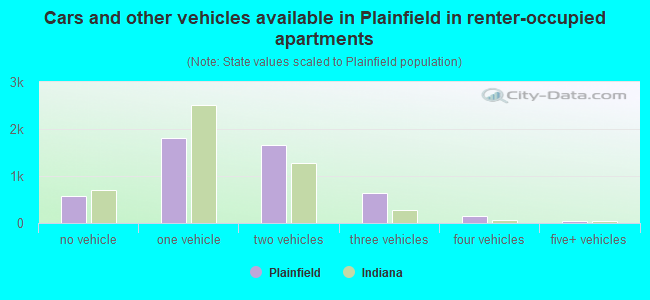
Median number of vehichles in renter occupied houses
Mean number of vehichles in renter occupied houses
Rooms in owner-occupied houses - 1 room (%)
Rooms in owner-occupied houses - 2 rooms (%)
Rooms in owner-occupied houses - 3 rooms (%)
Rooms in owner-occupied houses - 4 rooms (%)
Rooms in owner-occupied houses - 5 rooms (%)
Rooms in owner-occupied houses - 6 rooms (%)
Rooms in owner-occupied houses - 7 rooms (%)
Rooms in owner-occupied houses - 8 rooms (%)
Rooms in owner-occupied houses - 9+ rooms (%)
Rooms in renter-occupied houses - 1 room (%)
Rooms in renter-occupied houses - 2 rooms (%)
Rooms in renter-occupied houses - 3 rooms (%)
Rooms in renter-occupied houses - 4 rooms (%)
Rooms in renter-occupied houses - 5 rooms (%)
Rooms in renter-occupied houses - 6 rooms (%)
Rooms in renter-occupied houses - 7 rooms (%)
Rooms in renter-occupied houses - 8 rooms (%)
Rooms in renter-occupied houses - 9+ rooms (%)
Bedrooms in owner-occupied houses - no bedrooms (%)
Bedrooms in owner-occupied houses - 1 bedroom (%)
Bedrooms in owner-occupied houses - 2 bedrooms (%)
Bedrooms in owner-occupied houses - 3 bedrooms (%)
Bedrooms in owner-occupied houses - 4 bedrooms (%)
Bedrooms in owner-occupied houses - 5+ bedrooms (%)
Bedrooms in renter-occupied houses - no bedrooms (%)
Bedrooms in renter-occupied houses - 1 bedroom (%)
Bedrooms in renter-occupied houses - 2 bedrooms (%)
Bedrooms in renter-occupied houses - 3 bedrooms (%)
Bedrooms in renter-occupied houses - 4 bedrooms (%)
Bedrooms in renter-occupied houses - 5+ bedrooms (%)
Vehicles available in owner-occupied houses - no vehicle available (%)
Vehicles available in owner-occupied houses - 1 vehicle available(%)
Vehicles available in owner-occupied houses - 2 Vehicles available (%)
Vehicles available in owner-occupied houses - 3 Vehicles available (%)
Vehicles available in owner-occupied houses - 4 Vehicles available (%)
Vehicles available in owner-occupied houses - 5+ Vehicles available (%)
Vehicles available in renter-occupied houses - no vehicle available (%)
Vehicles available in renter-occupied houses - 1 vehicle available (%)
Vehicles available in renter-occupied houses - 2 Vehicles available (%)
Vehicles available in renter-occupied houses - 3 Vehicles available (%)
Vehicles available in renter-occupied houses - 4 Vehicles available (%)
Vehicles available in renter-occupied houses - 5+ Vehicles available (%)
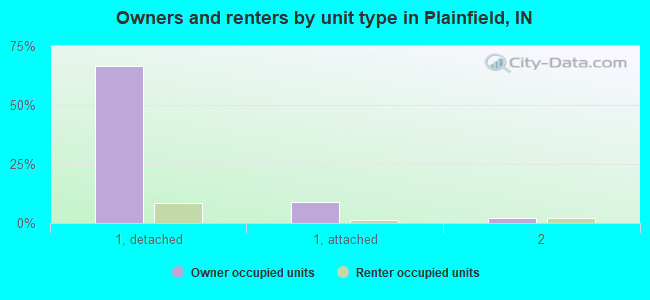
Housing units in structures - 1, detached (%)
Housing units in structures - 1, attached (%)
Housing units in structures - 2 (%)
Housing units in structures - 3 or 4 (%)
Housing units in structures - 5 to 9 (%)
Housing units in structures - 10 to 19 (%)
Housing units in structures - 20 to 49 (%)
Housing units in structures - 50 or more (%)
Housing units in structures - Mobile home (%)
Housing units in structures - Boat, RV, van, etc. (%)
Housing units in structures - Owners - 1, detached (%)
Housing units in structures - Owners - 1, attached (%)
Housing units in structures - Owners - 2 (%)
Housing units in structures - Owners - 3 or 4 (%)
Housing units in structures - Owners - 5 to 9 (%)
Housing units in structures - Owners - 10 to 19 (%)
Housing units in structures - Owners - 20 to 49 (%)
Housing units in structures - Owners - 50 or more (%)
Housing units in structures - Owners - Mobile home (%)
Housing units in structures - Owners - Boat, RV, van, etc. (%)
Housing units in structures - Renters - 1, detached (%)
Housing units in structures - Renters - 1, attached (%)
Housing units in structures - Renters - 2 (%)
Housing units in structures - Renters - 3 or 4 (%)
Housing units in structures - Renters - 5 to 9 (%)
Housing units in structures - Renters - 10 to 19 (%)
Housing units in structures - Renters - 20 to 49 (%)
Housing units in structures - Renters - 50 or more (%)
Housing units in structures - Renters - Mobile home (%)
Housing units in structures - Renters - Boat, RV, van, etc. (%)
House/condo owner moved in on average (years ago)
Renter moved in on average (years ago)
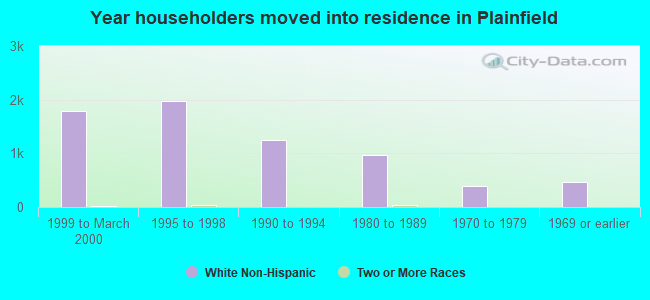
Year householder moved into unit - Moved in 1999 to March 2000 (%)
Year householder moved into unit - Moved in 1999 to March 2000 (%) - White
Year householder moved into unit - Moved in 1999 to March 2000 (%) - Black or African American
Year householder moved into unit - Moved in 1999 to March 2000 (%) - Asian
Year householder moved into unit - Moved in 1999 to March 2000 (%) - Hispanic or Latino
Year householder moved into unit - Moved in 1999 to March 2000 (%) - American Indian and Alaska Native
Year householder moved into unit - Moved in 1999 to March 2000 (%) - Multirace
Year householder moved into unit - Moved in 1999 to March 2000 (%) - Other Race
Year householder moved into unit - Moved in 1995 to 1998 (%)
Year householder moved into unit - Moved in 1995 to 1998 (%) - White
Year householder moved into unit - Moved in 1995 to 1998 (%) - Black or African American
Year householder moved into unit - Moved in 1995 to 1998 (%) - Asian
Year householder moved into unit - Moved in 1995 to 1998 (%) - Hispanic or Latino
Year householder moved into unit - Moved in 1995 to 1998 (%) - American Indian and Alaska Native
Year householder moved into unit - Moved in 1995 to 1998 (%) - Multirace
Year householder moved into unit - Moved in 1995 to 1998 (%) - Other Race
Year householder moved into unit - Moved in 1990 to 1994 (%)
Year householder moved into unit - Moved in 1990 to 1994 (%) - White
Year householder moved into unit - Moved in 1990 to 1994 (%) - Black or African American
Year householder moved into unit - Moved in 1990 to 1994 (%) - Asian
Year householder moved into unit - Moved in 1990 to 1994 (%) - Hispanic or Latino
Year householder moved into unit - Moved in 1990 to 1994 (%) - American Indian and Alaska Native
Year householder moved into unit - Moved in 1990 to 1994 (%) - Multirace
Year householder moved into unit - Moved in 1990 to 1994 (%) - Other Race
Year householder moved into unit - Moved in 1980 to 1989 (%)
Year householder moved into unit - Moved in 1980 to 1989 (%) - White
Year householder moved into unit - Moved in 1980 to 1989 (%) - Black or African American
Year householder moved into unit - Moved in 1980 to 1989 (%) - Asian
Year householder moved into unit - Moved in 1980 to 1989 (%) - Hispanic or Latino
Year householder moved into unit - Moved in 1980 to 1989 (%) - American Indian and Alaska Native
Year householder moved into unit - Moved in 1980 to 1989 (%) - Multirace
Year householder moved into unit - Moved in 1980 to 1989 (%) - Other Race
Year householder moved into unit - Moved in 1970 to 1979 (%)
Year householder moved into unit - Moved in 1970 to 1979 (%) - White
Year householder moved into unit - Moved in 1970 to 1979 (%) - Black or African American
Year householder moved into unit - Moved in 1970 to 1979 (%) - Asian
Year householder moved into unit - Moved in 1970 to 1979 (%) - Hispanic or Latino
Year householder moved into unit - Moved in 1970 to 1979 (%) - American Indian and Alaska Native
Year householder moved into unit - Moved in 1970 to 1979 (%) - Multirace
Year householder moved into unit - Moved in 1970 to 1979 (%) - Other Race
Year householder moved into unit - Moved in 1969 or earlier (%)
Year householder moved into unit - Moved in 1969 or earlier (%) - White
Year householder moved into unit - Moved in 1969 or earlier (%) - Black or African American
Year householder moved into unit - Moved in 1969 or earlier (%) - Asian
Year householder moved into unit - Moved in 1969 or earlier (%) - Hispanic or Latino
Year householder moved into unit - Moved in 1969 or earlier (%) - American Indian and Alaska Native
Year householder moved into unit - Moved in 1969 or earlier (%) - Multirace
Year householder moved into unit - Moved in 1969 or earlier (%) - Other Race
Housing units lacking complete plumbing facilities (%)
Housing units lacking complete kitchen facilities (%)
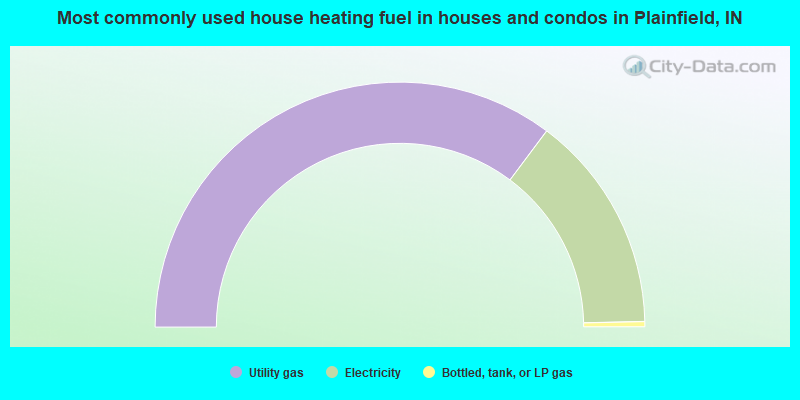
House heating fuel used in houses and condos - Utility gas (%)
House heating fuel used in houses and condos - Bottled, tank, or LP gas (%)
House heating fuel used in houses and condos - Electricity (%)
House heating fuel used in houses and condos - Fuel oil, kerosene, etc. (%)
House heating fuel used in houses and condos - Coal or coke (%)
House heating fuel used in houses and condos - Wood (%)
House heating fuel used in houses and condos - Solar energy (%)
House heating fuel used in houses and condos - Other fuel (%)
House heating fuel used in houses and condos - No fuel used (%)
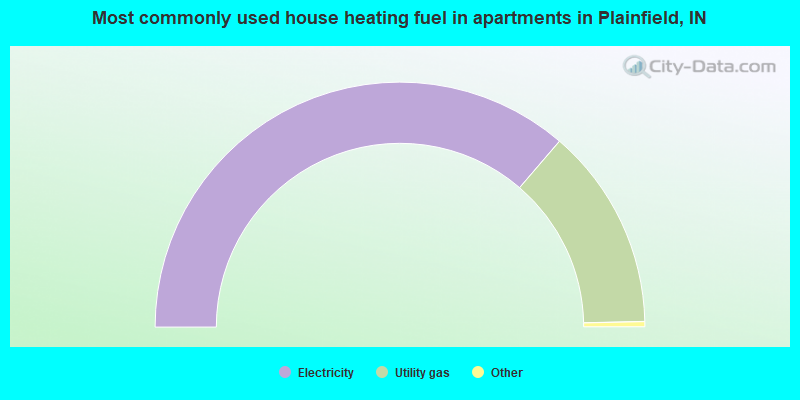
House heating fuel used in apartments - Utility gas (%)
House heating fuel used in apartments - Bottled, tank, or LP gas (%)
House heating fuel used in apartments - Electricity (%)
House heating fuel used in apartments - Fuel oil, kerosene, etc. (%)
House heating fuel used in apartments - Coal or coke (%)
House heating fuel used in apartments - Wood (%)
House heating fuel used in apartments - Solar energy (%)
House heating fuel used in apartments - Other fuel (%)
House heating fuel used in apartments - No fuel used (%)
Latest news about housing in Plainfield, IN collected exclusively by city-data.com from local newspapers, TV, and radio stations
Median year house/condo built: 2001Median year apartment built: 1997Household type by relationship:
Households: 36,455
Male householders: 6,872 (1,307 living alone ), Female householders: 6,458 (1,976 living alone )6,729 spouses (6,688 opposite-sex spouses ), 1,103 unmarried partners , (1,035 opposite-sex unmarried partners ), 9,755 children (9,154 natural , 120 adopted , 480 stepchildren ), 498 grandchildren , 631 brothers or sisters , 576 parents , 0 foster children , 548 other relatives , 828 non-relatives In group quarters: 2,450
Size of family households: 3,724 2-persons , 1,872 3-persons , 1,773 4-persons , 1,454 5-persons , 199 6-persons , 31 7-or-more-persons .
Size of nonfamily households: 3,672 1-person , 563 2-persons , 83 3-persons , 64 4-persons .
5,437 married couples with children. single-parent households (336 men , 1,291 women ).
85.8% of residents of Plainfield speak English at home. of residents speak Spanish at home (77% speak English very well , 19% speak English well , 3% speak English not well ).of residents speak other Indo-European language at home (59% speak English very well , 16% speak English well , 16% speak English not well , 9% don't speak English at all ).of residents speak Asian or Pacific Island language at home (50% speak English very well , 32% speak English well , 18% speak English not well ).of residents speak other language at home (28% speak English very well , 20% speak English well , 52% speak English not well ).
Foreign born population: 5,087 (14.0%)of them are naturalized citizens )
Median number of rooms in houses and condos:
Median number of rooms in apartments
Owner-occupied Renter-occupied
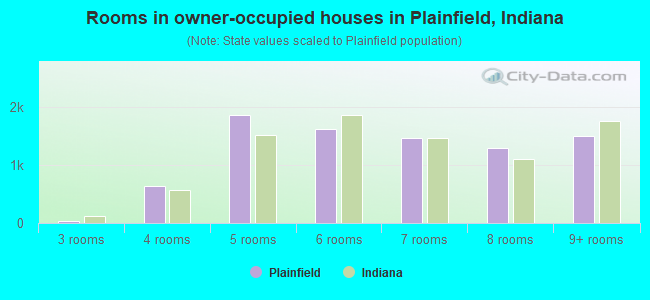
Rooms in owner-occupied houses in Plainfield, Indiana
12 1 room 0 2 rooms 35 3 rooms 627 4 rooms 1,855 5 rooms 1,618 6 rooms 1,466 7 rooms 1,288 8 rooms 1,495 9+ rooms
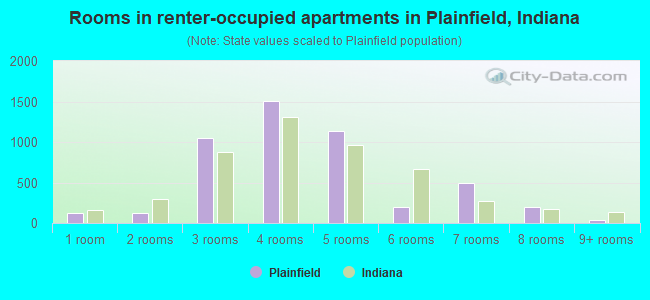
Rooms in renter-occupied apartments in Plainfield, Indiana
122 1 room 120 2 rooms 1,046 3 rooms 1,503 4 rooms 1,135 5 rooms 201 6 rooms 499 7 rooms 203 8 rooms 35 9+ rooms
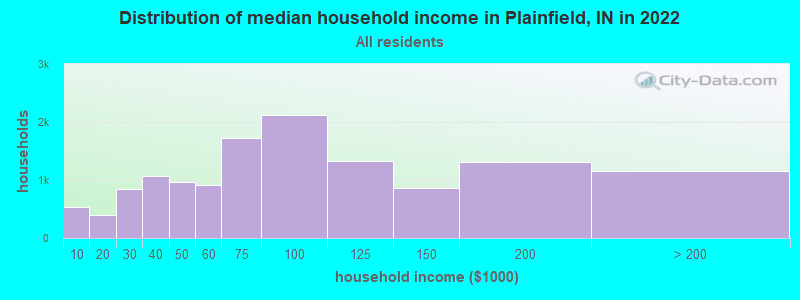
Plainfield, IN household income distribution 540 Less than $10,000391 $10,000 to $19,999841 $20,000 to $29,9991,074 $30,000 to $39,999966 $40,000 to $49,999917 $50,000 to $59,9991,716 $60,000 to $74,9992,116 $75,000 to $99,9991,332 $100,000 to $124,999858 $125,000 to $149,9991,315 $150,000 to $199,9991,156 $200,000 or more
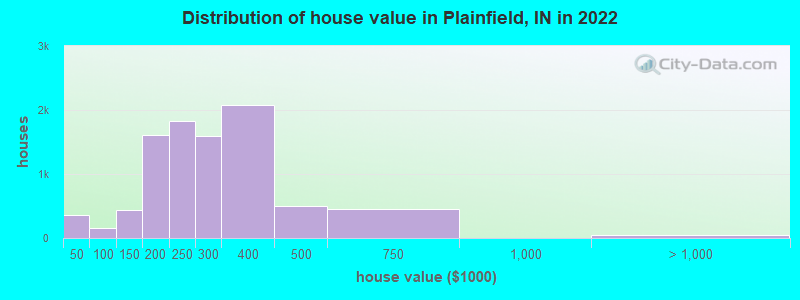
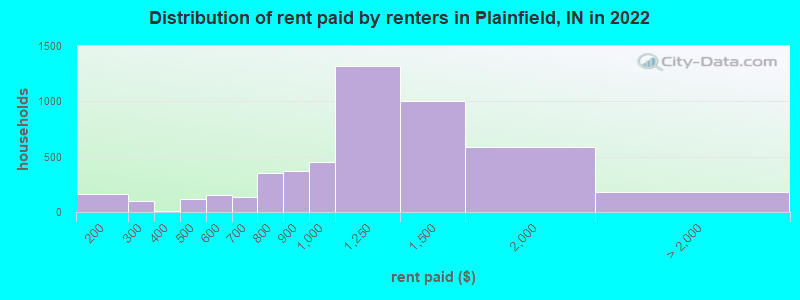
Home value of owner - occupied houses in 2022 in Plainfield, IN 216 Less than $10,0008 $10,000 to $14,99974 $20,000 to $24,9997 $25,000 to $29,99937 $30,000 to $34,9997 $35,000 to $39,9995 $50,000 to $59,99932 $60,000 to $69,9994 $70,000 to $79,9998 $80,000 to $89,999100 $90,000 to $99,999194 $100,000 to $124,999237 $125,000 to $149,999768 $150,000 to $174,999844 $175,000 to $199,9991,834 $200,000 to $249,9991,590 $250,000 to $299,9992,071 $300,000 to $399,999505 $400,000 to $499,999450 $500,000 to $749,99914 $1,000,000 to $1,499,99915 $1,500,000 to $1,999,99917 $2,000,000 or moreRent paid by renters in 2022 in Plainfield, IN 163 $150 to $19946 $200 to $24948 $250 to $2998 $350 to $399105 $400 to $44913 $450 to $49976 $500 to $54980 $550 to $59927 $600 to $649104 $650 to $699223 $700 to $749130 $750 to $799371 $800 to $899452 $900 to $9991,315 $1,000 to $1,2491,004 $1,250 to $1,499588 $1,500 to $1,99946 $2,000 to $2,499133 No cash rent
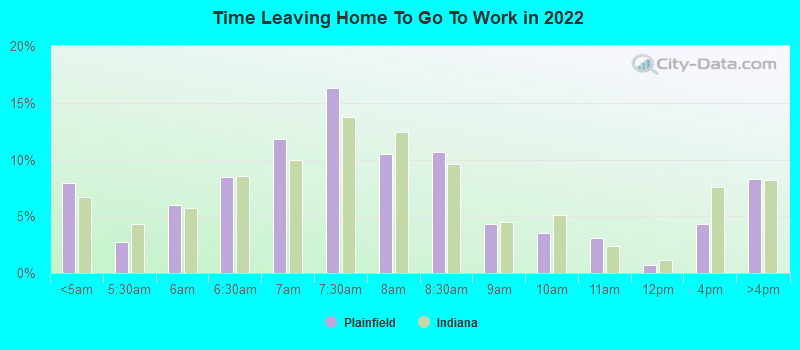
Percentage of workers working in this county: 57.7%Number of people working at home: 2,848 (16.4% of all workers )
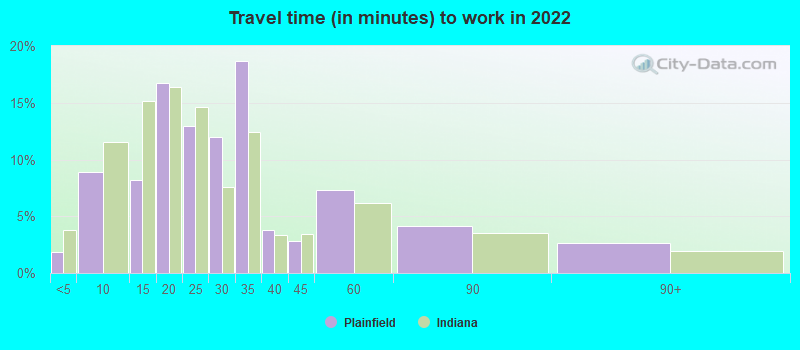
Travel time to work (commute)
Less than 5 minutes: 4925 to 9 minutes: 1,86210 to 14 minutes: 1,76715 to 19 minutes: 2,47020 to 24 minutes: 2,20525 to 29 minutes: 1,48830 to 34 minutes: 1,60435 to 39 minutes: 50840 to 44 minutes: 42145 to 59 minutes: 1,13360 to 89 minutes: 16890 or more minutes: 231
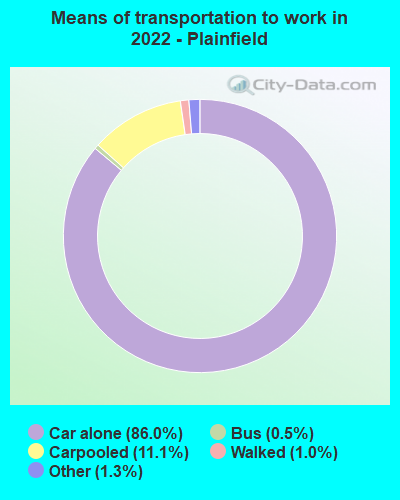
Means of transportation to work:
Drove a car alone: 26,134 (77.3%)Carpooled: 3,722 (11.0%)Bus : 130 (0.4%)Taxi: 486 (1.4%)Bicycle: 15 (0.0%)Walked: 319 (0.9%)Worked at home: 2,848 (8.4%)
Unemployment by race in 2022
Unemployment rate for White non-Hispanic residents 2.1% Males2.8% FemalesUnemployment rate for Black residents 8.3% MalesUnemployment rate for Asian residents 0.3% FemalesUnemployment rate for two or more race residents 6.8% Males13.7% FemalesUnemployment rate for Hispanic or Latino residents 7.0% Males10.3% Females
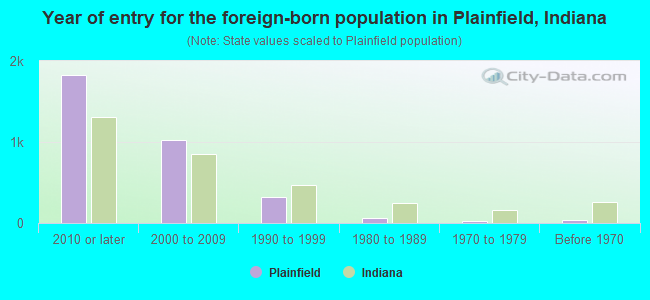
Year of entry for the foreign-born population in Plainfield, Indiana
1,828 2010 or later 1,022 2000 to 2009 324 1990 to 1999 57 1980 to 1989 29 1970 to 1979 41 Before 1970
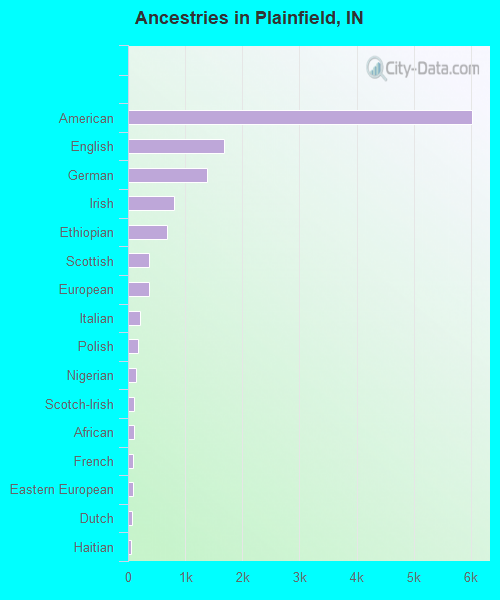
First ancestries reported:
American: 6,016 (38.9%)
English: 1,685 (10.9%)
German: 1,391 (9.0%)
Irish: 810 (5.2%)
Ethiopian: 691 (4.5%)
Scottish: 366 (2.4%)
European: 359 (2.3%)
Italian: 214 (1.4%)
Polish: 179 (1.2%)
Nigerian: 143 (0.9%)
Scotch-Irish: 110 (0.7%)
African: 98 (0.6%)
French: 96 (0.6%)
Eastern European: 91 (0.6%)
Dutch: 71 (0.5%)
Haitian: 56 (0.4%)
Egyptian: 49 (0.3%)
Welsh: 37 (0.2%)
Romanian: 36 (0.2%)
Northern European: 26 (0.2%)
Austrian: 25 (0.2%)
British: 23 (0.1%)
Jamaican: 18 (0.1%)
Croatian: 17 (0.1%)
Norwegian: 16 (0.1%)
Scandinavian: 15 (0.10%)
Slovene: 13 (0.08%)
Russian: 12 (0.08%)
Belgian: 11 (0.07%)
Finnish: 9 (0.06%)
Ukrainian: 8 (0.05%)
Hungarian: 7 (0.05%)
Greek: 6 (0.04%) Most common places of birth for foreign-born residents (%): Ethiopia Plainfield:
23.4% (866)Indiana:
0.7% (2,532)
India Plainfield:
19.4% (716)Indiana:
8.5% (32,127)
Mexico Plainfield:
9.3% (344)Indiana:
27.0% (101,996)
Pakistan Plainfield:
6.9% (255)Indiana:
0.9% (3,221)
Philippines Plainfield:
6.6% (245)Indiana:
3.1% (11,851)
Haiti Plainfield:
4.1% (153)Indiana:
1.2% (4,484)
Panama Plainfield:
4.0% (149)Indiana:
0.3% (977)
Nigeria Plainfield:
3.8% (139)Indiana:
3.3% (12,337)
Congo Plainfield:
3.5% (131)Indiana:
0.2% (918)
China, excluding Hong Kong and Taiwan Plainfield:
3.1% (115)Indiana:
5.3% (19,877)
Vietnam Plainfield:
2.8% (103)Indiana:
1.8% (6,645)
Spain Plainfield:
2.7% (100)Indiana:
0.4% (1,393)
Taiwan Plainfield:
2.0% (74)Indiana:
0.6% (2,272)
Eritrea Plainfield:
1.8% (67)Indiana:
0.2% (804)
Guatemala Plainfield:
1.5% (56)Indiana:
2.3% (8,656)
Place of birth for U.S.-born residents:
This state: 21,638Other state: 10,110Northeast: 870Midwest: 3,924South: 3,625West: 1,689 81.1% of Plainfield residents lived in the same house 1 years ago.
Out of people who lived in different houses, 24.1% lived in this county.
Out of people who lived in different counties, 82.0% lived in Indiana.
Plainfield:
81.1%State average:
87.1%
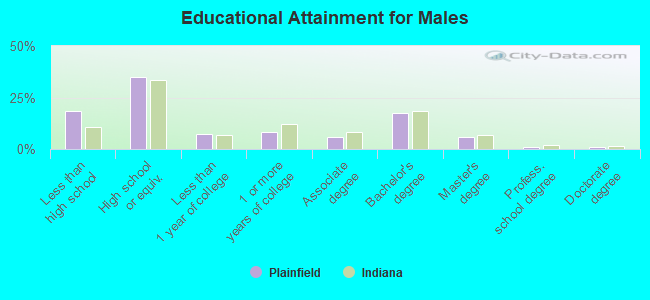
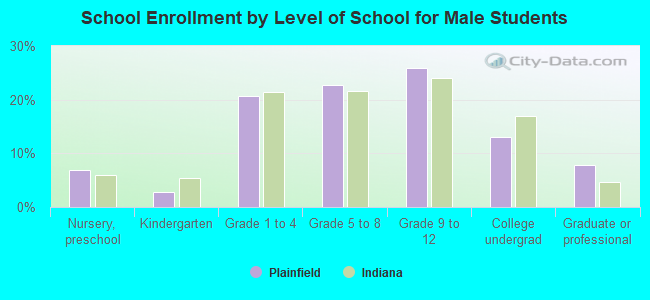
Education attainment for males 25 years and older:
No schooling: 153Nursery to 4th grade: 245th and 6th grade: 617th and 8th grade: 399th grade: 48010th grade: 47011th grade: 30112th grade, no diploma: 981High school graduate (or equivalency): 4,764Less than 1 year of college: 987Some college more than 1 year, no degree: 1,113Associate degree: 787Bachelor's degree: 2,395Master's degree: 820Professional school degree: 108Doctorate degree: 135
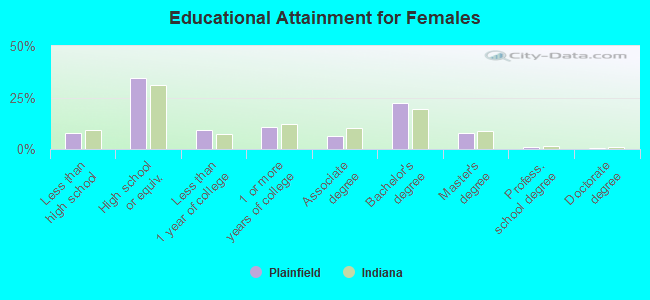
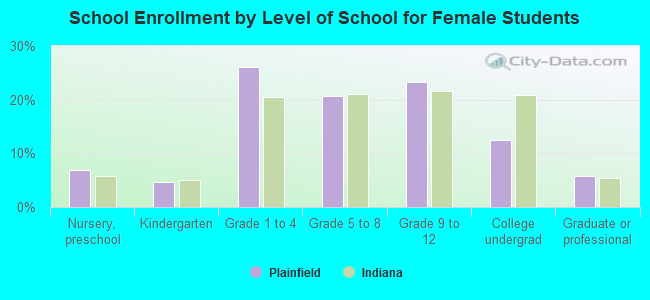
Education attainment for females 25 years and older:
No schooling: 112Nursery to 4th grade: 05th and 6th grade: 07th and 8th grade: 869th grade: 6010th grade: 27711th grade: 16312th grade, no diploma: 219High school graduate (or equivalency): 4,142Less than 1 year of college: 1,108Some college more than 1 year, no degree: 1,295Associate degree: 787Bachelor's degree: 2,668Master's degree: 931Professional school degree: 133Doctorate degree: 84
Housing units in structures:
One, detached: 8,806One, attached: 1,015Two: 2633 or 4: 3505 to 9: 99110 to 19: 1,26820 to 49: 32350 or more: 375Mobile homes: 416Median worth of mobile homes: $11,413
Housing units lacking complete plumbing facilities in 2022: 0.2%Housing units lacking complete kitchen facilities in 2022: 1.5%House/condo owner moved in on average 11 years ago
Renter moved in on average 3 years ago
Private vs. public school enrollment:
Students in private schools in grades 1 to 8 (elementary and middle school): 467 Students in private schools in grades 9 to 12 (high school): 44 Students in private undergraduate colleges: 176