Ponca City, OK (Oklahoma) Houses and Residents
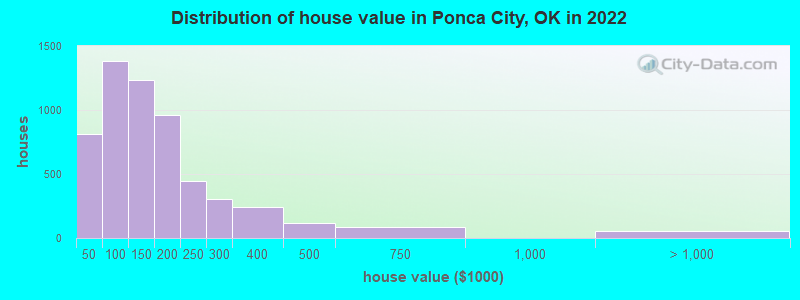
Estimated median house or condo value in 2022: $133,684 (it was $58,300 in 2000 )
Ponca City:
$133,684Oklahoma:
$191,700
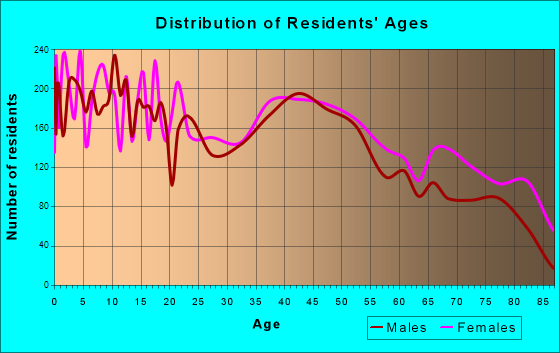
Lower value quartile - upper value quartile: $80,567 - $191,034Total population: 24,766 (All urban)
Houses: 11,746 (9,475 occupied: 5,942 owner occupied, 3,710 renter occupied )
% of renters here:
38%State:
35%
Housing density: 648 houses/condos per square mile
Median price asked for vacant for-sale houses and condos in 2022: $64,518.
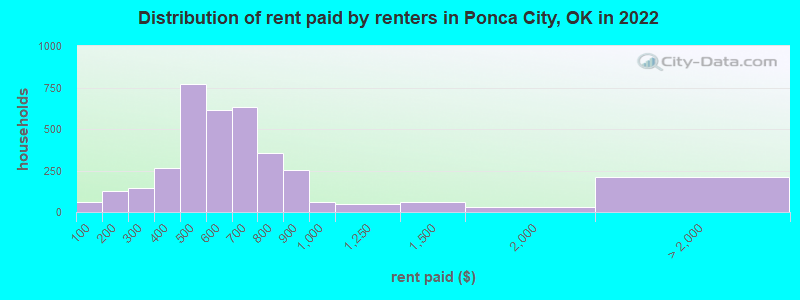
Median contract rent in 2022: $567 (lower quartile is $449, upper quartile is $693)
Median rent asked for vacant for-rent units in 2022: $749
Median gross rent in Ponca City, OK in 2022: $784
Housing units in Ponca City with a mortgage: 2,816 (165 second mortgage, 0 home equity loan, 137 both second mortgage and home equity loan )Houses without a mortgage: 155
Median household income for houses/condos with a mortgage: $72,745
Median household income for apartments without a mortgage: $53,718
Median monthly housing costs: $759
Data:
Median house or condo value ($)
Median house or condo value ($ change since 2000)
Median house or condo value ($) - White
Median house or condo value ($) - Black or African American
Median house or condo value ($) - Asian
Median house or condo value ($) - Hispanic or Latino
Median house or condo value ($) - American Indian and Alaska Native
Median house or condo value ($) - Multirace
Median house or condo value ($) - Other Race
Median price asked for mobile homes ($)
Household density (households per square mile)
Mean house or condo value by units in structure - 1, detached ($)
Mean house or condo value by units in structure - 1, attached ($)
Mean house or condo value by units in structure - 2 ($)
Mean house or condo value by units in structure by units in structure - 3 or 4 ($)
Mean house or condo value by units in structure - 5 or more ($)
Mean house or condo value by units in structure - Boat, RV, van, etc. ($)
Mean house or condo value by units in structure - Mobile home ($)
Median contract rent ($)
Median contract rent - Lower quartile ($)
Median contract rent - Upper quartile ($)
Median gross rent ($)
Urban houses (%)
Rural houses (%)
Houses occupied (%)
Houses occupied (% change since 2000)
Houses owner occupied (%)
Houses owner occupied (% change since 2000)
Houses renter occupied (%)
Houses renter occupied (% change since 2000)
Vacant housing units - For rent (%)
Vacant housing units - For rent (% change since 2000)
Vacant housing units - For sale only (%)
Vacant housing units - For sale only (% change since 2000)
Vacant housing units - Rented or sold, not occupied (%)
Vacant housing units - Rented or sold, not occupied (% change since 2000)
Vacant housing units - For seasonal, recreational, or occasional use (%)
Vacant housing units - For seasonal, recreational, or occasional use (% change since 2000)
Vacant housing units - For migrant workers (%)
Vacant housing units - For migrant workers (% change since 2000)
Vacant housing units - Other vacant (%)
Vacant housing units - Other vacant (% change since 2000)
Median monthly housing costs ($)
Median household income for houses/condos with a mortgage ($)
Median household income for houses/condos without a mortgage ($)
Median household income ($)
Median household income ($) - White
Median household income ($) - Black or African American
Median household income ($) - Asian
Median household income ($) - Hispanic or Latino
Median household income ($) - American Indian and Alaska Native
Median household income ($) - Multirace
Median household income ($) - Other Race
Mortgage status - with mortgage (%)
Mortgage status - with second mortgage (%)
Mortgage status - with home equity loan (%)
Mortgage status - with both second mortgage and home equity loan (%)
Mortgage status - without a mortgage (%)
Median year house/condo built
Median year apartment built
Household type by relationship - Male householder living alone (%)
Household type by relationship - Male householder not living alone (%)
Household type by relationship - Female householder living alone (%)
Household type by relationship - Female householder not living alone (%)
Household type by relationship - Opposite-Sex spouse (%)
Household type by relationship - Same-Sex spouse (%)
Household type by relationship - Opposite-Sex unmarried partner (%)
Household type by relationship - Same-Sex unmarried partner (%)
Household type by relationship - In group quarters (%)
Size of family households - 2-person household (%)
Size of family households - 3-person household (%)
Size of family households - 4-person household (%)
Size of family households - 5-person household (%)
Size of family households - 6-person household (%)
Size of family households - 7-or-more-person household (%)
Size of nonfamily households - 1-person household (%)
Size of nonfamily households - 2-person household (%)
Size of nonfamily households - 3-person household (%)
Size of nonfamily households - 4-person household (%)
Size of nonfamily households - 5-person household (%)
Size of nonfamily households - 6-person household (%)
Size of nonfamily households - 7-or-moreperson household (%)
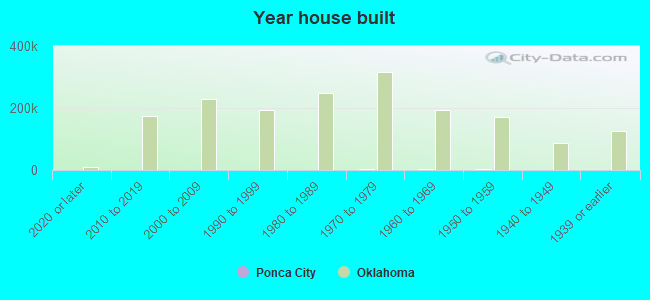
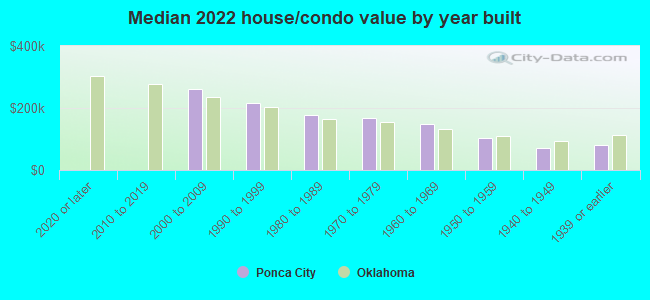
Year house built - Built 2010 or later (%)
Year house built - Built 2000 to 2009 (%)
Year house built - Built 1990 to 1999 (%)
Year house built - Built 1980 to 1989 (%)
Year house built - Built 1970 to 1979 (%)
Year house built - Built 1960 to 1969 (%)
Year house built - Built 1950 to 1959 (%)
Year house built - Built 1940 to 1949 (%)
Year house built - Built 1939 or earlier (%)
Median number of rooms in houses and condos
Median number of rooms in apartments
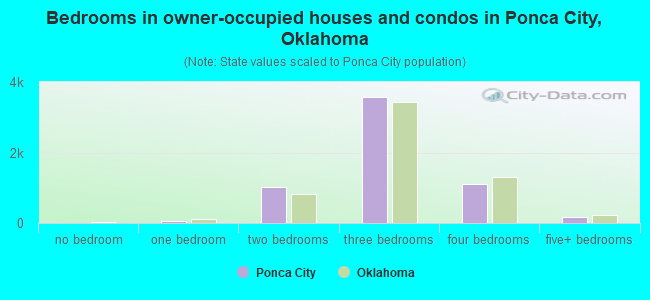
Median number of bedrooms in owner occupied houses
Mean number of bedrooms in owner occupied houses
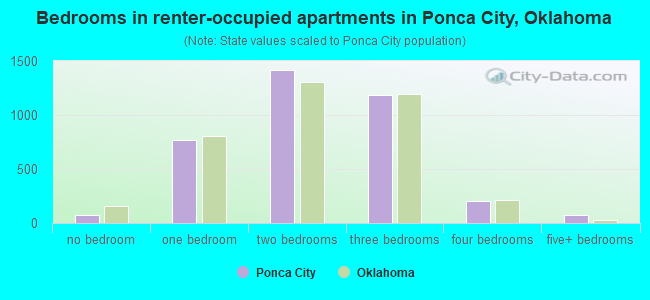
Median number of bedrooms in renter occupied houses
Mean number of bedrooms in renter occupied houses
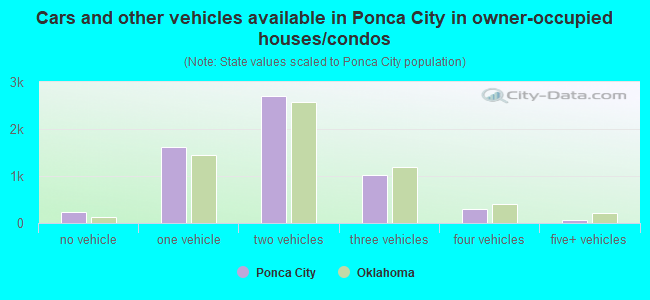
Median number of vehichles in owner occupied houses
Mean number of vehichles in owner occupied houses
Median number of vehichles in renter occupied houses
Mean number of vehichles in renter occupied houses
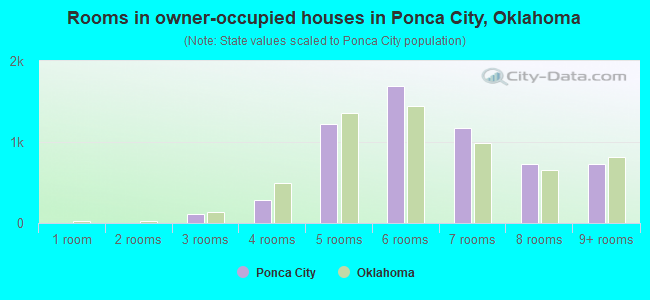
Rooms in owner-occupied houses - 1 room (%)
Rooms in owner-occupied houses - 2 rooms (%)
Rooms in owner-occupied houses - 3 rooms (%)
Rooms in owner-occupied houses - 4 rooms (%)
Rooms in owner-occupied houses - 5 rooms (%)
Rooms in owner-occupied houses - 6 rooms (%)
Rooms in owner-occupied houses - 7 rooms (%)
Rooms in owner-occupied houses - 8 rooms (%)
Rooms in owner-occupied houses - 9+ rooms (%)
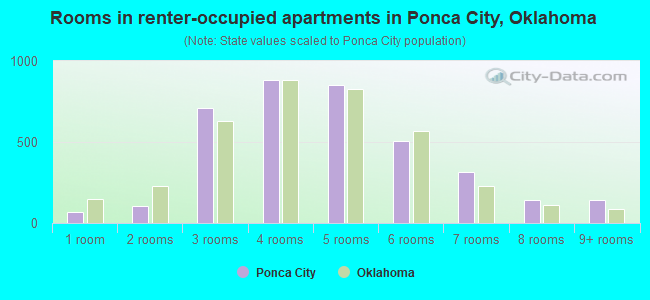
Rooms in renter-occupied houses - 1 room (%)
Rooms in renter-occupied houses - 2 rooms (%)
Rooms in renter-occupied houses - 3 rooms (%)
Rooms in renter-occupied houses - 4 rooms (%)
Rooms in renter-occupied houses - 5 rooms (%)
Rooms in renter-occupied houses - 6 rooms (%)
Rooms in renter-occupied houses - 7 rooms (%)
Rooms in renter-occupied houses - 8 rooms (%)
Rooms in renter-occupied houses - 9+ rooms (%)
Bedrooms in owner-occupied houses - no bedrooms (%)
Bedrooms in owner-occupied houses - 1 bedroom (%)
Bedrooms in owner-occupied houses - 2 bedrooms (%)
Bedrooms in owner-occupied houses - 3 bedrooms (%)
Bedrooms in owner-occupied houses - 4 bedrooms (%)
Bedrooms in owner-occupied houses - 5+ bedrooms (%)
Bedrooms in renter-occupied houses - no bedrooms (%)
Bedrooms in renter-occupied houses - 1 bedroom (%)
Bedrooms in renter-occupied houses - 2 bedrooms (%)
Bedrooms in renter-occupied houses - 3 bedrooms (%)
Bedrooms in renter-occupied houses - 4 bedrooms (%)
Bedrooms in renter-occupied houses - 5+ bedrooms (%)
Vehicles available in owner-occupied houses - no vehicle available (%)
Vehicles available in owner-occupied houses - 1 vehicle available(%)
Vehicles available in owner-occupied houses - 2 Vehicles available (%)
Vehicles available in owner-occupied houses - 3 Vehicles available (%)
Vehicles available in owner-occupied houses - 4 Vehicles available (%)
Vehicles available in owner-occupied houses - 5+ Vehicles available (%)
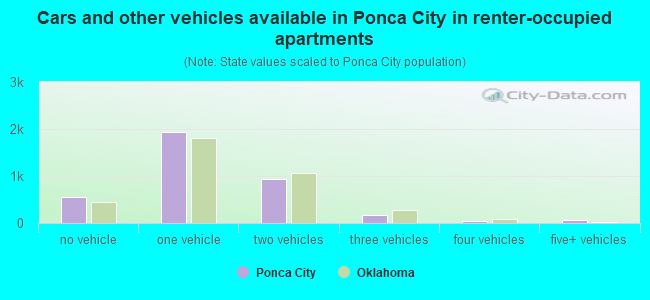
Vehicles available in renter-occupied houses - no vehicle available (%)
Vehicles available in renter-occupied houses - 1 vehicle available (%)
Vehicles available in renter-occupied houses - 2 Vehicles available (%)
Vehicles available in renter-occupied houses - 3 Vehicles available (%)
Vehicles available in renter-occupied houses - 4 Vehicles available (%)
Vehicles available in renter-occupied houses - 5+ Vehicles available (%)
Housing units in structures - 1, detached (%)
Housing units in structures - 1, attached (%)
Housing units in structures - 2 (%)
Housing units in structures - 3 or 4 (%)
Housing units in structures - 5 to 9 (%)
Housing units in structures - 10 to 19 (%)
Housing units in structures - 20 to 49 (%)
Housing units in structures - 50 or more (%)
Housing units in structures - Mobile home (%)
Housing units in structures - Boat, RV, van, etc. (%)
Housing units in structures - Owners - 1, detached (%)
Housing units in structures - Owners - 1, attached (%)
Housing units in structures - Owners - 2 (%)
Housing units in structures - Owners - 3 or 4 (%)
Housing units in structures - Owners - 5 to 9 (%)
Housing units in structures - Owners - 10 to 19 (%)
Housing units in structures - Owners - 20 to 49 (%)
Housing units in structures - Owners - 50 or more (%)
Housing units in structures - Owners - Mobile home (%)
Housing units in structures - Owners - Boat, RV, van, etc. (%)
Housing units in structures - Renters - 1, detached (%)
Housing units in structures - Renters - 1, attached (%)
Housing units in structures - Renters - 2 (%)
Housing units in structures - Renters - 3 or 4 (%)
Housing units in structures - Renters - 5 to 9 (%)
Housing units in structures - Renters - 10 to 19 (%)
Housing units in structures - Renters - 20 to 49 (%)
Housing units in structures - Renters - 50 or more (%)
Housing units in structures - Renters - Mobile home (%)
Housing units in structures - Renters - Boat, RV, van, etc. (%)
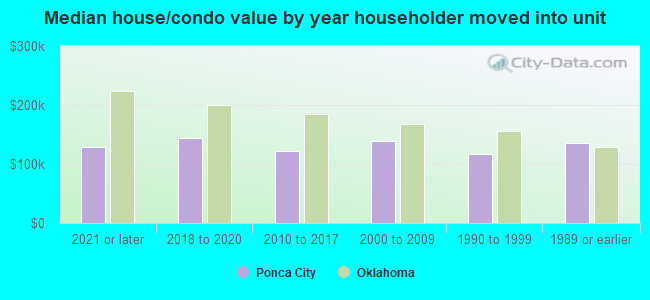
House/condo owner moved in on average (years ago)
Renter moved in on average (years ago)
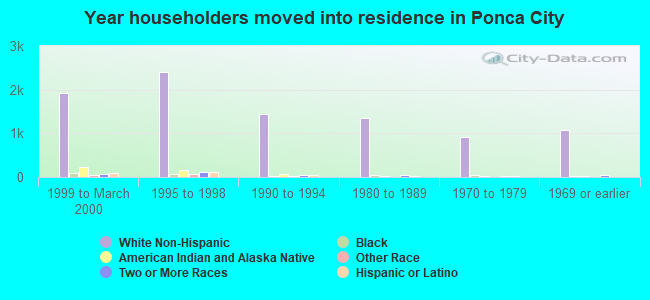
Year householder moved into unit - Moved in 1999 to March 2000 (%)
Year householder moved into unit - Moved in 1999 to March 2000 (%) - White
Year householder moved into unit - Moved in 1999 to March 2000 (%) - Black or African American
Year householder moved into unit - Moved in 1999 to March 2000 (%) - Asian
Year householder moved into unit - Moved in 1999 to March 2000 (%) - Hispanic or Latino
Year householder moved into unit - Moved in 1999 to March 2000 (%) - American Indian and Alaska Native
Year householder moved into unit - Moved in 1999 to March 2000 (%) - Multirace
Year householder moved into unit - Moved in 1999 to March 2000 (%) - Other Race
Year householder moved into unit - Moved in 1995 to 1998 (%)
Year householder moved into unit - Moved in 1995 to 1998 (%) - White
Year householder moved into unit - Moved in 1995 to 1998 (%) - Black or African American
Year householder moved into unit - Moved in 1995 to 1998 (%) - Asian
Year householder moved into unit - Moved in 1995 to 1998 (%) - Hispanic or Latino
Year householder moved into unit - Moved in 1995 to 1998 (%) - American Indian and Alaska Native
Year householder moved into unit - Moved in 1995 to 1998 (%) - Multirace
Year householder moved into unit - Moved in 1995 to 1998 (%) - Other Race
Year householder moved into unit - Moved in 1990 to 1994 (%)
Year householder moved into unit - Moved in 1990 to 1994 (%) - White
Year householder moved into unit - Moved in 1990 to 1994 (%) - Black or African American
Year householder moved into unit - Moved in 1990 to 1994 (%) - Asian
Year householder moved into unit - Moved in 1990 to 1994 (%) - Hispanic or Latino
Year householder moved into unit - Moved in 1990 to 1994 (%) - American Indian and Alaska Native
Year householder moved into unit - Moved in 1990 to 1994 (%) - Multirace
Year householder moved into unit - Moved in 1990 to 1994 (%) - Other Race
Year householder moved into unit - Moved in 1980 to 1989 (%)
Year householder moved into unit - Moved in 1980 to 1989 (%) - White
Year householder moved into unit - Moved in 1980 to 1989 (%) - Black or African American
Year householder moved into unit - Moved in 1980 to 1989 (%) - Asian
Year householder moved into unit - Moved in 1980 to 1989 (%) - Hispanic or Latino
Year householder moved into unit - Moved in 1980 to 1989 (%) - American Indian and Alaska Native
Year householder moved into unit - Moved in 1980 to 1989 (%) - Multirace
Year householder moved into unit - Moved in 1980 to 1989 (%) - Other Race
Year householder moved into unit - Moved in 1970 to 1979 (%)
Year householder moved into unit - Moved in 1970 to 1979 (%) - White
Year householder moved into unit - Moved in 1970 to 1979 (%) - Black or African American
Year householder moved into unit - Moved in 1970 to 1979 (%) - Asian
Year householder moved into unit - Moved in 1970 to 1979 (%) - Hispanic or Latino
Year householder moved into unit - Moved in 1970 to 1979 (%) - American Indian and Alaska Native
Year householder moved into unit - Moved in 1970 to 1979 (%) - Multirace
Year householder moved into unit - Moved in 1970 to 1979 (%) - Other Race
Year householder moved into unit - Moved in 1969 or earlier (%)
Year householder moved into unit - Moved in 1969 or earlier (%) - White
Year householder moved into unit - Moved in 1969 or earlier (%) - Black or African American
Year householder moved into unit - Moved in 1969 or earlier (%) - Asian
Year householder moved into unit - Moved in 1969 or earlier (%) - Hispanic or Latino
Year householder moved into unit - Moved in 1969 or earlier (%) - American Indian and Alaska Native
Year householder moved into unit - Moved in 1969 or earlier (%) - Multirace
Year householder moved into unit - Moved in 1969 or earlier (%) - Other Race
Housing units lacking complete plumbing facilities (%)
Housing units lacking complete kitchen facilities (%)
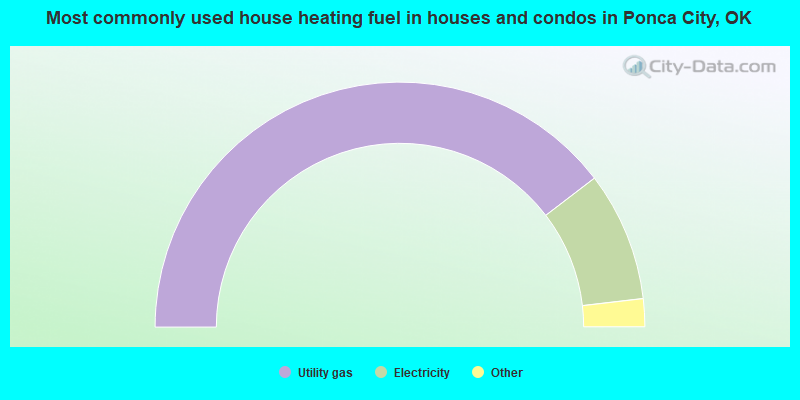
House heating fuel used in houses and condos - Utility gas (%)
House heating fuel used in houses and condos - Bottled, tank, or LP gas (%)
House heating fuel used in houses and condos - Electricity (%)
House heating fuel used in houses and condos - Fuel oil, kerosene, etc. (%)
House heating fuel used in houses and condos - Coal or coke (%)
House heating fuel used in houses and condos - Wood (%)
House heating fuel used in houses and condos - Solar energy (%)
House heating fuel used in houses and condos - Other fuel (%)
House heating fuel used in houses and condos - No fuel used (%)
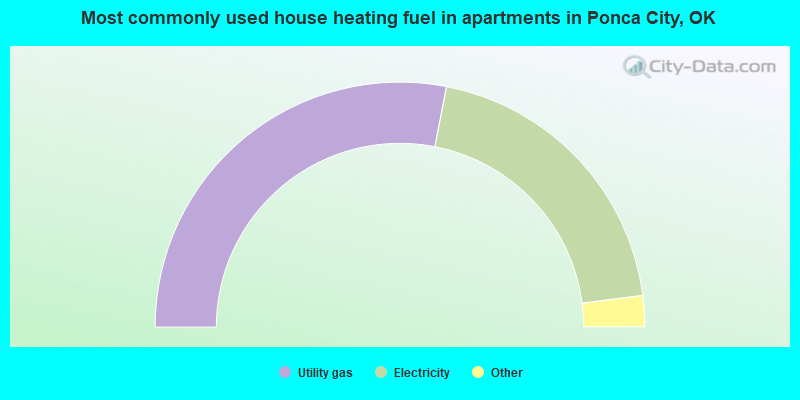
House heating fuel used in apartments - Utility gas (%)
House heating fuel used in apartments - Bottled, tank, or LP gas (%)
House heating fuel used in apartments - Electricity (%)
House heating fuel used in apartments - Fuel oil, kerosene, etc. (%)
House heating fuel used in apartments - Coal or coke (%)
House heating fuel used in apartments - Wood (%)
House heating fuel used in apartments - Solar energy (%)
House heating fuel used in apartments - Other fuel (%)
House heating fuel used in apartments - No fuel used (%)
Median year house/condo built: 1964Median year apartment built: 1967Household type by relationship:
Households: 24,744
Male householders: 4,712 (1,414 living alone ), Female householders: 4,746 (1,508 living alone )3,967 spouses (3,967 opposite-sex spouses ), 661 unmarried partners , (657 opposite-sex unmarried partners ), 7,542 children (6,413 natural , 153 adopted , 974 stepchildren ), 504 grandchildren , 192 brothers or sisters , 364 parents , 69 foster children , 194 other relatives , 1,077 non-relatives In group quarters: 711
Size of family households: 2,823 2-persons , 1,068 3-persons , 1,162 4-persons , 484 5-persons , 238 6-persons , 133 7-or-more-persons .
Size of nonfamily households: 2,956 1-person , 694 2-persons , 68 3-persons , 29 4-persons .
3,429 married couples with children. single-parent households (606 men , 1,448 women ).
93.8% of residents of Ponca City speak English at home. of residents speak Spanish at home (78% speak English very well , 15% speak English well , 8% speak English not well ).of residents speak other Indo-European language at home (68% speak English very well , 26% speak English well , 6% speak English not well ).of residents speak Asian or Pacific Island language at home (67% speak English very well , 33% speak English well ).of residents speak other language at home (74% speak English very well , 14% speak English well , 12% speak English not well ).
Foreign born population: 664 (2.7%)of them are naturalized citizens )
Median number of rooms in houses and condos:
Median number of rooms in apartments
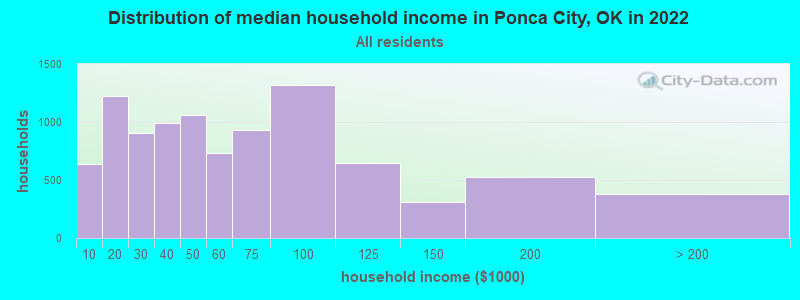
Ponca City, OK household income distribution 634 Less than $10,0001,225 $10,000 to $19,999907 $20,000 to $29,999989 $30,000 to $39,9991,061 $40,000 to $49,999731 $50,000 to $59,999927 $60,000 to $74,9991,321 $75,000 to $99,999646 $100,000 to $124,999313 $125,000 to $149,999525 $150,000 to $199,999382 $200,000 or more
Home value of owner - occupied houses in 2022 in Ponca City, OK 125 Less than $10,00054 $10,000 to $14,999110 $15,000 to $19,999106 $20,000 to $24,99980 $25,000 to $29,99987 $30,000 to $34,99985 $35,000 to $39,999165 $40,000 to $49,999264 $50,000 to $59,999189 $60,000 to $69,999242 $70,000 to $79,999314 $80,000 to $89,999207 $90,000 to $99,999749 $100,000 to $124,999488 $125,000 to $149,999725 $150,000 to $174,999234 $175,000 to $199,999443 $200,000 to $249,999303 $250,000 to $299,999238 $300,000 to $399,999119 $400,000 to $499,99983 $500,000 to $749,9992 $1,000,000 to $1,499,99954 $1,500,000 to $1,999,999Rent paid by renters in 2022 in Ponca City, OK 61 Less than $100128 $150 to $19970 $200 to $24973 $250 to $29964 $300 to $349200 $350 to $399335 $400 to $449438 $450 to $499250 $500 to $549361 $550 to $599364 $600 to $649270 $650 to $699251 $700 to $749105 $750 to $799253 $800 to $89961 $900 to $99947 $1,000 to $1,24958 $1,250 to $1,49928 $1,500 to $1,99916 $2,000 to $2,499191 No cash rent
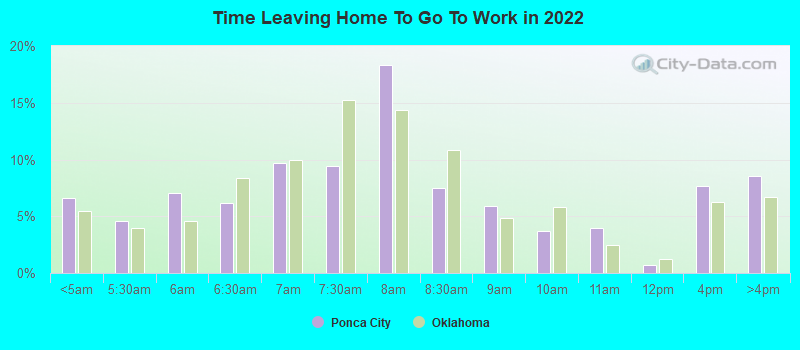
Percentage of workers working in this county: 90.4%Number of people working at home: 544 (5.1% of all workers )
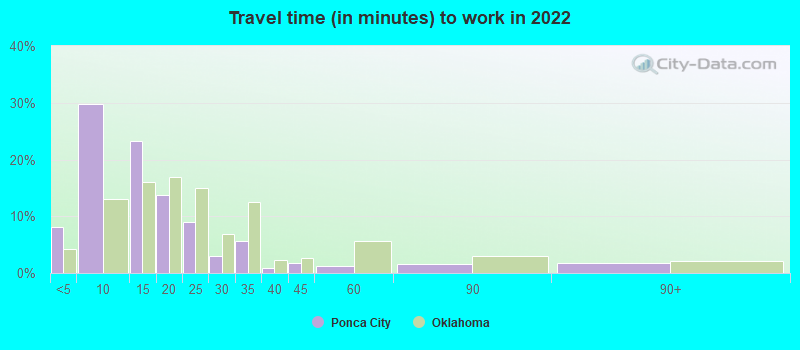
Travel time to work (commute)
Less than 5 minutes: 8685 to 9 minutes: 3,25010 to 14 minutes: 2,66615 to 19 minutes: 1,23520 to 24 minutes: 59225 to 29 minutes: 25530 to 34 minutes: 36835 to 39 minutes: 1740 to 44 minutes: 15645 to 59 minutes: 23560 to 89 minutes: 21390 or more minutes: 179
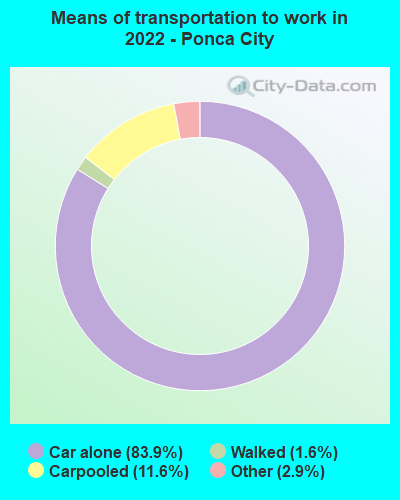
Means of transportation to work:
Drove a car alone: 8,606 (78.8%)Carpooled: 1,214 (11.1%)Taxi: 285 (2.6%)Walked: 162 (1.5%)Worked at home: 544 (5.0%)
Unemployment by race in 2022
Unemployment rate for White non-Hispanic residents 5.9% Males6.3% FemalesUnemployment rate for Black residents 5.8% Males15.0% FemalesUnemployment rate for American Indian and Alaska Native residents 4.7% Males11.5% FemalesUnemployment rate for other race residents 5.3% MalesUnemployment rate for two or more race residents 3.5% Males0.6% FemalesUnemployment rate for Hispanic or Latino residents 4.7% Males6.8% Females
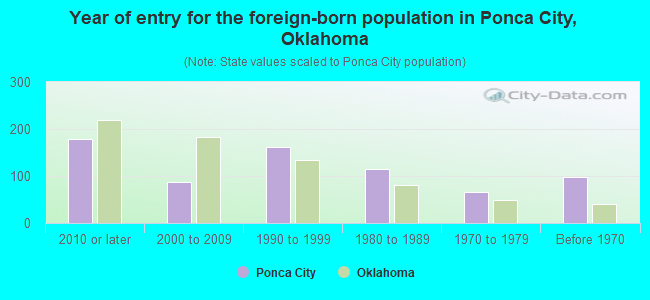
Year of entry for the foreign-born population in Ponca City, Oklahoma
179 2010 or later 88 2000 to 2009 161 1990 to 1999 114 1980 to 1989 66 1970 to 1979 97 Before 1970
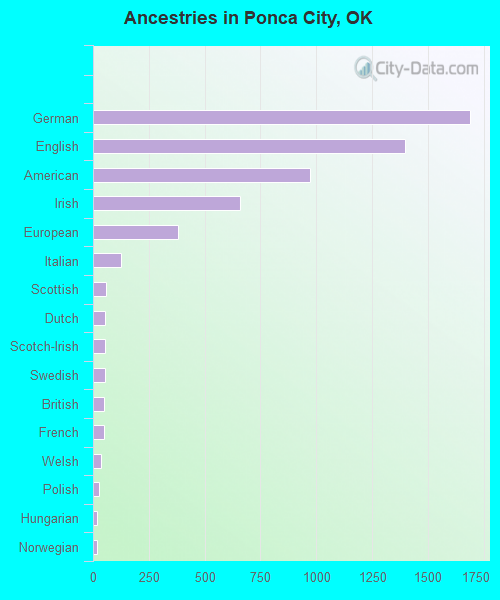
First ancestries reported:
German: 1,689 (18.1%)
English: 1,397 (15.0%)
American: 974 (10.4%)
Irish: 659 (7.1%)
European: 380 (4.1%)
Italian: 124 (1.3%)
Scottish: 59 (0.6%)
Dutch: 55 (0.6%)
Scotch-Irish: 55 (0.6%)
Swedish: 52 (0.6%)
British: 51 (0.5%)
French: 49 (0.5%)
Welsh: 35 (0.4%)
Polish: 25 (0.3%)
Hungarian: 20 (0.2%)
Norwegian: 17 (0.2%)
Greek: 15 (0.2%)
Danish: 14 (0.1%)
French Canadian: 14 (0.1%)
Eastern European: 13 (0.1%)
Lithuanian: 11 (0.1%)
Portuguese: 9 (0.10%)
Russian: 7 (0.07%)
Northern European: 4 (0.04%)
Pennsylvania German: 4 (0.04%)
Dutch West Indian: 3 (0.03%) Most common places of birth for foreign-born residents (%): Mexico Ponca City:
47.0% (312)Oklahoma:
42.4% (103,425)
Barbados Ponca City:
11.9% (79)Oklahoma:
0.1% (173)
Spain Ponca City:
8.9% (59)Oklahoma:
0.2% (590)
Germany Ponca City:
6.6% (44)Oklahoma:
2.3% (5,498)
Philippines Ponca City:
5.3% (35)Oklahoma:
2.3% (5,671)
United Kingdom, excluding England and Scotland Ponca City:
5.3% (35)Oklahoma:
0.5% (1,194)
China, excluding Hong Kong and Taiwan Ponca City:
4.8% (32)Oklahoma:
3.2% (7,698)
England Ponca City:
2.6% (17)Oklahoma:
0.8% (1,922)
India Ponca City:
2.6% (17)Oklahoma:
4.1% (10,034)
Asia, n.e.c. Ponca City:
2.4% (16)Oklahoma:
0.2% (385)
Sweden Ponca City:
2.0% (13)Oklahoma:
0.1% (179)
Other Australian and New Zealand Subregion Ponca City:
2.0% (13)Oklahoma:
0.0% (112)
Thailand Ponca City:
1.7% (11)Oklahoma:
1.0% (2,465)
Place of birth for U.S.-born residents:
This state: 15,048Other state: 8,747Northeast: 319Midwest: 4,238South: 2,321West: 1,868 81.8% of Ponca City residents lived in the same house 1 years ago.
Out of people who lived in different houses, 36.3% lived in this county.
Out of people who lived in different counties, 62.5% lived in Oklahoma.
Ponca City:
81.8%State average:
85.5%
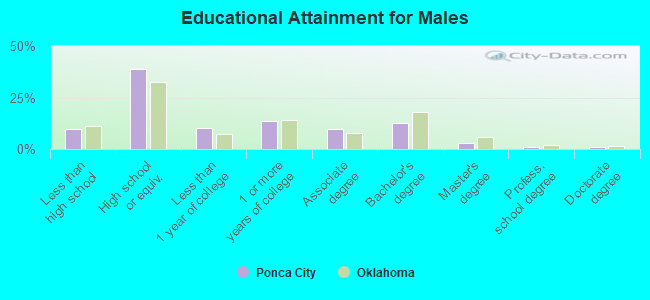
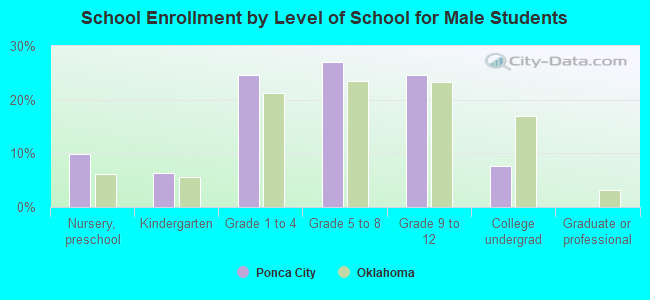
Education attainment for males 25 years and older:
No schooling: 41Nursery to 4th grade: 685th and 6th grade: 777th and 8th grade: 99th grade: 6210th grade: 6111th grade: 28312th grade, no diploma: 151High school graduate (or equivalency): 3,075Less than 1 year of college: 824Some college more than 1 year, no degree: 1,072Associate degree: 782Bachelor's degree: 1,000Master's degree: 247Professional school degree: 81Doctorate degree: 80
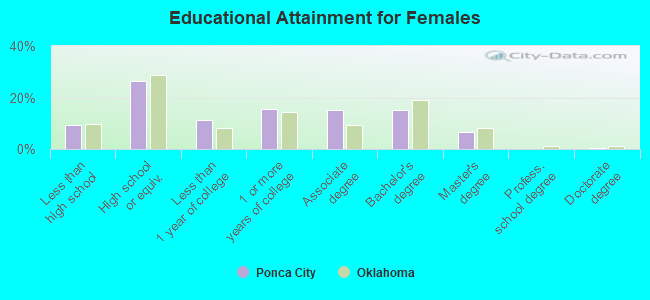
Education attainment for females 25 years and older:
No schooling: 15Nursery to 4th grade: 155th and 6th grade: 307th and 8th grade: 1009th grade: 4710th grade: 19911th grade: 22712th grade, no diploma: 161High school graduate (or equivalency): 2,223Less than 1 year of college: 954Some college more than 1 year, no degree: 1,288Associate degree: 1,258Bachelor's degree: 1,281Master's degree: 547Professional school degree: 4Doctorate degree: 17
Housing units in structures:
One, detached: 9,351One, attached: 241Two: 3183 or 4: 5335 to 9: 32710 to 19: 28020 to 49: 24550 or more: 198Mobile homes: 227Boats, RVs, vans, etc.: 22Housing units lacking complete plumbing facilities in 2022: 6.3%Housing units lacking complete kitchen facilities in 2022: 8.3%House/condo owner moved in on average 10 years ago
Renter moved in on average 3 years ago
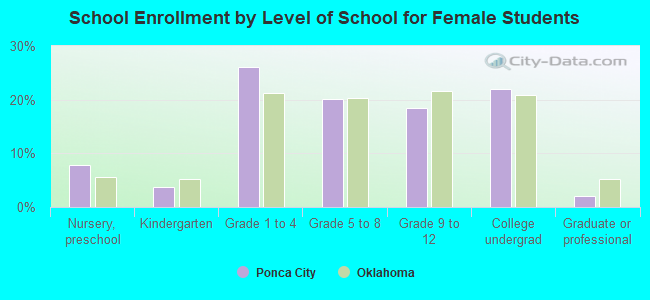
Private vs. public school enrollment:
Students in private schools in grades 1 to 8 (elementary and middle school): 553 Students in private schools in grades 9 to 12 (high school): 105 Students in private undergraduate colleges: 123